|
|
市場調査レポート
商品コード
1627016
整備・修理・オーバーホール(MRO)流通の世界市場 2024-2028年Global Maintenance, Repair, and Overhaul (MRO) Distribution Market 2024-2028 |
||||||

|
|||||||
カスタマイズ可能
|
|||||||

| 整備・修理・オーバーホール(MRO)流通の世界市場 2024-2028年 |
|
出版日: 2024年07月22日
発行: TechNavio
ページ情報: 英文 195 Pages
納期: 即納可能
|

全表示
- 概要
- 図表
- 目次
整備・修理・オーバーホール(MRO)流通市場は2023-2028年に727億米ドル、予測期間中のCAGRは2.06%で成長すると予測されます。当レポートでは、整備・修理・オーバーホール(MRO)流通市場の全体的な分析、市場規模と予測、動向、成長促進要因、課題、約25のベンダーを網羅したベンダー分析などを掲載しています。
現在の市場シナリオ、最新動向と促進要因、市場環境全体に関する最新分析を提供しています。この市場は、世界のインダストリー4.0の浸透、産業運営の中断を防ぐためのロボット利用の増加、軍用機の耐用年数延長などが牽引しています。
| 市場範囲 | |
|---|---|
| 基準年 | 2024 |
| 終了年 | 2028 |
| 予測期間 | 2024-2028 |
| 成長モメンタム | 加速 |
| 前年比2024年 | 2.03% |
| CAGR | 2.06% |
| 増分額 | 727億米ドル |
本調査では、今後数年間の整備・修理・オーバーホール(MRO)流通市場の成長を促進する主な要因の1つとして、性能とメンテナンスの必要性を追跡するスマート機器技術を挙げています。また、MROにおける拡張現実(AR)の実装や、MRO企業による持続可能な実践への関心の高まりは、市場の大きな需要につながります。
目次
第1章 エグゼクティブサマリー
- 市場概要
第2章 市場情勢
- 市場エコシステム
- 市場の特徴
- バリューチェーン分析
第3章 市場規模
- 市場の定義
- 市場セグメント分析
- 市場規模 2023
- 市場の見通し 2023-2028
第4章 市場規模実績
- 整備・修理・オーバーホール(MRO)流通の世界市場 2018-2022
- 用途別セグメント分析 2018-2022
- タイプ別セグメント分析 2018-2022
- 地域別セグメント分析 2018-2022
- 国別セグメント分析 2018-2022
第5章 ファイブフォース分析
- ファイブフォースの要約
- 買い手の交渉力
- 供給企業の交渉力
- 新規参入業者の脅威
- 代替品の脅威
- 競争の脅威
- 市況
第6章 市場セグメンテーション:用途別
- 市場セグメント
- 比較:用途別
- 化学薬品:市場規模と予測 2023-2028
- 輸送機関:市場規模と予測 2023-2028
- 食品飲料およびタバコ:市場規模と予測 2023-2028
- 電気・電子:市場規模と予測 2023-2028
- その他:市場規模と予測 2023-2028
- 市場機会:用途別
第7章 市場セグメンテーション:タイプ別
- 市場セグメント
- 比較:タイプ別
- 産業:市場規模と予測 2023-2028
- 電気:市場規模と予測 2023-2028
- 施設:市場規模と予測 2023-2028
- その他:市場規模と予測 2023-2028
- 市場機会:タイプ別
第8章 顧客情勢
- 顧客情勢の概要
第9章 地域別情勢
- 地域別セグメンテーション
- 地域別比較
- 北米:市場規模と予測 2023-2028
- 欧州:市場規模と予測 2023-2028
- アジア太平洋:市場規模と予測 2023-2028
- 南米:市場規模と予測 2023-2028
- 中東・アフリカ:市場規模と予測 2023-2028
- 米国:市場規模と予測 2023-2028
- ドイツ:市場規模と予測 2023-2028
- 中国:市場規模と予測 2023-2028
- 英国:市場規模と予測 2023-2028
- 日本:市場規模と予測 2023-2028
- 市場機会:地域情勢別
第10章 促進要因・課題・機会・抑制要因
- 市場促進要因
- 市場の課題
- 促進要因と課題の影響
- 市場の機会・抑制要因
第11章 競合情勢
- 概要
- 競合情勢
- 混乱の状況
- 業界のリスク
第12章 競合分析
- 企業プロファイル
- 企業の市場ポジショニング
- Air Liquide SA
- Applied Industrial Technologies Inc.
- Fastenal Co.
- Ferguson plc
- Forge Industries Co.
- Genuine Parts Co.
- Home Depot Inc.
- Honeywell International Inc.
- Nidec Corp.
- NOW Inc.
- R.S. Hughes Co. Inc.
- SHV Holdings N.V.
- W.W. Grainger Inc.
- Wajax Corp.
- WESCO International Inc.
第13章 付録
Exhibits:
- Exhibits1: Executive Summary - Chart on Market Overview
- Exhibits2: Executive Summary - Data Table on Market Overview
- Exhibits3: Executive Summary - Chart on Global Market Characteristics
- Exhibits4: Executive Summary - Chart on Market By Geographical Landscape
- Exhibits5: Executive Summary - Chart on Market Segmentation by Application
- Exhibits6: Executive Summary - Chart on Market Segmentation by Type
- Exhibits7: Executive Summary - Chart on Incremental Growth
- Exhibits8: Executive Summary - Data Table on Incremental Growth
- Exhibits9: Executive Summary - Chart on Company Market Positioning
- Exhibits10: Parent Market
- Exhibits11: Data Table on - Parent Market
- Exhibits12: Market characteristics analysis
- Exhibits13: Value Chain Analysis
- Exhibits14: Offerings of companies included in the market definition
- Exhibits15: Market segments
- Exhibits16: Chart on Global - Market size and forecast 2023-2028 ($ billion)
- Exhibits17: Data Table on Global - Market size and forecast 2023-2028 ($ billion)
- Exhibits18: Chart on Global Market: Year-over-year growth 2023-2028 (%)
- Exhibits19: Data Table on Global Market: Year-over-year growth 2023-2028 (%)
- Exhibits20: Historic Market Size - Data Table on Global Maintenance, Repair, And Overhaul (MRO) Distribution Market 2018 - 2022 ($ billion)
- Exhibits21: Historic Market Size - Application Segment 2018 - 2022 ($ billion)
- Exhibits22: Historic Market Size - Type Segment 2018 - 2022 ($ billion)
- Exhibits23: Historic Market Size - Geography Segment 2018 - 2022 ($ billion)
- Exhibits24: Historic Market Size - Country Segment 2018 - 2022 ($ billion)
- Exhibits25: Five forces analysis - Comparison between 2023 and 2028
- Exhibits26: Bargaining power of buyers - Impact of key factors 2023 and 2028
- Exhibits27: Bargaining power of suppliers - Impact of key factors in 2023 and 2028
- Exhibits28: Threat of new entrants - Impact of key factors in 2023 and 2028
- Exhibits29: Threat of substitutes - Impact of key factors in 2023 and 2028
- Exhibits30: Threat of rivalry - Impact of key factors in 2023 and 2028
- Exhibits31: Chart on Market condition - Five forces 2023 and 2028
- Exhibits32: Chart on Application - Market share 2023-2028 (%)
- Exhibits33: Data Table on Application - Market share 2023-2028 (%)
- Exhibits34: Chart on Comparison by Application
- Exhibits35: Data Table on Comparison by Application
- Exhibits36: Chart on Chemicals - Market size and forecast 2023-2028 ($ billion)
- Exhibits37: Data Table on Chemicals - Market size and forecast 2023-2028 ($ billion)
- Exhibits38: Chart on Chemicals - Year-over-year growth 2023-2028 (%)
- Exhibits39: Data Table on Chemicals - Year-over-year growth 2023-2028 (%)
- Exhibits40: Chart on Transportation - Market size and forecast 2023-2028 ($ billion)
- Exhibits41: Data Table on Transportation - Market size and forecast 2023-2028 ($ billion)
- Exhibits42: Chart on Transportation - Year-over-year growth 2023-2028 (%)
- Exhibits43: Data Table on Transportation - Year-over-year growth 2023-2028 (%)
- Exhibits44: Chart on Food beverage and tobacco - Market size and forecast 2023-2028 ($ billion)
- Exhibits45: Data Table on Food beverage and tobacco - Market size and forecast 2023-2028 ($ billion)
- Exhibits46: Chart on Food beverage and tobacco - Year-over-year growth 2023-2028 (%)
- Exhibits47: Data Table on Food beverage and tobacco - Year-over-year growth 2023-2028 (%)
- Exhibits48: Chart on Electricals and electronics - Market size and forecast 2023-2028 ($ billion)
- Exhibits49: Data Table on Electricals and electronics - Market size and forecast 2023-2028 ($ billion)
- Exhibits50: Chart on Electricals and electronics - Year-over-year growth 2023-2028 (%)
- Exhibits51: Data Table on Electricals and electronics - Year-over-year growth 2023-2028 (%)
- Exhibits52: Chart on Others - Market size and forecast 2023-2028 ($ billion)
- Exhibits53: Data Table on Others - Market size and forecast 2023-2028 ($ billion)
- Exhibits54: Chart on Others - Year-over-year growth 2023-2028 (%)
- Exhibits55: Data Table on Others - Year-over-year growth 2023-2028 (%)
- Exhibits56: Market opportunity by Application ($ billion)
- Exhibits57: Data Table on Market opportunity by Application ($ billion)
- Exhibits58: Chart on Type - Market share 2023-2028 (%)
- Exhibits59: Data Table on Type - Market share 2023-2028 (%)
- Exhibits60: Chart on Comparison by Type
- Exhibits61: Data Table on Comparison by Type
- Exhibits62: Chart on Industrial - Market size and forecast 2023-2028 ($ billion)
- Exhibits63: Data Table on Industrial - Market size and forecast 2023-2028 ($ billion)
- Exhibits64: Chart on Industrial - Year-over-year growth 2023-2028 (%)
- Exhibits65: Data Table on Industrial - Year-over-year growth 2023-2028 (%)
- Exhibits66: Chart on Electrical - Market size and forecast 2023-2028 ($ billion)
- Exhibits67: Data Table on Electrical - Market size and forecast 2023-2028 ($ billion)
- Exhibits68: Chart on Electrical - Year-over-year growth 2023-2028 (%)
- Exhibits69: Data Table on Electrical - Year-over-year growth 2023-2028 (%)
- Exhibits70: Chart on Facility - Market size and forecast 2023-2028 ($ billion)
- Exhibits71: Data Table on Facility - Market size and forecast 2023-2028 ($ billion)
- Exhibits72: Chart on Facility - Year-over-year growth 2023-2028 (%)
- Exhibits73: Data Table on Facility - Year-over-year growth 2023-2028 (%)
- Exhibits74: Chart on Others - Market size and forecast 2023-2028 ($ billion)
- Exhibits75: Data Table on Others - Market size and forecast 2023-2028 ($ billion)
- Exhibits76: Chart on Others - Year-over-year growth 2023-2028 (%)
- Exhibits77: Data Table on Others - Year-over-year growth 2023-2028 (%)
- Exhibits78: Market opportunity by Type ($ billion)
- Exhibits79: Data Table on Market opportunity by Type ($ billion)
- Exhibits80: Analysis of price sensitivity, lifecycle, customer purchase basket, adoption rates, and purchase criteria
- Exhibits81: Chart on Market share By Geographical Landscape 2023-2028 (%)
- Exhibits82: Data Table on Market share By Geographical Landscape 2023-2028 (%)
- Exhibits83: Chart on Geographic comparison
- Exhibits84: Data Table on Geographic comparison
- Exhibits85: Chart on North America - Market size and forecast 2023-2028 ($ billion)
- Exhibits86: Data Table on North America - Market size and forecast 2023-2028 ($ billion)
- Exhibits87: Chart on North America - Year-over-year growth 2023-2028 (%)
- Exhibits88: Data Table on North America - Year-over-year growth 2023-2028 (%)
- Exhibits89: Chart on Europe - Market size and forecast 2023-2028 ($ billion)
- Exhibits90: Data Table on Europe - Market size and forecast 2023-2028 ($ billion)
- Exhibits91: Chart on Europe - Year-over-year growth 2023-2028 (%)
- Exhibits92: Data Table on Europe - Year-over-year growth 2023-2028 (%)
- Exhibits93: Chart on APAC - Market size and forecast 2023-2028 ($ billion)
- Exhibits94: Data Table on APAC - Market size and forecast 2023-2028 ($ billion)
- Exhibits95: Chart on APAC - Year-over-year growth 2023-2028 (%)
- Exhibits96: Data Table on APAC - Year-over-year growth 2023-2028 (%)
- Exhibits97: Chart on South America - Market size and forecast 2023-2028 ($ billion)
- Exhibits98: Data Table on South America - Market size and forecast 2023-2028 ($ billion)
- Exhibits99: Chart on South America - Year-over-year growth 2023-2028 (%)
- Exhibits100: Data Table on South America - Year-over-year growth 2023-2028 (%)
- Exhibits101: Chart on Middle East and Africa - Market size and forecast 2023-2028 ($ billion)
- Exhibits102: Data Table on Middle East and Africa - Market size and forecast 2023-2028 ($ billion)
- Exhibits103: Chart on Middle East and Africa - Year-over-year growth 2023-2028 (%)
- Exhibits104: Data Table on Middle East and Africa - Year-over-year growth 2023-2028 (%)
- Exhibits105: Chart on US - Market size and forecast 2023-2028 ($ billion)
- Exhibits106: Data Table on US - Market size and forecast 2023-2028 ($ billion)
- Exhibits107: Chart on US - Year-over-year growth 2023-2028 (%)
- Exhibits108: Data Table on US - Year-over-year growth 2023-2028 (%)
- Exhibits109: Chart on Germany - Market size and forecast 2023-2028 ($ billion)
- Exhibits110: Data Table on Germany - Market size and forecast 2023-2028 ($ billion)
- Exhibits111: Chart on Germany - Year-over-year growth 2023-2028 (%)
- Exhibits112: Data Table on Germany - Year-over-year growth 2023-2028 (%)
- Exhibits113: Chart on China - Market size and forecast 2023-2028 ($ billion)
- Exhibits114: Data Table on China - Market size and forecast 2023-2028 ($ billion)
- Exhibits115: Chart on China - Year-over-year growth 2023-2028 (%)
- Exhibits116: Data Table on China - Year-over-year growth 2023-2028 (%)
- Exhibits117: Chart on UK - Market size and forecast 2023-2028 ($ billion)
- Exhibits118: Data Table on UK - Market size and forecast 2023-2028 ($ billion)
- Exhibits119: Chart on UK - Year-over-year growth 2023-2028 (%)
- Exhibits120: Data Table on UK - Year-over-year growth 2023-2028 (%)
- Exhibits121: Chart on Japan - Market size and forecast 2023-2028 ($ billion)
- Exhibits122: Data Table on Japan - Market size and forecast 2023-2028 ($ billion)
- Exhibits123: Chart on Japan - Year-over-year growth 2023-2028 (%)
- Exhibits124: Data Table on Japan - Year-over-year growth 2023-2028 (%)
- Exhibits125: Market opportunity By Geographical Landscape ($ billion)
- Exhibits126: Data Tables on Market opportunity By Geographical Landscape ($ billion)
- Exhibits127: Impact of drivers and challenges in 2023 and 2028
- Exhibits128: Overview on criticality of inputs and factors of differentiation
- Exhibits129: Overview on factors of disruption
- Exhibits130: Impact of key risks on business
- Exhibits131: Companies covered
- Exhibits132: Matrix on companies position and classification
- Exhibits133: Air Liquide SA - Overview
- Exhibits134: Air Liquide SA - Business segments
- Exhibits135: Air Liquide SA - Key news
- Exhibits136: Air Liquide SA - Key offerings
- Exhibits137: Air Liquide SA - Segment focus
- Exhibits138: Applied Industrial Technologies Inc. - Overview
- Exhibits139: Applied Industrial Technologies Inc. - Business segments
- Exhibits140: Applied Industrial Technologies Inc. - Key news
- Exhibits141: Applied Industrial Technologies Inc. - Key offerings
- Exhibits142: Applied Industrial Technologies Inc. - Segment focus
- Exhibits143: Fastenal Co. - Overview
- Exhibits144: Fastenal Co. - Product / Service
- Exhibits145: Fastenal Co. - Key offerings
- Exhibits146: Ferguson plc - Overview
- Exhibits147: Ferguson plc - Business segments
- Exhibits148: Ferguson plc - Key news
- Exhibits149: Ferguson plc - Key offerings
- Exhibits150: Ferguson plc - Segment focus
- Exhibits151: Forge Industries Co. - Overview
- Exhibits152: Forge Industries Co. - Product / Service
- Exhibits153: Forge Industries Co. - Key offerings
- Exhibits154: Genuine Parts Co. - Overview
- Exhibits155: Genuine Parts Co. - Business segments
- Exhibits156: Genuine Parts Co. - Key offerings
- Exhibits157: Genuine Parts Co. - Segment focus
- Exhibits158: Home Depot Inc. - Overview
- Exhibits159: Home Depot Inc. - Business segments
- Exhibits160: Home Depot Inc. - Key news
- Exhibits161: Home Depot Inc. - Key offerings
- Exhibits162: Home Depot Inc. - Segment focus
- Exhibits163: Honeywell International Inc. - Overview
- Exhibits164: Honeywell International Inc. - Business segments
- Exhibits165: Honeywell International Inc. - Key news
- Exhibits166: Honeywell International Inc. - Key offerings
- Exhibits167: Honeywell International Inc. - Segment focus
- Exhibits168: Nidec Corp. - Overview
- Exhibits169: Nidec Corp. - Business segments
- Exhibits170: Nidec Corp. - Key news
- Exhibits171: Nidec Corp. - Key offerings
- Exhibits172: Nidec Corp. - Segment focus
- Exhibits173: NOW Inc. - Overview
- Exhibits174: NOW Inc. - Business segments
- Exhibits175: NOW Inc. - Key offerings
- Exhibits176: NOW Inc. - Segment focus
- Exhibits177: R.S. Hughes Co. Inc. - Overview
- Exhibits178: R.S. Hughes Co. Inc. - Product / Service
- Exhibits179: R.S. Hughes Co. Inc. - Key offerings
- Exhibits180: SHV Holdings N.V. - Overview
- Exhibits181: SHV Holdings N.V. - Product / Service
- Exhibits182: SHV Holdings N.V. - Key offerings
- Exhibits183: W.W. Grainger Inc. - Overview
- Exhibits184: W.W. Grainger Inc. - Business segments
- Exhibits185: W.W. Grainger Inc. - Key offerings
- Exhibits186: W.W. Grainger Inc. - Segment focus
- Exhibits187: Wajax Corp. - Overview
- Exhibits188: Wajax Corp. - Product / Service
- Exhibits189: Wajax Corp. - Key offerings
- Exhibits190: WESCO International Inc. - Overview
- Exhibits191: WESCO International Inc. - Business segments
- Exhibits192: WESCO International Inc. - Key offerings
- Exhibits193: WESCO International Inc. - Segment focus
- Exhibits194: Inclusions checklist
- Exhibits195: Exclusions checklist
- Exhibits196: Currency conversion rates for US$
- Exhibits197: Research methodology
- Exhibits198: Information sources
- Exhibits199: Data validation
- Exhibits200: Validation techniques employed for market sizing
- Exhibits201: Data synthesis
- Exhibits202: 360 degree market analysis
- Exhibits203: List of abbreviations
The maintenance, repair, and overhaul (MRO) distribution market is forecasted to grow by USD 72.7 bn during 2023-2028, accelerating at a CAGR of 2.06% during the forecast period. The report on the maintenance, repair, and overhaul (MRO) distribution market provides a holistic analysis, market size and forecast, trends, growth drivers, challenges, and vendor analysis covering around 25 vendors.
The report offers an up-to-date analysis regarding the current market scenario, the latest trends and drivers, and the overall market environment. The market is driven by increasing penetration of industry 4.0 globally, increased use of robots to ensure uninterrupted industrial operations, and service-life extension of military aircraft.
Technavio's maintenance, repair, and overhaul (MRO) distribution market is segmented as below:
| Market Scope | |
|---|---|
| Base Year | 2024 |
| End Year | 2028 |
| Series Year | 2024-2028 |
| Growth Momentum | Accelerate |
| YOY 2024 | 2.03% |
| CAGR | 2.06% |
| Incremental Value | $72.7 bn |
By Application
- Chemicals
- Transportation
- Food beverage and tobacco
- Electricals and electronics
- Others
By Type
- Industrial
- Electrical
- Facility
- Others
By Geographical Landscape
- North America
- Europe
- APAC
- South America
- Middle East and Africa
This study identifies the smart equipment technology to track performance and maintenance needs as one of the prime reasons driving the maintenance, repair, and overhaul (MRO) distribution market growth during the next few years. Also, implementation of augmented reality (ar) in MRO and growing focus on sustainability practices by MRO companies will lead to sizable demand in the market.
The report on the maintenance, repair, and overhaul (MRO) distribution market covers the following areas:
- Maintenance, repair, and overhaul (MRO) distribution market sizing
- Maintenance, repair, and overhaul (MRO) distribution market forecast
- Maintenance, repair, and overhaul (MRO) distribution market industry analysis
The robust vendor analysis is designed to help clients improve their market position, and in line with this, this report provides a detailed analysis of several leading maintenance, repair, and overhaul (MRO) distribution market vendors that include Air Liquide SA, Applied Industrial Technologies Inc., Colam Entreprendre, Fastenal Co., Ferguson PLC, Forge Industries Co., Genuine Parts Co., Gitanjali Industrial Mart Pvt.Ltd., Home Depot Inc., Honeywell International Inc., MRC Global Inc., Nidec Corp., NOW Inc., R.S. Hughes Co. Inc., RTX Corp., SHV Holdings N.V., SUMINISTROS Y SERVICIOS INDUSTRIALES SERVITEC S.A., W.W. Grainger Inc., Wajax Corp., and WESCO International Inc.. Also, the maintenance, repair, and overhaul (MRO) distribution market analysis report includes information on upcoming trends and challenges that will influence market growth. This is to help companies strategize and leverage all forthcoming growth opportunities.
The study was conducted using an objective combination of primary and secondary information including inputs from key participants in the industry. The report contains a comprehensive market and vendor landscape in addition to an analysis of the key vendors.
The publisher presents a detailed picture of the market by the way of study, synthesis, and summation of data from multiple sources by an analysis of key parameters such as profit, pricing, competition, and promotions. It presents various market facets by identifying the key industry influencers. The data presented is comprehensive, reliable, and a result of extensive research - both primary and secondary. The market research reports provide a complete competitive landscape and an in-depth vendor selection methodology and analysis using qualitative and quantitative research to forecast the accurate market growth.
Table of Contents
1 Executive Summary
- 1.1 Market overview
- Executive Summary - Chart on Market Overview
- Executive Summary - Data Table on Market Overview
- Executive Summary - Chart on Global Market Characteristics
- Executive Summary - Chart on Market By Geographical Landscape
- Executive Summary - Chart on Market Segmentation by Application
- Executive Summary - Chart on Market Segmentation by Type
- Executive Summary - Chart on Incremental Growth
- Executive Summary - Data Table on Incremental Growth
- Executive Summary - Chart on Company Market Positioning
2 Market Landscape
- 2.1 Market ecosystem
- Parent Market
- Data Table on - Parent Market
- 2.2 Market characteristics
- Market characteristics analysis
- 2.3 Value chain analysis
- Value Chain Analysis
3 Market Sizing
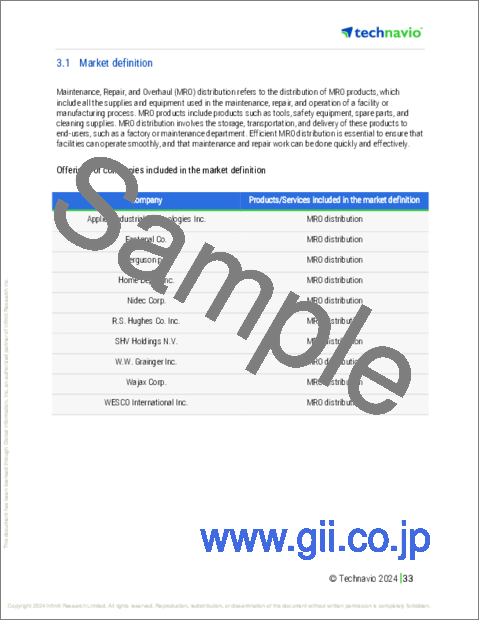
- 3.1 Market definition
- Offerings of companies included in the market definition
- 3.2 Market segment analysis
- Market segments
- 3.3 Market size 2023
- 3.4 Market outlook: Forecast for 2023-2028
- Chart on Global - Market size and forecast 2023-2028 ($ billion)
- Data Table on Global - Market size and forecast 2023-2028 ($ billion)
- Chart on Global Market: Year-over-year growth 2023-2028 (%)
- Data Table on Global Market: Year-over-year growth 2023-2028 (%)
4 Historic Market Size
- 4.1 Global Maintenance, Repair, And Overhaul (MRO) Distribution Market 2018 - 2022
- Historic Market Size - Data Table on Global Maintenance, Repair, And Overhaul (MRO) Distribution Market 2018 - 2022 ($ billion)
- 4.2 Application segment analysis 2018 - 2022
- Historic Market Size - Application Segment 2018 - 2022 ($ billion)
- 4.3 Type segment analysis 2018 - 2022
- Historic Market Size - Type Segment 2018 - 2022 ($ billion)
- 4.4 Geography segment analysis 2018 - 2022
- Historic Market Size - Geography Segment 2018 - 2022 ($ billion)
- 4.5 Country segment analysis 2018 - 2022
- Historic Market Size - Country Segment 2018 - 2022 ($ billion)
5 Five Forces Analysis
- 5.1 Five forces summary
- Five forces analysis - Comparison between 2023 and 2028
- 5.2 Bargaining power of buyers
- Bargaining power of buyers - Impact of key factors 2023 and 2028
- 5.3 Bargaining power of suppliers
- Bargaining power of suppliers - Impact of key factors in 2023 and 2028
- 5.4 Threat of new entrants
- Threat of new entrants - Impact of key factors in 2023 and 2028
- 5.5 Threat of substitutes
- Threat of substitutes - Impact of key factors in 2023 and 2028
- 5.6 Threat of rivalry
- Threat of rivalry - Impact of key factors in 2023 and 2028
- 5.7 Market condition
- Chart on Market condition - Five forces 2023 and 2028
6 Market Segmentation by Application
- 6.1 Market segments
- Chart on Application - Market share 2023-2028 (%)
- Data Table on Application - Market share 2023-2028 (%)
- 6.2 Comparison by Application
- Chart on Comparison by Application
- Data Table on Comparison by Application
- 6.3 Chemicals - Market size and forecast 2023-2028
- Chart on Chemicals - Market size and forecast 2023-2028 ($ billion)
- Data Table on Chemicals - Market size and forecast 2023-2028 ($ billion)
- Chart on Chemicals - Year-over-year growth 2023-2028 (%)
- Data Table on Chemicals - Year-over-year growth 2023-2028 (%)
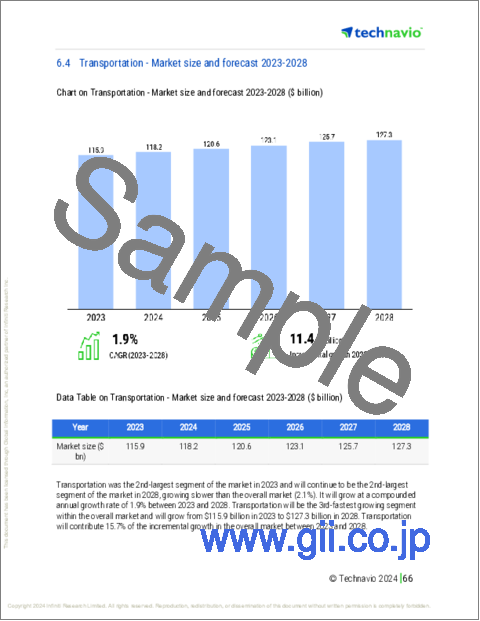
- 6.4 Transportation - Market size and forecast 2023-2028
- Chart on Transportation - Market size and forecast 2023-2028 ($ billion)
- Data Table on Transportation - Market size and forecast 2023-2028 ($ billion)
- Chart on Transportation - Year-over-year growth 2023-2028 (%)
- Data Table on Transportation - Year-over-year growth 2023-2028 (%)
- 6.5 Food beverage and tobacco - Market size and forecast 2023-2028
- Chart on Food beverage and tobacco - Market size and forecast 2023-2028 ($ billion)
- Data Table on Food beverage and tobacco - Market size and forecast 2023-2028 ($ billion)
- Chart on Food beverage and tobacco - Year-over-year growth 2023-2028 (%)
- Data Table on Food beverage and tobacco - Year-over-year growth 2023-2028 (%)
- 6.6 Electricals and electronics - Market size and forecast 2023-2028
- Chart on Electricals and electronics - Market size and forecast 2023-2028 ($ billion)
- Data Table on Electricals and electronics - Market size and forecast 2023-2028 ($ billion)
- Chart on Electricals and electronics - Year-over-year growth 2023-2028 (%)
- Data Table on Electricals and electronics - Year-over-year growth 2023-2028 (%)
- 6.7 Others - Market size and forecast 2023-2028
- Chart on Others - Market size and forecast 2023-2028 ($ billion)
- Data Table on Others - Market size and forecast 2023-2028 ($ billion)
- Chart on Others - Year-over-year growth 2023-2028 (%)
- Data Table on Others - Year-over-year growth 2023-2028 (%)
- 6.8 Market opportunity by Application
- Market opportunity by Application ($ billion)
- Data Table on Market opportunity by Application ($ billion)
7 Market Segmentation by Type
- 7.1 Market segments
- Chart on Type - Market share 2023-2028 (%)
- Data Table on Type - Market share 2023-2028 (%)
- 7.2 Comparison by Type
- Chart on Comparison by Type
- Data Table on Comparison by Type
- 7.3 Industrial - Market size and forecast 2023-2028
- Chart on Industrial - Market size and forecast 2023-2028 ($ billion)
- Data Table on Industrial - Market size and forecast 2023-2028 ($ billion)
- Chart on Industrial - Year-over-year growth 2023-2028 (%)
- Data Table on Industrial - Year-over-year growth 2023-2028 (%)
- 7.4 Electrical - Market size and forecast 2023-2028
- Chart on Electrical - Market size and forecast 2023-2028 ($ billion)
- Data Table on Electrical - Market size and forecast 2023-2028 ($ billion)
- Chart on Electrical - Year-over-year growth 2023-2028 (%)
- Data Table on Electrical - Year-over-year growth 2023-2028 (%)
- 7.5 Facility - Market size and forecast 2023-2028
- Chart on Facility - Market size and forecast 2023-2028 ($ billion)
- Data Table on Facility - Market size and forecast 2023-2028 ($ billion)
- Chart on Facility - Year-over-year growth 2023-2028 (%)
- Data Table on Facility - Year-over-year growth 2023-2028 (%)
- 7.6 Others - Market size and forecast 2023-2028
- Chart on Others - Market size and forecast 2023-2028 ($ billion)
- Data Table on Others - Market size and forecast 2023-2028 ($ billion)
- Chart on Others - Year-over-year growth 2023-2028 (%)
- Data Table on Others - Year-over-year growth 2023-2028 (%)
- 7.7 Market opportunity by Type
- Market opportunity by Type ($ billion)
- Data Table on Market opportunity by Type ($ billion)
8 Customer Landscape
- 8.1 Customer landscape overview
- Analysis of price sensitivity, lifecycle, customer purchase basket, adoption rates, and purchase criteria
9 Geographic Landscape
- 9.1 Geographic segmentation
- Chart on Market share By Geographical Landscape 2023-2028 (%)
- Data Table on Market share By Geographical Landscape 2023-2028 (%)
- 9.2 Geographic comparison
- Chart on Geographic comparison
- Data Table on Geographic comparison
- 9.3 North America - Market size and forecast 2023-2028
- Chart on North America - Market size and forecast 2023-2028 ($ billion)
- Data Table on North America - Market size and forecast 2023-2028 ($ billion)
- Chart on North America - Year-over-year growth 2023-2028 (%)
- Data Table on North America - Year-over-year growth 2023-2028 (%)
- 9.4 Europe - Market size and forecast 2023-2028
- Chart on Europe - Market size and forecast 2023-2028 ($ billion)
- Data Table on Europe - Market size and forecast 2023-2028 ($ billion)
- Chart on Europe - Year-over-year growth 2023-2028 (%)
- Data Table on Europe - Year-over-year growth 2023-2028 (%)
- 9.5 APAC - Market size and forecast 2023-2028
- Chart on APAC - Market size and forecast 2023-2028 ($ billion)
- Data Table on APAC - Market size and forecast 2023-2028 ($ billion)
- Chart on APAC - Year-over-year growth 2023-2028 (%)
- Data Table on APAC - Year-over-year growth 2023-2028 (%)
- 9.6 South America - Market size and forecast 2023-2028
- Chart on South America - Market size and forecast 2023-2028 ($ billion)
- Data Table on South America - Market size and forecast 2023-2028 ($ billion)
- Chart on South America - Year-over-year growth 2023-2028 (%)
- Data Table on South America - Year-over-year growth 2023-2028 (%)
- 9.7 Middle East and Africa - Market size and forecast 2023-2028
- Chart on Middle East and Africa - Market size and forecast 2023-2028 ($ billion)
- Data Table on Middle East and Africa - Market size and forecast 2023-2028 ($ billion)
- Chart on Middle East and Africa - Year-over-year growth 2023-2028 (%)
- Data Table on Middle East and Africa - Year-over-year growth 2023-2028 (%)
- 9.8 US - Market size and forecast 2023-2028
- Chart on US - Market size and forecast 2023-2028 ($ billion)
- Data Table on US - Market size and forecast 2023-2028 ($ billion)
- Chart on US - Year-over-year growth 2023-2028 (%)
- Data Table on US - Year-over-year growth 2023-2028 (%)
- 9.9 Germany - Market size and forecast 2023-2028
- Chart on Germany - Market size and forecast 2023-2028 ($ billion)
- Data Table on Germany - Market size and forecast 2023-2028 ($ billion)
- Chart on Germany - Year-over-year growth 2023-2028 (%)
- Data Table on Germany - Year-over-year growth 2023-2028 (%)
- 9.10 China - Market size and forecast 2023-2028
- Chart on China - Market size and forecast 2023-2028 ($ billion)
- Data Table on China - Market size and forecast 2023-2028 ($ billion)
- Chart on China - Year-over-year growth 2023-2028 (%)
- Data Table on China - Year-over-year growth 2023-2028 (%)
- 9.11 UK - Market size and forecast 2023-2028
- Chart on UK - Market size and forecast 2023-2028 ($ billion)
- Data Table on UK - Market size and forecast 2023-2028 ($ billion)
- Chart on UK - Year-over-year growth 2023-2028 (%)
- Data Table on UK - Year-over-year growth 2023-2028 (%)
- 9.12 Japan - Market size and forecast 2023-2028
- Chart on Japan - Market size and forecast 2023-2028 ($ billion)
- Data Table on Japan - Market size and forecast 2023-2028 ($ billion)
- Chart on Japan - Year-over-year growth 2023-2028 (%)
- Data Table on Japan - Year-over-year growth 2023-2028 (%)
- 9.13 Market opportunity By Geographical Landscape
- Market opportunity By Geographical Landscape ($ billion)
- Data Tables on Market opportunity By Geographical Landscape ($ billion)
10 Drivers, Challenges, and Opportunity/Restraints
- 10.1 Market drivers
- 10.2 Market challenges
- 10.3 Impact of drivers and challenges
- Impact of drivers and challenges in 2023 and 2028
- 10.4 Market opportunities/restraints
11 Competitive Landscape
- 11.1 Overview
- 11.2 Competitive Landscape
- Overview on criticality of inputs and factors of differentiation
- 11.3 Landscape disruption
- Overview on factors of disruption
- 11.4 Industry risks
- Impact of key risks on business
12 Competitive Analysis
- 12.1 Companies profiled
- Companies covered
- 12.2 Market positioning of companies
- Matrix on companies position and classification
- 12.3 Air Liquide SA
- Air Liquide SA - Overview
- Air Liquide SA - Business segments
- Air Liquide SA - Key news
- Air Liquide SA - Key offerings
- Air Liquide SA - Segment focus
- 12.4 Applied Industrial Technologies Inc.
- Applied Industrial Technologies Inc. - Overview
- Applied Industrial Technologies Inc. - Business segments
- Applied Industrial Technologies Inc. - Key news
- Applied Industrial Technologies Inc. - Key offerings
- Applied Industrial Technologies Inc. - Segment focus
- 12.5 Fastenal Co.
- Fastenal Co. - Overview
- Fastenal Co. - Product / Service
- Fastenal Co. - Key offerings
- 12.6 Ferguson plc
- Ferguson plc - Overview
- Ferguson plc - Business segments
- Ferguson plc - Key news
- Ferguson plc - Key offerings
- Ferguson plc - Segment focus
- 12.7 Forge Industries Co.
- Forge Industries Co. - Overview
- Forge Industries Co. - Product / Service
- Forge Industries Co. - Key offerings
- 12.8 Genuine Parts Co.
- Genuine Parts Co. - Overview
- Genuine Parts Co. - Business segments
- Genuine Parts Co. - Key offerings
- Genuine Parts Co. - Segment focus
- 12.9 Home Depot Inc.
- Home Depot Inc. - Overview
- Home Depot Inc. - Business segments
- Home Depot Inc. - Key news
- Home Depot Inc. - Key offerings
- Home Depot Inc. - Segment focus
- 12.10 Honeywell International Inc.
- Honeywell International Inc. - Overview
- Honeywell International Inc. - Business segments
- Honeywell International Inc. - Key news
- Honeywell International Inc. - Key offerings
- Honeywell International Inc. - Segment focus
- 12.11 Nidec Corp.
- Nidec Corp. - Overview
- Nidec Corp. - Business segments
- Nidec Corp. - Key news
- Nidec Corp. - Key offerings
- Nidec Corp. - Segment focus
- 12.12 NOW Inc.
- NOW Inc. - Overview
- NOW Inc. - Business segments
- NOW Inc. - Key offerings
- NOW Inc. - Segment focus
- 12.13 R.S. Hughes Co. Inc.
- R.S. Hughes Co. Inc. - Overview
- R.S. Hughes Co. Inc. - Product / Service
- R.S. Hughes Co. Inc. - Key offerings
- 12.14 SHV Holdings N.V.
- SHV Holdings N.V. - Overview
- SHV Holdings N.V. - Product / Service
- SHV Holdings N.V. - Key offerings
- 12.15 W.W. Grainger Inc.
- W.W. Grainger Inc. - Overview
- W.W. Grainger Inc. - Business segments
- W.W. Grainger Inc. - Key offerings
- W.W. Grainger Inc. - Segment focus
- 12.16 Wajax Corp.
- Wajax Corp. - Overview
- Wajax Corp. - Product / Service
- Wajax Corp. - Key offerings
- 12.17 WESCO International Inc.
- WESCO International Inc. - Overview
- WESCO International Inc. - Business segments
- WESCO International Inc. - Key offerings
- WESCO International Inc. - Segment focus
13 Appendix
- 13.1 Scope of the report
- 13.2 Inclusions and exclusions checklist
- Inclusions checklist
- Exclusions checklist
- 13.3 Currency conversion rates for US$
- Currency conversion rates for US$
- 13.4 Research methodology
- Research methodology
- 13.5 Data procurement
- Information sources
- 13.6 Data validation
- Data validation
- 13.7 Validation techniques employed for market sizing
- Validation techniques employed for market sizing
- 13.8 Data synthesis
- Data synthesis
- 360 degree market analysis
- 360 degree market analysis
- 13.10 List of abbreviations
- List of abbreviations

