|
|
市場調査レポート
商品コード
1491455
セラミックマトリックス複合材料(CMC)の世界市場 2024-2028Global Ceramic Matrix Composites (CMC) Market 2024-2028 |
||||||
|
|
|||||||
|
● お客様のご希望に応じて、既存データの加工や未掲載情報(例:国別セグメント)の追加などの対応が可能です。 詳細はお問い合わせください。 |
|||||||


| セラミックマトリックス複合材料(CMC)の世界市場 2024-2028 |
|
出版日: 2024年05月17日
発行: TechNavio
ページ情報: 英文 174 Pages
納期: 即納可能
|
- 全表示
- 概要
- 図表
- 目次
セラミックマトリックス複合材料(CMC)市場は2023-2028年に32億3,165万米ドル、予測期間中のCAGRは10.93%で成長すると予測されています。
当レポートでは、セラミックマトリックス複合材料(CMC)市場の全体的な分析、市場規模・予測、動向、成長促進要因、課題、約25のベンダーを網羅したベンダー分析などを掲載しています。
現在の市場シナリオ、最新動向と促進要因、市場環境全体に関する最新分析を提供しています。市場は、航空宇宙産業における技術革新と政府資金の増加、CMCの製造プロセスにおける技術進歩、エネルギー効率の高いシステムに対する需要の高まりによって牽引されています。
| 市場範囲 | |
|---|---|
| 基準年 | 2024 |
| 終了年 | 2028 |
| 予測期間 | 2024-2028 |
| 成長モメンタム | 加速 |
| 前年比2024年 | 10.34% |
| CAGR | 10.93% |
| 増分額 | 32億3,165万米ドル |
本調査では、今後数年間のセラミックマトリックス複合材料(CMC)市場成長を牽引する主要因の1つとして、CMC新製品発売の増加を挙げています。また、化学気相浸透法(CVI)の採用拡大や繊維強化セラミック複合材料(FRCCs)の出現は、市場の大きな需要につながります。
目次
第1章 エグゼクティブサマリー
- 市場概要
第2章 市場情勢
- 市場エコシステム
第3章 市場規模の評価
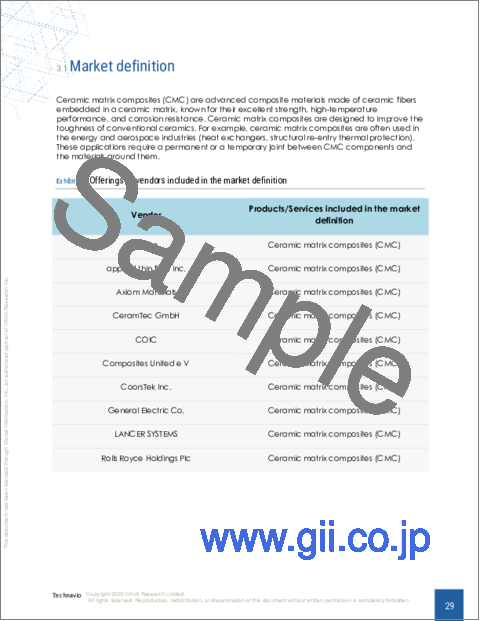
- 市場の定義
- 市場セグメント分析
- 市場規模 2023
- 市場の見通し 2023-2028
第4章 市場規模実績
- セラミックマトリックス複合材料(CMC)の世界市場 2018-2022
- 用途別セグメント分析 2018-2022
- 製品セグメント分析 2018-2022
- 地域別セグメント分析 2018-2022
- 国別セグメント分析 2018-2022
第5章 ファイブフォース分析
- ファイブフォースの要約
- 買い手の交渉力
- 供給企業の交渉力
- 新規参入業者の脅威
- 代替品の脅威
- 競争の脅威
- 市況
第6章 市場セグメンテーション:用途別
- 市場セグメンテーション
- 比較:用途別
- 航空宇宙と防衛:市場規模と予測 2023-2028
- 自動車:市場規模と予測 2023-2028
- パワーとエネルギー:市場規模と予測 2023-2028
- その他:市場規模と予測 2023-2028
- 市場機会:用途別
第7章 市場セグメンテーション:製品別
- 市場セグメンテーション
- 比較:製品別
- 酸化物:市場規模と予測 2023-2028
- シリコンカーバイド:市場規模と予測 2023-2028
- 炭素:市場規模と予測 2023-2028
- 市場機会:製品別
第8章 顧客情勢
- 顧客情勢の概要
第9章 地域別情勢
- 地域別セグメンテーション
- 地域別比較
- 北米:市場規模と予測 2023-2028
- 欧州:市場規模と予測 2023-2028
- アジア太平洋:市場規模と予測 2023-2028
- 中東・アフリカ:市場規模と予測 2023-2028
- 南米:市場規模と予測 2023-2028
- 米国:市場規模と予測 2023-2028
- ドイツ:市場規模と予測 2023-2028
- 中国:市場規模と予測 2023-2028
- 英国:市場規模と予測 2023-2028
- カナダ:市場規模と予測 2023-2028
- 市場機会:地域情勢別
第10章 促進要因、課題、および動向
- 市場促進要因
- 市場の課題
- 促進要因と課題の影響
- 市場動向
第11章 ベンダー情勢
- 概要
- ベンダー情勢
- 混乱の状況
- 業界のリスク
第12章 ベンダー分析
- 対象ベンダー
- ベンダーの市場ポジショニング
- 3M Co.
- applied thin films inc.
- Axiom Materials
- CeramTec GmbH
- COIC
- Composites United e V
- CoorsTek Inc.
- General Electric Co.
- LANCER SYSTEMS
- Rolls Royce Holdings Plc
- SGL Carbon SE
- Spirit AeroSystems Inc.
- Starfire Systems Inc.
- Ultramet
- YuCMC Co. Ltd.
第13章 付録
Exhibits:
- Exhibits1: Executive Summary - Chart on Market Overview
- Exhibits2: Executive Summary - Data Table on Market Overview
- Exhibits3: Executive Summary - Chart on Global Market Characteristics
- Exhibits4: Executive Summary - Chart on Market By Geographical Landscape
- Exhibits5: Executive Summary - Chart on Market Segmentation by Application
- Exhibits6: Executive Summary - Chart on Market Segmentation by Product
- Exhibits7: Executive Summary - Chart on Incremental Growth
- Exhibits8: Executive Summary - Data Table on Incremental Growth
- Exhibits9: Executive Summary - Chart on Vendor Market Positioning
- Exhibits10: Parent market
- Exhibits11: Market Characteristics
- Exhibits12: Offerings of vendors included in the market definition
- Exhibits13: Market segments
- Exhibits14: Chart on Global - Market size and forecast 2023-2028 ($ million)
- Exhibits15: Data Table on Global - Market size and forecast 2023-2028 ($ million)
- Exhibits16: Chart on Global Market: Year-over-year growth 2023-2028 (%)
- Exhibits17: Data Table on Global Market: Year-over-year growth 2023-2028 (%)
- Exhibits18: Historic Market Size - Data Table on global ceramic matrix composites (cmc) market 2018 - 2022 ($ million)
- Exhibits19: Historic Market Size - Application Segment 2018 - 2022 ($ million)
- Exhibits20: Historic Market Size - Product Segment 2018 - 2022 ($ million)
- Exhibits21: Historic Market Size - Geography Segment 2018 - 2022 ($ million)
- Exhibits22: Historic Market Size - Country Segment 2018 - 2022 ($ million)
- Exhibits23: Five forces analysis - Comparison between 2023 and 2028
- Exhibits24: Chart on Bargaining power of buyers - Impact of key factors 2023 and 2028
- Exhibits25: Bargaining power of suppliers - Impact of key factors in 2023 and 2028
- Exhibits26: Threat of new entrants - Impact of key factors in 2023 and 2028
- Exhibits27: Threat of substitutes - Impact of key factors in 2023 and 2028
- Exhibits28: Threat of rivalry - Impact of key factors in 2023 and 2028
- Exhibits29: Chart on Market condition - Five forces 2023 and 2028
- Exhibits30: Chart on Application - Market share 2023-2028 (%)
- Exhibits31: Data Table on Application - Market share 2023-2028 (%)
- Exhibits32: Chart on Comparison by Application
- Exhibits33: Data Table on Comparison by Application
- Exhibits34: Chart on Aerospace and defense - Market size and forecast 2023-2028 ($ million)
- Exhibits35: Data Table on Aerospace and defense - Market size and forecast 2023-2028 ($ million)
- Exhibits36: Chart on Aerospace and defense - Year-over-year growth 2023-2028 (%)
- Exhibits37: Data Table on Aerospace and defense - Year-over-year growth 2023-2028 (%)
- Exhibits38: Chart on Automotive - Market size and forecast 2023-2028 ($ million)
- Exhibits39: Data Table on Automotive - Market size and forecast 2023-2028 ($ million)
- Exhibits40: Chart on Automotive - Year-over-year growth 2023-2028 (%)
- Exhibits41: Data Table on Automotive - Year-over-year growth 2023-2028 (%)
- Exhibits42: Chart on Power and energy - Market size and forecast 2023-2028 ($ million)
- Exhibits43: Data Table on Power and energy - Market size and forecast 2023-2028 ($ million)
- Exhibits44: Chart on Power and energy - Year-over-year growth 2023-2028 (%)
- Exhibits45: Data Table on Power and energy - Year-over-year growth 2023-2028 (%)
- Exhibits46: Chart on Others - Market size and forecast 2023-2028 ($ million)
- Exhibits47: Data Table on Others - Market size and forecast 2023-2028 ($ million)
- Exhibits48: Chart on Others - Year-over-year growth 2023-2028 (%)
- Exhibits49: Data Table on Others - Year-over-year growth 2023-2028 (%)
- Exhibits50: Market opportunity by Application ($ million)
- Exhibits51: Data Table on Market opportunity by Application ($ million)
- Exhibits52: Chart on Product - Market share 2023-2028 (%)
- Exhibits53: Data Table on Product - Market share 2023-2028 (%)
- Exhibits54: Chart on Comparison by Product
- Exhibits55: Data Table on Comparison by Product
- Exhibits56: Chart on Oxide - Market size and forecast 2023-2028 ($ million)
- Exhibits57: Data Table on Oxide - Market size and forecast 2023-2028 ($ million)
- Exhibits58: Chart on Oxide - Year-over-year growth 2023-2028 (%)
- Exhibits59: Data Table on Oxide - Year-over-year growth 2023-2028 (%)
- Exhibits60: Chart on Silicon carbide - Market size and forecast 2023-2028 ($ million)
- Exhibits61: Data Table on Silicon carbide - Market size and forecast 2023-2028 ($ million)
- Exhibits62: Chart on Silicon carbide - Year-over-year growth 2023-2028 (%)
- Exhibits63: Data Table on Silicon carbide - Year-over-year growth 2023-2028 (%)
- Exhibits64: Chart on Carbon - Market size and forecast 2023-2028 ($ million)
- Exhibits65: Data Table on Carbon - Market size and forecast 2023-2028 ($ million)
- Exhibits66: Chart on Carbon - Year-over-year growth 2023-2028 (%)
- Exhibits67: Data Table on Carbon - Year-over-year growth 2023-2028 (%)
- Exhibits68: Market opportunity by Product ($ million)
- Exhibits69: Data Table on Market opportunity by Product ($ million)
- Exhibits70: Analysis of price sensitivity, lifecycle, customer purchase basket, adoption rates, and purchase criteria
- Exhibits71: Chart on Market share By Geographical Landscape 2023-2028 (%)
- Exhibits72: Data Table on Market share By Geographical Landscape 2023-2028 (%)
- Exhibits73: Chart on Geographic comparison
- Exhibits74: Data Table on Geographic comparison
- Exhibits75: Chart on North America - Market size and forecast 2023-2028 ($ million)
- Exhibits76: Data Table on North America - Market size and forecast 2023-2028 ($ million)
- Exhibits77: Chart on North America - Year-over-year growth 2023-2028 (%)
- Exhibits78: Data Table on North America - Year-over-year growth 2023-2028 (%)
- Exhibits79: Chart on Europe - Market size and forecast 2023-2028 ($ million)
- Exhibits80: Data Table on Europe - Market size and forecast 2023-2028 ($ million)
- Exhibits81: Chart on Europe - Year-over-year growth 2023-2028 (%)
- Exhibits82: Data Table on Europe - Year-over-year growth 2023-2028 (%)
- Exhibits83: Chart on APAC - Market size and forecast 2023-2028 ($ million)
- Exhibits84: Data Table on APAC - Market size and forecast 2023-2028 ($ million)
- Exhibits85: Chart on APAC - Year-over-year growth 2023-2028 (%)
- Exhibits86: Data Table on APAC - Year-over-year growth 2023-2028 (%)
- Exhibits87: Chart on Middle East and Africa - Market size and forecast 2023-2028 ($ million)
- Exhibits88: Data Table on Middle East and Africa - Market size and forecast 2023-2028 ($ million)
- Exhibits89: Chart on Middle East and Africa - Year-over-year growth 2023-2028 (%)
- Exhibits90: Data Table on Middle East and Africa - Year-over-year growth 2023-2028 (%)
- Exhibits91: Chart on South America - Market size and forecast 2023-2028 ($ million)
- Exhibits92: Data Table on South America - Market size and forecast 2023-2028 ($ million)
- Exhibits93: Chart on South America - Year-over-year growth 2023-2028 (%)
- Exhibits94: Data Table on South America - Year-over-year growth 2023-2028 (%)
- Exhibits95: Chart on US - Market size and forecast 2023-2028 ($ million)
- Exhibits96: Data Table on US - Market size and forecast 2023-2028 ($ million)
- Exhibits97: Chart on US - Year-over-year growth 2023-2028 (%)
- Exhibits98: Data Table on US - Year-over-year growth 2023-2028 (%)
- Exhibits99: Chart on Germany - Market size and forecast 2023-2028 ($ million)
- Exhibits100: Data Table on Germany - Market size and forecast 2023-2028 ($ million)
- Exhibits101: Chart on Germany - Year-over-year growth 2023-2028 (%)
- Exhibits102: Data Table on Germany - Year-over-year growth 2023-2028 (%)
- Exhibits103: Chart on China - Market size and forecast 2023-2028 ($ million)
- Exhibits104: Data Table on China - Market size and forecast 2023-2028 ($ million)
- Exhibits105: Chart on China - Year-over-year growth 2023-2028 (%)
- Exhibits106: Data Table on China - Year-over-year growth 2023-2028 (%)
- Exhibits107: Chart on UK - Market size and forecast 2023-2028 ($ million)
- Exhibits108: Data Table on UK - Market size and forecast 2023-2028 ($ million)
- Exhibits109: Chart on UK - Year-over-year growth 2023-2028 (%)
- Exhibits110: Data Table on UK - Year-over-year growth 2023-2028 (%)
- Exhibits111: Chart on Canada - Market size and forecast 2023-2028 ($ million)
- Exhibits112: Data Table on Canada - Market size and forecast 2023-2028 ($ million)
- Exhibits113: Chart on Canada - Year-over-year growth 2023-2028 (%)
- Exhibits114: Data Table on Canada - Year-over-year growth 2023-2028 (%)
- Exhibits115: Market opportunity By Geographical Landscape ($ million)
- Exhibits116: Data Tables on Market opportunity By Geographical Landscape ($ million)
- Exhibits117: Impact of drivers and challenges in 2023 and 2028
- Exhibits118: Overview on Criticality of inputs and Factors of differentiation
- Exhibits119: Overview on factors of disruption
- Exhibits120: Impact of key risks on business
- Exhibits121: Vendors covered
- Exhibits122: Matrix on vendor position and classification
- Exhibits123: 3M Co. - Overview
- Exhibits124: 3M Co. - Business segments
- Exhibits125: 3M Co. - Key news
- Exhibits126: 3M Co. - Key offerings
- Exhibits127: 3M Co. - Segment focus
- Exhibits128: applied thin films inc. - Overview
- Exhibits129: applied thin films inc. - Product / Service
- Exhibits130: applied thin films inc. - Key offerings
- Exhibits131: Axiom Materials - Overview
- Exhibits132: Axiom Materials - Product / Service
- Exhibits133: Axiom Materials - Key offerings
- Exhibits134: CeramTec GmbH - Overview
- Exhibits135: CeramTec GmbH - Product / Service
- Exhibits136: CeramTec GmbH - Key offerings
- Exhibits137: COIC - Overview
- Exhibits138: COIC - Product / Service
- Exhibits139: COIC - Key offerings
- Exhibits140: Composites United e V - Overview
- Exhibits141: Composites United e V - Product / Service
- Exhibits142: Composites United e V - Key offerings
- Exhibits143: CoorsTek Inc. - Overview
- Exhibits144: CoorsTek Inc. - Product / Service
- Exhibits145: CoorsTek Inc. - Key offerings
- Exhibits146: General Electric Co. - Overview
- Exhibits147: General Electric Co. - Business segments
- Exhibits148: General Electric Co. - Key news
- Exhibits149: General Electric Co. - Key offerings
- Exhibits150: General Electric Co. - Segment focus
- Exhibits151: LANCER SYSTEMS - Overview
- Exhibits152: LANCER SYSTEMS - Product / Service
- Exhibits153: LANCER SYSTEMS - Key offerings
- Exhibits154: Rolls Royce Holdings Plc - Overview
- Exhibits155: Rolls Royce Holdings Plc - Business segments
- Exhibits156: Rolls Royce Holdings Plc - Key news
- Exhibits157: Rolls Royce Holdings Plc - Key offerings
- Exhibits158: Rolls Royce Holdings Plc - Segment focus
- Exhibits159: SGL Carbon SE - Overview
- Exhibits160: SGL Carbon SE - Business segments
- Exhibits161: SGL Carbon SE - Key offerings
- Exhibits162: SGL Carbon SE - Segment focus
- Exhibits163: Spirit AeroSystems Inc. - Overview
- Exhibits164: Spirit AeroSystems Inc. - Business segments
- Exhibits165: Spirit AeroSystems Inc. - Key offerings
- Exhibits166: Spirit AeroSystems Inc. - Segment focus
- Exhibits167: Starfire Systems Inc. - Overview
- Exhibits168: Starfire Systems Inc. - Product / Service
- Exhibits169: Starfire Systems Inc. - Key offerings
- Exhibits170: Ultramet - Overview
- Exhibits171: Ultramet - Product / Service
- Exhibits172: Ultramet - Key offerings
- Exhibits173: YuCMC Co. Ltd. - Overview
- Exhibits174: YuCMC Co. Ltd. - Product / Service
- Exhibits175: YuCMC Co. Ltd. - Key offerings
- Exhibits176: Inclusions checklist
- Exhibits177: Exclusions checklist
- Exhibits178: Currency conversion rates for US$
- Exhibits179: Research methodology
- Exhibits180: Validation techniques employed for market sizing
- Exhibits181: Information sources
- Exhibits182: List of abbreviations
The ceramic matrix composites (CMC) market is forecasted to grow by USD 3231.65 mn during 2023-2028, accelerating at a CAGR of 10.93% during the forecast period. The report on the ceramic matrix composites (CMC) market provides a holistic analysis, market size and forecast, trends, growth drivers, and challenges, as well as vendor analysis covering around 25 vendors.
The report offers an up-to-date analysis regarding the current market scenario, the latest trends and drivers, and the overall market environment. The market is driven by rising innovations and government funding in the aerospace industry, technological advancements in the manufacturing processes of CMCs, and growing demand for energy-efficient systems.
Technavio's ceramic matrix composites (CMC) market is segmented as below:
| Market Scope | |
|---|---|
| Base Year | 2024 |
| End Year | 2028 |
| Series Year | 2024-2028 |
| Growth Momentum | Accelerate |
| YOY 2024 | 10.34% |
| CAGR | 10.93% |
| Incremental Value | $3231.65mn |
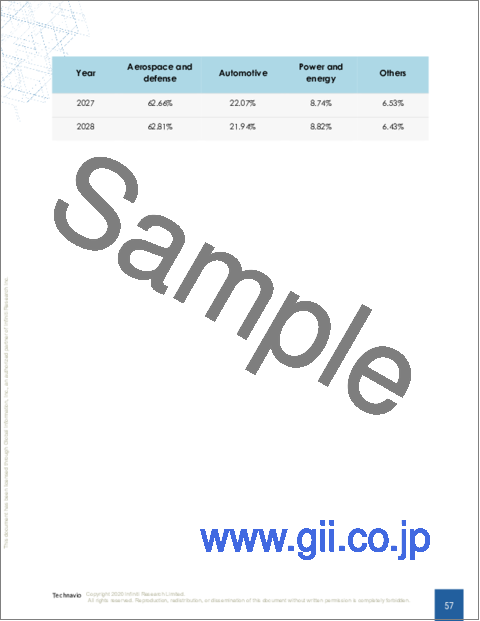
By Application
- Aerospace and defense
- Automotive
- Power and energy
- Others
By Product
- Oxide
- Silicon carbide
- Carbon
By Geographical Landscape
- North America
- Europe
- APAC
- Middle East and Africa
- South America
This study identifies the rise in new CMC product launches as one of the prime reasons driving the ceramic matrix composites (CMC) market growth during the next few years. Also, the growing adoption of chemical vapor infiltration (CVI) and the emergence of fiber-reinforced ceramic composites (FRCCs) will lead to sizable demand in the market.
The report on the ceramic matrix composites (CMC) market covers the following areas:
- Ceramic matrix composites (CMC) market sizing
- Ceramic matrix composites (CMC) market forecast
- Ceramic matrix composites (CMC) market industry analysis
The robust vendor analysis is designed to help clients improve their market position, and in line with this, this report provides a detailed analysis of several leading ceramic matrix composites (CMC) market vendors including applied thin films inc., Axiom Materials, CeramTec GmbH, CFC Carbon Co. Ltd., COIC, Compagnie de Saint Gobain, Composites United e V, CoorsTek Inc., General Electric Co., Kyocera Corp., LANCER SYSTEMS, Mitsubishi Chemical Group Corp., Rolls Royce Holdings Plc, Safran SA, SGL Carbon SE, Spirit AeroSystems Inc., Starfire Systems Inc., Ube Corp., Ultramet, YuCMC Co. Ltd., 3M Co., National Composites Centre, and TISICS. Also, the ceramic matrix composites (CMC) market analysis report includes information on upcoming trends and challenges that will influence market growth. This is to help companies strategize and leverage all forthcoming growth opportunities.
The study was conducted using an objective combination of primary and secondary information including inputs from key participants in the industry. The report contains a comprehensive market and vendor landscape in addition to an analysis of the key vendors.
The publisher presents a detailed picture of the market by way of study, synthesis, and summation of data from multiple sources through an analysis of key parameters such as profit, pricing, competition, and promotions. It presents various market facets by identifying the key industry influencers. The data presented is comprehensive, reliable, and a result of extensive research - both primary and secondary. The market research reports provide a complete competitive landscape and an in-depth vendor selection methodology and analysis using qualitative and quantitative research to forecast accurate market growth.
Table of Contents
1 Executive Summary
- 1.1 Market overview
2 Market Landscape
- 2.1 Market ecosystem
3 Market Sizing
- 3.1 Market definition
- 3.2 Market segment analysis
- 3.3 Market size 2023
- 3.4 Market outlook: Forecast for 2023-2028
4 Historic Market Size
- 4.1 Global ceramic matrix composites (CMC) market 2018 - 2022
- 4.2 Application Segment Analysis 2018 - 2022
- 4.3 Product Segment Analysis 2018 - 2022
- 4.4 Geography Segment Analysis 2018 - 2022
- 4.5 Country Segment Analysis 2018 - 2022
5 Five Forces Analysis
- 5.1 Five forces summary
- 5.2 Bargaining power of buyers
- 5.3 Bargaining power of suppliers
- 5.4 Threat of new entrants
- 5.5 Threat of substitutes
- 5.6 Threat of rivalry
- 5.7 Market condition
6 Market Segmentation by Application
- 6.1 Market segments
- 6.2 Comparison by Application
- 6.3 Aerospace and defense - Market size and forecast 2023-2028
- 6.4 Automotive - Market size and forecast 2023-2028
- 6.5 Power and energy - Market size and forecast 2023-2028
- 6.6 Others - Market size and forecast 2023-2028
- 6.7 Market opportunity by Application
7 Market Segmentation by Product
- 7.1 Market segments
- 7.2 Comparison by Product
- 7.3 Oxide - Market size and forecast 2023-2028
- 7.4 Silicon carbide - Market size and forecast 2023-2028
- 7.5 Carbon - Market size and forecast 2023-2028
- 7.6 Market opportunity by Product
8 Customer Landscape
- 8.1 Customer landscape overview
9 Geographic Landscape
- 9.1 Geographic segmentation
- 9.2 Geographic comparison
- 9.3 North America - Market size and forecast 2023-2028
- 9.4 Europe - Market size and forecast 2023-2028
- 9.5 APAC - Market size and forecast 2023-2028
- 9.6 Middle East and Africa - Market size and forecast 2023-2028
- 9.7 South America - Market size and forecast 2023-2028
- 9.8 US - Market size and forecast 2023-2028
- 9.9 Germany - Market size and forecast 2023-2028
- 9.10 China - Market size and forecast 2023-2028
- 9.11 UK - Market size and forecast 2023-2028
- 9.12 Canada - Market size and forecast 2023-2028
- 9.13 Market opportunity By Geographical Landscape
10 Drivers, Challenges, and Trends
- 10.1 Market drivers
- 10.2 Market challenges
- 10.3 Impact of drivers and challenges
- 10.4 Market trends
11 Vendor Landscape
- 11.1 Overview
- 11.2 Vendor landscape
- 11.3 Landscape disruption
- 11.4 Industry risks
12 Vendor Analysis
- 12.1 Vendors covered
- 12.2 Market positioning of vendors
- 12.3 3M Co.
- 12.4 applied thin films inc.
- 12.5 Axiom Materials
- 12.6 CeramTec GmbH
- 12.7 COIC
- 12.8 Composites United e V
- 12.9 CoorsTek Inc.
- 12.10 General Electric Co.
- 12.11 LANCER SYSTEMS
- 12.12 Rolls Royce Holdings Plc
- 12.13 SGL Carbon SE
- 12.14 Spirit AeroSystems Inc.
- 12.15 Starfire Systems Inc.
- 12.16 Ultramet
- 12.17 YuCMC Co. Ltd.
13 Appendix
- 13.1 Scope of the report
- 13.2 Inclusions and exclusions checklist
- 13.3 Currency conversion rates for US$
- 13.4 Research methodology
- 13.5 List of abbreviations