|
|
市場調査レポート
商品コード
1502411
機械式人工呼吸器の世界市場 2024-2028Global mechanical ventilators market 2024-2028 |
||||||

|
|||||||
カスタマイズ可能
|
|||||||


| 機械式人工呼吸器の世界市場 2024-2028 |
|
出版日: 2024年05月20日
発行: TechNavio
ページ情報: 英文 192 Pages
納期: 即納可能
|

全表示
- 概要
- 図表
- 目次
Technavio社は機械式人工呼吸器市場を調査し、2023年から2028年にかけて20億530万米ドル、予測期間中のCAGRは6.78%で成長すると予測しています。
当レポートでは、機械式人工呼吸器市場の全体的な分析、市場規模・予測、動向、成長促進要因、課題、約25のベンダーを網羅したベンダー分析などを掲載しています。
現在の市場シナリオ、最新動向と促進要因、市場環境全体に関する最新分析を提供しています。市場は、呼吸器疾患の有病率の増加、世界の高齢者人口の増加、人工呼吸補助を必要とする外科手術量の増加によって牽引されています。
| 市場範囲 | |
|---|---|
| 基準年 | 2024 |
| 終了年 | 2028 |
| 予測期間 | 2024-2028 |
| 成長モメンタム | 加速 |
| 前年比2024年 | 6.23% |
| CAGR | 6.78% |
| 増分額 | 20億530万米ドル |
本調査では、機械式人工呼吸器の技術的進歩が、今後数年間の機械式人工呼吸器市場成長を牽引する主要因の1つであるとしています。また、在宅介護へのシフト、遠隔モニタリングと遠隔医療の統合が市場の大きな需要につながります。
目次
第1章 エグゼクティブサマリー
- 市場概要
第2章 市場情勢
- 市場エコシステム
- 市場の特徴
- バリューチェーン分析
第3章 市場規模の評価
- 市場の定義
- 市場セグメント分析
- 市場規模 2023
- 市場の見通し 2023-2028
第4章 市場規模実績
- 世界機械式人工呼吸器市場 2018-2022
- エンドユーザー別セグメント分析 2018-2022
- 製品別セグメント分析 2018-2022
- 技術別セグメント分析 2018-2022
- 地域別セグメント分析 2018-2022
- 国別セグメント分析 2018-2022
第5章 ファイブフォース分析
- ファイブフォースの要約
- 買い手の交渉力
- 供給企業の交渉力
- 新規参入業者の脅威
- 代替品の脅威
- 競争の脅威
- 市況
第6章 市場セグメンテーション:エンドユーザー別
- 市場セグメンテーション
- 比較:エンドユーザー別
- 病院:市場規模と予測 2023-2028
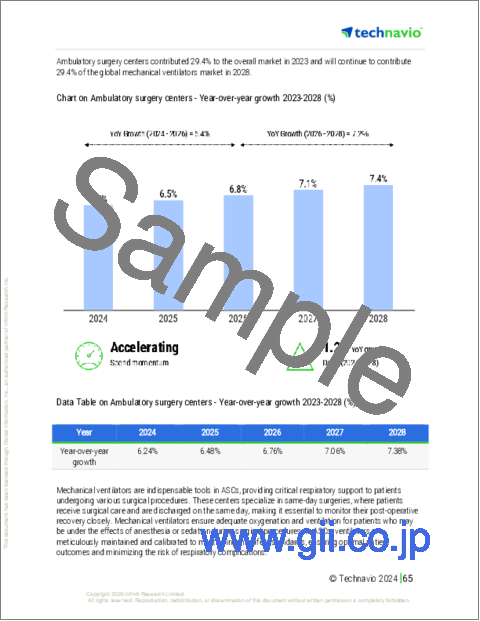
- 外来手術センター:市場規模と予測 2023-2028
- 在宅ケア環境:市場規模と予測 2023-2028
- 市場機会:エンドユーザー別
第7章 市場セグメンテーション:製品別
- 市場セグメンテーション
- 比較:製品別
- 集中治療用人工呼吸器:市場規模と予測 2023-2028
- ポータブル人工呼吸器:市場規模と予測 2023-2028
- 新生児用人工呼吸器:市場規模と予測 2023-2028
- 市場機会:製品別
第8章 市場セグメンテーション:技術別
- 市場セグメンテーション
- 比較:技術別
- 非侵襲的:市場規模と予測 2023-2028
- 侵襲的:市場規模と予測 2023-2028
- 市場機会:技術別
第9章 顧客情勢
- 顧客情勢の概要
第10章 地域別情勢
- 地域別セグメンテーション
- 地域別比較
- 北米:市場規模と予測 2023-2028
- 欧州:市場規模と予測 2023-2028
- アジア:市場規模と予測 2023-2028
- 世界のその他の地域:市場規模と予測 2023-2028
- 米国:市場規模と予測 2023-2028
- 英国:市場規模と予測 2023-2028
- ドイツ:市場規模と予測 2023-2028
- 中国:市場規模と予測 2023-2028
- 日本:市場規模と予測 2023-2028
- 市場機会:地域別
第11章 促進要因・課題・機会・抑制要因
- 市場促進要因
- 市場の課題
- 促進要因と課題の影響
- 市場の機会・抑制要因
第12章 競合情勢
- 概要
- 競合情勢
- 混乱の状況
- 業界のリスク
第13章 競合分析
- 企業プロファイル
- 企業の市場ポジショニング
- Air Liquide SA
- Asahi Kasei Corp.
- Boston Scientific Corp.
- Dragerwerk AG and Co. KGaA
- Fisher and Paykel Healthcare Corp. Ltd.
- General Electric Co.
- Getinge AB
- Hamilton Co.
- ICU Medical Inc.
- Koninklijke Philips N.V.
- Medtronic Plc
- Nihon Kohden Corp.
- ResMed Inc.
- Shenzhen Mindray BioMedical Electronics Co. Ltd
- Vyaire Medical Inc.
第14章 付録
Exhibits:
- Exhibits1: Executive Summary - Chart on Market Overview
- Exhibits2: Executive Summary - Data Table on Market Overview
- Exhibits3: Executive Summary - Chart on Global Market Characteristics
- Exhibits4: Executive Summary - Chart on Market by Geography
- Exhibits5: Executive Summary - Chart on Market Segmentation by End-user
- Exhibits6: Executive Summary - Chart on Market Segmentation by Product
- Exhibits7: Executive Summary - Chart on Market Segmentation by Technology
- Exhibits8: Executive Summary - Chart on Incremental Growth
- Exhibits9: Executive Summary - Data Table on Incremental Growth
- Exhibits10: Executive Summary - Chart on Company Market Positioning
- Exhibits11: Parent Market
- Exhibits12: Data Table on - Parent Market
- Exhibits13: Market characteristics analysis
- Exhibits14: Value Chain Analysis
- Exhibits15: Offerings of companies included in the market definition
- Exhibits16: Market segments
- Exhibits17: Chart on Global - Market size and forecast 2023-2028 ($ million)
- Exhibits18: Data Table on Global - Market size and forecast 2023-2028 ($ million)
- Exhibits19: Chart on Global Market: Year-over-year growth 2023-2028 (%)
- Exhibits20: Data Table on Global Market: Year-over-year growth 2023-2028 (%)
- Exhibits21: Historic Market Size - Data Table on Global Mechanical Ventilators Market 2018 - 2022 ($ million)
- Exhibits22: Historic Market Size - End-user Segment 2018 - 2022 ($ million)
- Exhibits23: Historic Market Size - Product Segment 2018 - 2022 ($ million)
- Exhibits24: Historic Market Size - Technology Segment 2018 - 2022 ($ million)
- Exhibits25: Historic Market Size - Geography Segment 2018 - 2022 ($ million)
- Exhibits26: Historic Market Size - Country Segment 2018 - 2022 ($ million)
- Exhibits27: Five forces analysis - Comparison between 2023 and 2028
- Exhibits28: Bargaining power of buyers - Impact of key factors 2023 and 2028
- Exhibits29: Bargaining power of suppliers - Impact of key factors in 2023 and 2028
- Exhibits30: Threat of new entrants - Impact of key factors in 2023 and 2028
- Exhibits31: Threat of substitutes - Impact of key factors in 2023 and 2028
- Exhibits32: Threat of rivalry - Impact of key factors in 2023 and 2028
- Exhibits33: Chart on Market condition - Five forces 2023 and 2028
- Exhibits34: Chart on End-user - Market share 2023-2028 (%)
- Exhibits35: Data Table on End-user - Market share 2023-2028 (%)
- Exhibits36: Chart on Comparison by End-user
- Exhibits37: Data Table on Comparison by End-user
- Exhibits38: Chart on Hospitals - Market size and forecast 2023-2028 ($ million)
- Exhibits39: Data Table on Hospitals - Market size and forecast 2023-2028 ($ million)
- Exhibits40: Chart on Hospitals - Year-over-year growth 2023-2028 (%)
- Exhibits41: Data Table on Hospitals - Year-over-year growth 2023-2028 (%)
- Exhibits42: Chart on Ambulatory surgery centers - Market size and forecast 2023-2028 ($ million)
- Exhibits43: Data Table on Ambulatory surgery centers - Market size and forecast 2023-2028 ($ million)
- Exhibits44: Chart on Ambulatory surgery centers - Year-over-year growth 2023-2028 (%)
- Exhibits45: Data Table on Ambulatory surgery centers - Year-over-year growth 2023-2028 (%)
- Exhibits46: Chart on Home-care settings - Market size and forecast 2023-2028 ($ million)
- Exhibits47: Data Table on Home-care settings - Market size and forecast 2023-2028 ($ million)
- Exhibits48: Chart on Home-care settings - Year-over-year growth 2023-2028 (%)
- Exhibits49: Data Table on Home-care settings - Year-over-year growth 2023-2028 (%)
- Exhibits50: Market opportunity by End-user ($ million)
- Exhibits51: Data Table on Market opportunity by End-user ($ million)
- Exhibits52: Chart on Product - Market share 2023-2028 (%)
- Exhibits53: Data Table on Product - Market share 2023-2028 (%)
- Exhibits54: Chart on Comparison by Product
- Exhibits55: Data Table on Comparison by Product
- Exhibits56: Chart on Critical care ventilators - Market size and forecast 2023-2028 ($ million)
- Exhibits57: Data Table on Critical care ventilators - Market size and forecast 2023-2028 ($ million)
- Exhibits58: Chart on Critical care ventilators - Year-over-year growth 2023-2028 (%)
- Exhibits59: Data Table on Critical care ventilators - Year-over-year growth 2023-2028 (%)
- Exhibits60: Chart on Portable ventilators - Market size and forecast 2023-2028 ($ million)
- Exhibits61: Data Table on Portable ventilators - Market size and forecast 2023-2028 ($ million)
- Exhibits62: Chart on Portable ventilators - Year-over-year growth 2023-2028 (%)
- Exhibits63: Data Table on Portable ventilators - Year-over-year growth 2023-2028 (%)
- Exhibits64: Chart on Neonatal - Market size and forecast 2023-2028 ($ million)
- Exhibits65: Data Table on Neonatal - Market size and forecast 2023-2028 ($ million)
- Exhibits66: Chart on Neonatal - Year-over-year growth 2023-2028 (%)
- Exhibits67: Data Table on Neonatal - Year-over-year growth 2023-2028 (%)
- Exhibits68: Market opportunity by Product ($ million)
- Exhibits69: Data Table on Market opportunity by Product ($ million)
- Exhibits70: Chart on Technology - Market share 2023-2028 (%)
- Exhibits71: Data Table on Technology - Market share 2023-2028 (%)
- Exhibits72: Chart on Comparison by Technology
- Exhibits73: Data Table on Comparison by Technology
- Exhibits74: Chart on Non-invasive - Market size and forecast 2023-2028 ($ million)
- Exhibits75: Data Table on Non-invasive - Market size and forecast 2023-2028 ($ million)
- Exhibits76: Chart on Non-invasive - Year-over-year growth 2023-2028 (%)
- Exhibits77: Data Table on Non-invasive - Year-over-year growth 2023-2028 (%)
- Exhibits78: Chart on Invasive - Market size and forecast 2023-2028 ($ million)
- Exhibits79: Data Table on Invasive - Market size and forecast 2023-2028 ($ million)
- Exhibits80: Chart on Invasive - Year-over-year growth 2023-2028 (%)
- Exhibits81: Data Table on Invasive - Year-over-year growth 2023-2028 (%)
- Exhibits82: Market opportunity by Technology ($ million)
- Exhibits83: Data Table on Market opportunity by Technology ($ million)
- Exhibits84: Analysis of price sensitivity, lifecycle, customer purchase basket, adoption rates, and purchase criteria
- Exhibits85: Chart on Market share by geography 2023-2028 (%)
- Exhibits86: Data Table on Market share by geography 2023-2028 (%)
- Exhibits87: Chart on Geographic comparison
- Exhibits88: Data Table on Geographic comparison
- Exhibits89: Chart on North America - Market size and forecast 2023-2028 ($ million)
- Exhibits90: Data Table on North America - Market size and forecast 2023-2028 ($ million)
- Exhibits91: Chart on North America - Year-over-year growth 2023-2028 (%)
- Exhibits92: Data Table on North America - Year-over-year growth 2023-2028 (%)
- Exhibits93: Chart on Europe - Market size and forecast 2023-2028 ($ million)
- Exhibits94: Data Table on Europe - Market size and forecast 2023-2028 ($ million)
- Exhibits95: Chart on Europe - Year-over-year growth 2023-2028 (%)
- Exhibits96: Data Table on Europe - Year-over-year growth 2023-2028 (%)
- Exhibits97: Chart on Asia - Market size and forecast 2023-2028 ($ million)
- Exhibits98: Data Table on Asia - Market size and forecast 2023-2028 ($ million)
- Exhibits99: Chart on Asia - Year-over-year growth 2023-2028 (%)
- Exhibits100: Data Table on Asia - Year-over-year growth 2023-2028 (%)
- Exhibits101: Chart on Rest of World (ROW) - Market size and forecast 2023-2028 ($ million)
- Exhibits102: Data Table on Rest of World (ROW) - Market size and forecast 2023-2028 ($ million)
- Exhibits103: Chart on Rest of World (ROW) - Year-over-year growth 2023-2028 (%)
- Exhibits104: Data Table on Rest of World (ROW) - Year-over-year growth 2023-2028 (%)
- Exhibits105: Chart on US - Market size and forecast 2023-2028 ($ million)
- Exhibits106: Data Table on US - Market size and forecast 2023-2028 ($ million)
- Exhibits107: Chart on US - Year-over-year growth 2023-2028 (%)
- Exhibits108: Data Table on US - Year-over-year growth 2023-2028 (%)
- Exhibits109: Chart on UK - Market size and forecast 2023-2028 ($ million)
- Exhibits110: Data Table on UK - Market size and forecast 2023-2028 ($ million)
- Exhibits111: Chart on UK - Year-over-year growth 2023-2028 (%)
- Exhibits112: Data Table on UK - Year-over-year growth 2023-2028 (%)
- Exhibits113: Chart on Germany - Market size and forecast 2023-2028 ($ million)
- Exhibits114: Data Table on Germany - Market size and forecast 2023-2028 ($ million)
- Exhibits115: Chart on Germany - Year-over-year growth 2023-2028 (%)
- Exhibits116: Data Table on Germany - Year-over-year growth 2023-2028 (%)
- Exhibits117: Chart on China - Market size and forecast 2023-2028 ($ million)
- Exhibits118: Data Table on China - Market size and forecast 2023-2028 ($ million)
- Exhibits119: Chart on China - Year-over-year growth 2023-2028 (%)
- Exhibits120: Data Table on China - Year-over-year growth 2023-2028 (%)
- Exhibits121: Chart on Japan - Market size and forecast 2023-2028 ($ million)
- Exhibits122: Data Table on Japan - Market size and forecast 2023-2028 ($ million)
- Exhibits123: Chart on Japan - Year-over-year growth 2023-2028 (%)
- Exhibits124: Data Table on Japan - Year-over-year growth 2023-2028 (%)
- Exhibits125: Market opportunity by geography ($ million)
- Exhibits126: Data Tables on Market opportunity by geography ($ million)
- Exhibits127: Impact of drivers and challenges in 2023 and 2028
- Exhibits128: Overview on criticality of inputs and factors of differentiation
- Exhibits129: Overview on factors of disruption
- Exhibits130: Impact of key risks on business
- Exhibits131: Companies covered
- Exhibits132: Matrix on companies position and classification
- Exhibits133: Air Liquide SA - Overview
- Exhibits134: Air Liquide SA - Business segments
- Exhibits135: Air Liquide SA - Key news
- Exhibits136: Air Liquide SA - Key offerings
- Exhibits137: Air Liquide SA - Segment focus
- Exhibits138: Asahi Kasei Corp. - Overview
- Exhibits139: Asahi Kasei Corp. - Business segments
- Exhibits140: Asahi Kasei Corp. - Key news
- Exhibits141: Asahi Kasei Corp. - Key offerings
- Exhibits142: Asahi Kasei Corp. - Segment focus
- Exhibits143: Boston Scientific Corp. - Overview
- Exhibits144: Boston Scientific Corp. - Business segments
- Exhibits145: Boston Scientific Corp. - Key news
- Exhibits146: Boston Scientific Corp. - Key offerings
- Exhibits147: Boston Scientific Corp. - Segment focus
- Exhibits148: Dragerwerk AG and Co. KGaA - Overview
- Exhibits149: Dragerwerk AG and Co. KGaA - Business segments
- Exhibits150: Dragerwerk AG and Co. KGaA - Key news
- Exhibits151: Dragerwerk AG and Co. KGaA - Key offerings
- Exhibits152: Dragerwerk AG and Co. KGaA - Segment focus
- Exhibits153: Fisher and Paykel Healthcare Corp. Ltd. - Overview
- Exhibits154: Fisher and Paykel Healthcare Corp. Ltd. - Product / Service
- Exhibits155: Fisher and Paykel Healthcare Corp. Ltd. - Key news
- Exhibits156: Fisher and Paykel Healthcare Corp. Ltd. - Key offerings
- Exhibits157: General Electric Co. - Overview
- Exhibits158: General Electric Co. - Business segments
- Exhibits159: General Electric Co. - Key news
- Exhibits160: General Electric Co. - Key offerings
- Exhibits161: General Electric Co. - Segment focus
- Exhibits162: Getinge AB - Overview
- Exhibits163: Getinge AB - Business segments
- Exhibits164: Getinge AB - Key news
- Exhibits165: Getinge AB - Key offerings
- Exhibits166: Getinge AB - Segment focus
- Exhibits167: Hamilton Co. - Overview
- Exhibits168: Hamilton Co. - Product / Service
- Exhibits169: Hamilton Co. - Key offerings
- Exhibits170: ICU Medical Inc. - Overview
- Exhibits171: ICU Medical Inc. - Product / Service
- Exhibits172: ICU Medical Inc. - Key news
- Exhibits173: ICU Medical Inc. - Key offerings
- Exhibits174: Koninklijke Philips N.V. - Overview
- Exhibits175: Koninklijke Philips N.V. - Business segments
- Exhibits176: Koninklijke Philips N.V. - Key news
- Exhibits177: Koninklijke Philips N.V. - Key offerings
- Exhibits178: Koninklijke Philips N.V. - Segment focus
- Exhibits179: Medtronic Plc - Overview
- Exhibits180: Medtronic Plc - Business segments
- Exhibits181: Medtronic Plc - Key news
- Exhibits182: Medtronic Plc - Key offerings
- Exhibits183: Medtronic Plc - Segment focus
- Exhibits184: Nihon Kohden Corp. - Overview
- Exhibits185: Nihon Kohden Corp. - Business segments
- Exhibits186: Nihon Kohden Corp. - Key offerings
- Exhibits187: Nihon Kohden Corp. - Segment focus
- Exhibits188: ResMed Inc. - Overview
- Exhibits189: ResMed Inc. - Business segments
- Exhibits190: ResMed Inc. - Key news
- Exhibits191: ResMed Inc. - Key offerings
- Exhibits192: ResMed Inc. - Segment focus
- Exhibits193: Shenzhen Mindray BioMedical Electronics Co. Ltd - Overview
- Exhibits194: Shenzhen Mindray BioMedical Electronics Co. Ltd - Product / Service
- Exhibits195: Shenzhen Mindray BioMedical Electronics Co. Ltd - Key news
- Exhibits196: Shenzhen Mindray BioMedical Electronics Co. Ltd - Key offerings
- Exhibits197: Vyaire Medical Inc. - Overview
- Exhibits198: Vyaire Medical Inc. - Product / Service
- Exhibits199: Vyaire Medical Inc. - Key offerings
- Exhibits200: Inclusions checklist
- Exhibits201: Exclusions checklist
- Exhibits202: Currency conversion rates for US$
- Exhibits203: Research methodology
- Exhibits204: Information sources
- Exhibits205: Data validation
- Exhibits206: Validation techniques employed for market sizing
- Exhibits207: Data synthesis
- Exhibits208: 360 degree market analysis
- Exhibits209: List of abbreviations
Technavio has been monitoring the mechanical ventilators market and is forecast to grow by USD 2005.3 mn during 2023-2028, accelerating at a CAGR of 6.78% during the forecast period. Our report on the mechanical ventilators market provides a holistic analysis, market size and forecast, trends, growth drivers, and challenges, as well as vendor analysis covering around 25 vendors.
The report offers an up-to-date analysis regarding the current market scenario, the latest trends and drivers, and the overall market environment. The market is driven by increasing prevalence of respiratory diseases, growing geriatric population globally, and increasing volume of surgical procedures needing ventilatory support.
Technavio's mechanical ventilators market is segmented as below:
| Market Scope | |
|---|---|
| Base Year | 2024 |
| End Year | 2028 |
| Series Year | 2024-2028 |
| Growth Momentum | Accelerate |
| YOY 2024 | 6.23% |
| CAGR | 6.78% |
| Incremental Value | $2005.3mn |
By End-user
- Hospitals
- Ambulatory surgery centers
- Home-care settings
By Product
- Critical care ventilators
- Portable ventilators
- Neonatal
By Technology
- Non-invasive
- Invasive
By Geography
- North America
- Europe
- Asia
- Rest of World (ROW)
This study identifies the technological advancements in mechanical ventilators as one of the prime reasons driving the mechanical ventilators market growth during the next few years. Also, shift toward homecare ventilation and integration of remote monitoring and telemedicine will lead to sizable demand in the market.
Technavio presents a detailed picture of the market by the way of study, synthesis, and summation of data from multiple sources by an analysis of key parameters. Our report on the mechanical ventilators market covers the following areas:
- Mechanical ventilators market sizing
- Mechanical ventilators market forecast
- Mechanical ventilators market industry analysis
Technavio's robust vendor analysis is designed to help clients improve their market position, and in line with this, this report provides a detailed analysis of several leading mechanical ventilators market vendors that include Air Liquide SA, Allied Healthcare Products Inc., Asahi Kasei Corp., Boston Scientific Corp., Dragerwerk AG and Co. KGaA, Fisher and Paykel Healthcare Corp. Ltd., General Electric Co., Getinge AB, Hamilton Co., ICU Medical Inc., Koninklijke Philips N.V., Medtronic Plc, MicroPort Scientific Corp., Nihon Kohden Corp., ResMed Inc., SCHILLER AG, Shenzhen Mindray BioMedical Electronics Co. Ltd, Smiths Group Plc, Stryker Corp., and Vyaire Medical Inc.. Also, the mechanical ventilators market analysis report includes information on upcoming trends and challenges that will influence market growth. This is to help companies strategize and leverage all forthcoming growth opportunities.
The study was conducted using an objective combination of primary and secondary information including inputs from key participants in the industry. The report contains a comprehensive market and vendor landscape in addition to an analysis of the key vendors.
Technavio presents a detailed picture of the market by the way of study, synthesis, and summation of data from multiple sources by an analysis of key parameters such as profit, pricing, competition, and promotions. It presents various market facets by identifying the key industry influencers. The data presented is comprehensive, reliable, and a result of extensive research - both primary and secondary. Technavio's market research reports provide a complete competitive landscape and an in-depth vendor selection methodology and analysis using qualitative and quantitative research to forecast accurate market growth.
Table of Contents
1 Executive Summary
- 1.1 Market overview
- Executive Summary - Chart on Market Overview
- Executive Summary - Data Table on Market Overview
- Executive Summary - Chart on Global Market Characteristics
- Executive Summary - Chart on Market by Geography
- Executive Summary - Chart on Market Segmentation by End-user
- Executive Summary - Chart on Market Segmentation by Product
- Executive Summary - Chart on Market Segmentation by Technology
- Executive Summary - Chart on Incremental Growth
- Executive Summary - Data Table on Incremental Growth
- Executive Summary - Chart on Company Market Positioning
2 Market Landscape
- 2.1 Market ecosystem
- Parent Market
- Data Table on - Parent Market
- 2.2 Market characteristics
- Market characteristics analysis
- 2.3 Value chain analysis
- Value Chain Analysis
3 Market Sizing
- 3.1 Market definition
- Offerings of companies included in the market definition
- 3.2 Market segment analysis
- Market segments
- 3.3 Market size 2023
- 3.4 Market outlook: Forecast for 2023-2028
- Chart on Global - Market size and forecast 2023-2028 ($ million)
- Data Table on Global - Market size and forecast 2023-2028 ($ million)
- Chart on Global Market: Year-over-year growth 2023-2028 (%)
- Data Table on Global Market: Year-over-year growth 2023-2028 (%)
4 Historic Market Size
- 4.1 Global Mechanical Ventilators Market 2018 - 2022
- Historic Market Size - Data Table on Global Mechanical Ventilators Market 2018 - 2022 ($ million)
- 4.2 End-user segment analysis 2018 - 2022
- Historic Market Size - End-user Segment 2018 - 2022 ($ million)
- 4.3 Product segment analysis 2018 - 2022
- Historic Market Size - Product Segment 2018 - 2022 ($ million)
- 4.4 Technology segment analysis 2018 - 2022
- Historic Market Size - Technology Segment 2018 - 2022 ($ million)
- 4.5 Geography segment analysis 2018 - 2022
- Historic Market Size - Geography Segment 2018 - 2022 ($ million)
- 4.6 Country segment analysis 2018 - 2022
- Historic Market Size - Country Segment 2018 - 2022 ($ million)
5 Five Forces Analysis
- 5.1 Five forces summary
- Five forces analysis - Comparison between 2023 and 2028
- 5.2 Bargaining power of buyers
- Bargaining power of buyers - Impact of key factors 2023 and 2028
- 5.3 Bargaining power of suppliers
- Bargaining power of suppliers - Impact of key factors in 2023 and 2028
- 5.4 Threat of new entrants
- Threat of new entrants - Impact of key factors in 2023 and 2028
- 5.5 Threat of substitutes
- Threat of substitutes - Impact of key factors in 2023 and 2028
- 5.6 Threat of rivalry
- Threat of rivalry - Impact of key factors in 2023 and 2028
- 5.7 Market condition
- Chart on Market condition - Five forces 2023 and 2028
6 Market Segmentation by End-user
- 6.1 Market segments
- Chart on End-user - Market share 2023-2028 (%)
- Data Table on End-user - Market share 2023-2028 (%)
- 6.2 Comparison by End-user
- Chart on Comparison by End-user
- Data Table on Comparison by End-user
- 6.3 Hospitals - Market size and forecast 2023-2028
- Chart on Hospitals - Market size and forecast 2023-2028 ($ million)
- Data Table on Hospitals - Market size and forecast 2023-2028 ($ million)
- Chart on Hospitals - Year-over-year growth 2023-2028 (%)
- Data Table on Hospitals - Year-over-year growth 2023-2028 (%)
- 6.4 Ambulatory surgery centers - Market size and forecast 2023-2028
- Chart on Ambulatory surgery centers - Market size and forecast 2023-2028 ($ million)
- Data Table on Ambulatory surgery centers - Market size and forecast 2023-2028 ($ million)
- Chart on Ambulatory surgery centers - Year-over-year growth 2023-2028 (%)
- Data Table on Ambulatory surgery centers - Year-over-year growth 2023-2028 (%)
- 6.5 Home-care settings - Market size and forecast 2023-2028
- Chart on Home-care settings - Market size and forecast 2023-2028 ($ million)
- Data Table on Home-care settings - Market size and forecast 2023-2028 ($ million)
- Chart on Home-care settings - Year-over-year growth 2023-2028 (%)
- Data Table on Home-care settings - Year-over-year growth 2023-2028 (%)
- 6.6 Market opportunity by End-user
- Market opportunity by End-user ($ million)
- Data Table on Market opportunity by End-user ($ million)
7 Market Segmentation by Product
- 7.1 Market segments
- Chart on Product - Market share 2023-2028 (%)
- Data Table on Product - Market share 2023-2028 (%)
- 7.2 Comparison by Product
- Chart on Comparison by Product
- Data Table on Comparison by Product
- 7.3 Critical care ventilators - Market size and forecast 2023-2028
- Chart on Critical care ventilators - Market size and forecast 2023-2028 ($ million)
- Data Table on Critical care ventilators - Market size and forecast 2023-2028 ($ million)
- Chart on Critical care ventilators - Year-over-year growth 2023-2028 (%)
- Data Table on Critical care ventilators - Year-over-year growth 2023-2028 (%)
- 7.4 Portable ventilators - Market size and forecast 2023-2028
- Chart on Portable ventilators - Market size and forecast 2023-2028 ($ million)
- Data Table on Portable ventilators - Market size and forecast 2023-2028 ($ million)
- Chart on Portable ventilators - Year-over-year growth 2023-2028 (%)
- Data Table on Portable ventilators - Year-over-year growth 2023-2028 (%)
- 7.5 Neonatal - Market size and forecast 2023-2028
- Chart on Neonatal - Market size and forecast 2023-2028 ($ million)
- Data Table on Neonatal - Market size and forecast 2023-2028 ($ million)
- Chart on Neonatal - Year-over-year growth 2023-2028 (%)
- Data Table on Neonatal - Year-over-year growth 2023-2028 (%)
- 7.6 Market opportunity by Product
- Market opportunity by Product ($ million)
- Data Table on Market opportunity by Product ($ million)
8 Market Segmentation by Technology
- 8.1 Market segments
- Chart on Technology - Market share 2023-2028 (%)
- Data Table on Technology - Market share 2023-2028 (%)
- 8.2 Comparison by Technology
- Chart on Comparison by Technology
- Data Table on Comparison by Technology
- 8.3 Non-invasive - Market size and forecast 2023-2028
- Chart on Non-invasive - Market size and forecast 2023-2028 ($ million)
- Data Table on Non-invasive - Market size and forecast 2023-2028 ($ million)
- Chart on Non-invasive - Year-over-year growth 2023-2028 (%)
- Data Table on Non-invasive - Year-over-year growth 2023-2028 (%)
- 8.4 Invasive - Market size and forecast 2023-2028
- Chart on Invasive - Market size and forecast 2023-2028 ($ million)
- Data Table on Invasive - Market size and forecast 2023-2028 ($ million)
- Chart on Invasive - Year-over-year growth 2023-2028 (%)
- Data Table on Invasive - Year-over-year growth 2023-2028 (%)
- 8.5 Market opportunity by Technology
- Market opportunity by Technology ($ million)
- Data Table on Market opportunity by Technology ($ million)
9 Customer Landscape
- 9.1 Customer landscape overview
- Analysis of price sensitivity, lifecycle, customer purchase basket, adoption rates, and purchase criteria
10 Geographic Landscape
- 10.1 Geographic segmentation
- Chart on Market share by geography 2023-2028 (%)
- Data Table on Market share by geography 2023-2028 (%)
- 10.2 Geographic comparison
- Chart on Geographic comparison
- Data Table on Geographic comparison
- 10.3 North America - Market size and forecast 2023-2028
- Chart on North America - Market size and forecast 2023-2028 ($ million)
- Data Table on North America - Market size and forecast 2023-2028 ($ million)
- Chart on North America - Year-over-year growth 2023-2028 (%)
- Data Table on North America - Year-over-year growth 2023-2028 (%)
- 10.4 Europe - Market size and forecast 2023-2028
- Chart on Europe - Market size and forecast 2023-2028 ($ million)
- Data Table on Europe - Market size and forecast 2023-2028 ($ million)
- Chart on Europe - Year-over-year growth 2023-2028 (%)
- Data Table on Europe - Year-over-year growth 2023-2028 (%)
- 10.5 Asia - Market size and forecast 2023-2028
- Chart on Asia - Market size and forecast 2023-2028 ($ million)
- Data Table on Asia - Market size and forecast 2023-2028 ($ million)
- Chart on Asia - Year-over-year growth 2023-2028 (%)
- Data Table on Asia - Year-over-year growth 2023-2028 (%)
- 10.6 Rest of World (ROW) - Market size and forecast 2023-2028
- Chart on Rest of World (ROW) - Market size and forecast 2023-2028 ($ million)
- Data Table on Rest of World (ROW) - Market size and forecast 2023-2028 ($ million)
- Chart on Rest of World (ROW) - Year-over-year growth 2023-2028 (%)
- Data Table on Rest of World (ROW) - Year-over-year growth 2023-2028 (%)
- 10.7 US - Market size and forecast 2023-2028
- Chart on US - Market size and forecast 2023-2028 ($ million)
- Data Table on US - Market size and forecast 2023-2028 ($ million)
- Chart on US - Year-over-year growth 2023-2028 (%)
- Data Table on US - Year-over-year growth 2023-2028 (%)
- 10.8 UK - Market size and forecast 2023-2028
- Chart on UK - Market size and forecast 2023-2028 ($ million)
- Data Table on UK - Market size and forecast 2023-2028 ($ million)
- Chart on UK - Year-over-year growth 2023-2028 (%)
- Data Table on UK - Year-over-year growth 2023-2028 (%)
- 10.9 Germany - Market size and forecast 2023-2028
- Chart on Germany - Market size and forecast 2023-2028 ($ million)
- Data Table on Germany - Market size and forecast 2023-2028 ($ million)
- Chart on Germany - Year-over-year growth 2023-2028 (%)
- Data Table on Germany - Year-over-year growth 2023-2028 (%)
- 10.10 China - Market size and forecast 2023-2028
- Chart on China - Market size and forecast 2023-2028 ($ million)
- Data Table on China - Market size and forecast 2023-2028 ($ million)
- Chart on China - Year-over-year growth 2023-2028 (%)
- Data Table on China - Year-over-year growth 2023-2028 (%)
- 10.11 Japan - Market size and forecast 2023-2028
- Chart on Japan - Market size and forecast 2023-2028 ($ million)
- Data Table on Japan - Market size and forecast 2023-2028 ($ million)
- Chart on Japan - Year-over-year growth 2023-2028 (%)
- Data Table on Japan - Year-over-year growth 2023-2028 (%)
- 10.12 Market opportunity by geography
- Market opportunity by geography ($ million)
- Data Tables on Market opportunity by geography ($ million)
11 Drivers, Challenges, and Opportunity/Restraints
- 11.1 Market drivers
- 11.2 Market challenges
- 11.3 Impact of drivers and challenges
- Impact of drivers and challenges in 2023 and 2028
- 11.4 Market opportunities/restraints
12 Competitive Landscape
- 12.1 Overview
- 12.2 Competitive Landscape
- Overview on criticality of inputs and factors of differentiation
- 12.3 Landscape disruption
- Overview on factors of disruption
- 12.4 Industry risks
- Impact of key risks on business
13 Competitive Analysis
- 13.1 Companies profiled
- Companies covered
- 13.2 Market positioning of companies
- Matrix on companies position and classification
- 13.3 Air Liquide SA
- Air Liquide SA - Overview
- Air Liquide SA - Business segments
- Air Liquide SA - Key news
- Air Liquide SA - Key offerings
- Air Liquide SA - Segment focus
- 13.4 Asahi Kasei Corp.
- Asahi Kasei Corp. - Overview
- Asahi Kasei Corp. - Business segments
- Asahi Kasei Corp. - Key news
- Asahi Kasei Corp. - Key offerings
- Asahi Kasei Corp. - Segment focus
- 13.5 Boston Scientific Corp.
- Boston Scientific Corp. - Overview
- Boston Scientific Corp. - Business segments
- Boston Scientific Corp. - Key news
- Boston Scientific Corp. - Key offerings
- Boston Scientific Corp. - Segment focus
- 13.6 Dragerwerk AG and Co. KGaA
- Dragerwerk AG and Co. KGaA - Overview
- Dragerwerk AG and Co. KGaA - Business segments
- Dragerwerk AG and Co. KGaA - Key news
- Dragerwerk AG and Co. KGaA - Key offerings
- Dragerwerk AG and Co. KGaA - Segment focus
- 13.7 Fisher and Paykel Healthcare Corp. Ltd.
- Fisher and Paykel Healthcare Corp. Ltd. - Overview
- Fisher and Paykel Healthcare Corp. Ltd. - Product / Service
- Fisher and Paykel Healthcare Corp. Ltd. - Key news
- Fisher and Paykel Healthcare Corp. Ltd. - Key offerings
- 13.8 General Electric Co.
- General Electric Co. - Overview
- General Electric Co. - Business segments
- General Electric Co. - Key news
- General Electric Co. - Key offerings
- General Electric Co. - Segment focus
- 13.9 Getinge AB
- Getinge AB - Overview
- Getinge AB - Business segments
- Getinge AB - Key news
- Getinge AB - Key offerings
- Getinge AB - Segment focus
- 13.10 Hamilton Co.
- Hamilton Co. - Overview
- Hamilton Co. - Product / Service
- Hamilton Co. - Key offerings
- 13.11 ICU Medical Inc.
- ICU Medical Inc. - Overview
- ICU Medical Inc. - Product / Service
- ICU Medical Inc. - Key news
- ICU Medical Inc. - Key offerings
- 13.12 Koninklijke Philips N.V.
- Koninklijke Philips N.V. - Overview
- Koninklijke Philips N.V. - Business segments
- Koninklijke Philips N.V. - Key news
- Koninklijke Philips N.V. - Key offerings
- Koninklijke Philips N.V. - Segment focus
- 13.13 Medtronic Plc
- Medtronic Plc - Overview
- Medtronic Plc - Business segments
- Medtronic Plc - Key news
- Medtronic Plc - Key offerings
- Medtronic Plc - Segment focus
- 13.14 Nihon Kohden Corp.
- Nihon Kohden Corp. - Overview
- Nihon Kohden Corp. - Business segments
- Nihon Kohden Corp. - Key offerings
- Nihon Kohden Corp. - Segment focus
- 13.15 ResMed Inc.
- ResMed Inc. - Overview
- ResMed Inc. - Business segments
- ResMed Inc. - Key news
- ResMed Inc. - Key offerings
- ResMed Inc. - Segment focus
- 13.16 Shenzhen Mindray BioMedical Electronics Co. Ltd
- Shenzhen Mindray BioMedical Electronics Co. Ltd - Overview
- Shenzhen Mindray BioMedical Electronics Co. Ltd - Product / Service
- Shenzhen Mindray BioMedical Electronics Co. Ltd - Key news
- Shenzhen Mindray BioMedical Electronics Co. Ltd - Key offerings
- 13.17 Vyaire Medical Inc.
- Vyaire Medical Inc. - Overview
- Vyaire Medical Inc. - Product / Service
- Vyaire Medical Inc. - Key offerings
14 Appendix
- 14.1 Scope of the report
- 14.2 Inclusions and exclusions checklist
- Inclusions checklist
- Exclusions checklist
- 14.3 Currency conversion rates for US$
- Currency conversion rates for US$
- 14.4 Research methodology
- Research methodology
- 14.5 Data procurement
- Information sources
- 14.6 Data validation
- Data validation
- 14.7 Validation techniques employed for market sizing
- Validation techniques employed for market sizing
- 14.8 Data synthesis
- Data synthesis
- 13.9 market analysis
- market analysis
- 14.10 List of abbreviations
- List of abbreviations

