|
|
市場調査レポート
商品コード
1502129
タンパク質治療薬の世界市場 2024-2028Global protein therapeutics market 2024-2028 |
||||||

|
|||||||
カスタマイズ可能
|
|||||||

| タンパク質治療薬の世界市場 2024-2028 |
|
出版日: 2024年05月20日
発行: TechNavio
ページ情報: 英文 191 Pages
納期: 即納可能
|

全表示
- 概要
- 図表
- 目次
Technavio社は、タンパク質治療薬市場を調査し、2023年から2028年にかけて1,728億米ドル、予測期間中のCAGRは9.47%で成長すると予測しています。
当レポートでは、タンパク質治療薬市場の全体的な分析、市場規模・予測、動向、成長促進要因、課題、約25のベンダーを網羅したベンダー分析などを掲載しています。
現在の市場シナリオ、最新動向と促進要因、市場環境全体に関する最新分析を提供しています。MABSに対する需要の増加、革新的技術を用いた新規療法の市場開発、有利な償還政策の利用可能性などが市場を牽引しています。
| 市場範囲 | |
|---|---|
| 基準年 | 2024 |
| 終了年 | 2028 |
| 予測期間 | 2024-2028 |
| 成長モメンタム | 加速 |
| 前年比2024年 | 8.44% |
| CAGR | 9.47% |
| 増分額 | 1,728億米ドル |
本調査では、今後数年間のタンパク質治療薬市場成長を牽引する主な要因の一つとして、タンパク質治療薬の改良に継続的に注力していることを挙げています。また、二重特異性抗体や多特異性抗体の出現や慢性疾患の増加は、市場の大きな需要につながります。
目次
第1章 エグゼクティブサマリー
- 市場概要
第2章 市場情勢
- 市場エコシステム
- 市場の特徴
- バリューチェーン分析
第3章 市場規模の評価
- 市場の定義
- 市場セグメント分析
- 市場規模 2023
- 市場の見通し 2023-2028
第4章 市場規模実績
- 世界タンパク質治療薬市場 2018-2022
- 製品別セグメント分析 2018-2022
- 用途別セグメント分析 2018-2022
- 地域別セグメント分析 2018-2022
- 国別セグメント分析 2018-2022
第5章 ファイブフォース分析
- ファイブフォースの要約
- 買い手の交渉力
- 供給企業の交渉力
- 新規参入業者の脅威
- 代替品の脅威
- 競争の脅威
- 市況
第6章 市場セグメンテーション:製品別
- 市場セグメンテーション
- 比較:製品別
- モノクローナル抗体:市場規模と予測 2023-2028
- ヒトインスリン:市場規模と予測 2023-2028
- エリスロポエチン:市場規模と予測 2023-2028
- 凝固因子:市場規模と予測 2023-2028
- その他:市場規模と予測 2023-2028
- 市場機会:製品別
第7章 市場セグメンテーション:用途別
- 市場セグメンテーション
- 比較:用途別
- 代謝障害:市場規模と予測 2023-2028
- 免疫疾患:市場規模と予測 2023-2028
- 血液疾患:市場規模と予測 2023-2028
- がん:市場規模と予測 2023-2028
- 遺伝性疾患:市場規模と予測 2023-2028
- 市場機会:用途別
第8章 顧客情勢
- 顧客情勢の概要
第9章 地域別情勢
- 地域別セグメンテーション
- 地域別比較
- 北米:市場規模と予測 2023-2028
- 欧州:市場規模と予測 2023-2028
- アジア:市場規模と予測 2023-2028
- 世界のその他の地域:市場規模と予測 2023-2028
- 米国:市場規模と予測 2023-2028
- カナダ:市場規模と予測 2023-2028
- ドイツ:市場規模と予測 2023-2028
- 英国:市場規模と予測 2023-2028
- 中国:市場規模と予測 2023-2028
- 市場機会:地域別
第10章 促進要因・課題・機会・抑制要因
- 市場促進要因
- 市場の課題
- 促進要因と課題の影響
- 市場の機会・抑制要因
第11章 競合情勢
- 概要
- 競合情勢
- 混乱の状況
- 業界のリスク
第12章 競合分析
- 企業プロファイル
- 企業の市場ポジショニング
- AbbVie Inc.
- Amgen Inc.
- AstraZeneca Plc
- Biogen Inc.
- Bristol Myers Squibb Co.
- Creative Biolabs
- Eli Lilly and Co.
- F. Hoffmann La Roche Ltd.
- Ipsen Pharma
- Johnson and Johnson Services Inc.
- LGM Pharma LLC
- Novartis AG
- Novo Nordisk AS
- Pfizer Inc.
- Sanofi SA
第13章 付録
Exhibits:
- Exhibits1: Executive Summary - Chart on Market Overview
- Exhibits2: Executive Summary - Data Table on Market Overview
- Exhibits3: Executive Summary - Chart on Global Market Characteristics
- Exhibits4: Executive Summary - Chart on Market by Geography
- Exhibits5: Executive Summary - Chart on Market Segmentation by Product
- Exhibits6: Executive Summary - Chart on Market Segmentation by Application
- Exhibits7: Executive Summary - Chart on Incremental Growth
- Exhibits8: Executive Summary - Data Table on Incremental Growth
- Exhibits9: Executive Summary - Chart on Company Market Positioning
- Exhibits10: Parent Market
- Exhibits11: Data Table on - Parent Market
- Exhibits12: Market characteristics analysis
- Exhibits13: Value Chain Analysis
- Exhibits14: Offerings of companies included in the market definition
- Exhibits15: Market segments
- Exhibits16: Chart on Global - Market size and forecast 2023-2028 ($ billion)
- Exhibits17: Data Table on Global - Market size and forecast 2023-2028 ($ billion)
- Exhibits18: Chart on Global Market: Year-over-year growth 2023-2028 (%)
- Exhibits19: Data Table on Global Market: Year-over-year growth 2023-2028 (%)
- Exhibits20: Historic Market Size - Data Table on Global Protein Therapeutics Market 2018 - 2022 ($ billion)
- Exhibits21: Historic Market Size - Product Segment 2018 - 2022 ($ billion)
- Exhibits22: Historic Market Size - Application Segment 2018 - 2022 ($ billion)
- Exhibits23: Historic Market Size - Geography Segment 2018 - 2022 ($ billion)
- Exhibits24: Historic Market Size - Country Segment 2018 - 2022 ($ billion)
- Exhibits25: Five forces analysis - Comparison between 2023 and 2028
- Exhibits26: Bargaining power of buyers - Impact of key factors 2023 and 2028
- Exhibits27: Bargaining power of suppliers - Impact of key factors in 2023 and 2028
- Exhibits28: Threat of new entrants - Impact of key factors in 2023 and 2028
- Exhibits29: Threat of substitutes - Impact of key factors in 2023 and 2028
- Exhibits30: Threat of rivalry - Impact of key factors in 2023 and 2028
- Exhibits31: Chart on Market condition - Five forces 2023 and 2028
- Exhibits32: Chart on Product - Market share 2023-2028 (%)
- Exhibits33: Data Table on Product - Market share 2023-2028 (%)
- Exhibits34: Chart on Comparison by Product
- Exhibits35: Data Table on Comparison by Product
- Exhibits36: Chart on mAbs - Market size and forecast 2023-2028 ($ billion)
- Exhibits37: Data Table on mAbs - Market size and forecast 2023-2028 ($ billion)
- Exhibits38: Chart on mAbs - Year-over-year growth 2023-2028 (%)
- Exhibits39: Data Table on mAbs - Year-over-year growth 2023-2028 (%)
- Exhibits40: Chart on Human insulin - Market size and forecast 2023-2028 ($ billion)
- Exhibits41: Data Table on Human insulin - Market size and forecast 2023-2028 ($ billion)
- Exhibits42: Chart on Human insulin - Year-over-year growth 2023-2028 (%)
- Exhibits43: Data Table on Human insulin - Year-over-year growth 2023-2028 (%)
- Exhibits44: Chart on Erythropoeitin - Market size and forecast 2023-2028 ($ billion)
- Exhibits45: Data Table on Erythropoeitin - Market size and forecast 2023-2028 ($ billion)
- Exhibits46: Chart on Erythropoeitin - Year-over-year growth 2023-2028 (%)
- Exhibits47: Data Table on Erythropoeitin - Year-over-year growth 2023-2028 (%)
- Exhibits48: Chart on Clotting factors - Market size and forecast 2023-2028 ($ billion)
- Exhibits49: Data Table on Clotting factors - Market size and forecast 2023-2028 ($ billion)
- Exhibits50: Chart on Clotting factors - Year-over-year growth 2023-2028 (%)
- Exhibits51: Data Table on Clotting factors - Year-over-year growth 2023-2028 (%)
- Exhibits52: Chart on Others - Market size and forecast 2023-2028 ($ billion)
- Exhibits53: Data Table on Others - Market size and forecast 2023-2028 ($ billion)
- Exhibits54: Chart on Others - Year-over-year growth 2023-2028 (%)
- Exhibits55: Data Table on Others - Year-over-year growth 2023-2028 (%)
- Exhibits56: Market opportunity by Product ($ billion)
- Exhibits57: Data Table on Market opportunity by Product ($ billion)
- Exhibits58: Chart on Application - Market share 2023-2028 (%)
- Exhibits59: Data Table on Application - Market share 2023-2028 (%)
- Exhibits60: Chart on Comparison by Application
- Exhibits61: Data Table on Comparison by Application
- Exhibits62: Chart on Metabolic disorders - Market size and forecast 2023-2028 ($ billion)
- Exhibits63: Data Table on Metabolic disorders - Market size and forecast 2023-2028 ($ billion)
- Exhibits64: Chart on Metabolic disorders - Year-over-year growth 2023-2028 (%)
- Exhibits65: Data Table on Metabolic disorders - Year-over-year growth 2023-2028 (%)
- Exhibits66: Chart on Immunologic disorders - Market size and forecast 2023-2028 ($ billion)
- Exhibits67: Data Table on Immunologic disorders - Market size and forecast 2023-2028 ($ billion)
- Exhibits68: Chart on Immunologic disorders - Year-over-year growth 2023-2028 (%)
- Exhibits69: Data Table on Immunologic disorders - Year-over-year growth 2023-2028 (%)
- Exhibits70: Chart on Hematological disorders - Market size and forecast 2023-2028 ($ billion)
- Exhibits71: Data Table on Hematological disorders - Market size and forecast 2023-2028 ($ billion)
- Exhibits72: Chart on Hematological disorders - Year-over-year growth 2023-2028 (%)
- Exhibits73: Data Table on Hematological disorders - Year-over-year growth 2023-2028 (%)
- Exhibits74: Chart on Cancer - Market size and forecast 2023-2028 ($ billion)
- Exhibits75: Data Table on Cancer - Market size and forecast 2023-2028 ($ billion)
- Exhibits76: Chart on Cancer - Year-over-year growth 2023-2028 (%)
- Exhibits77: Data Table on Cancer - Year-over-year growth 2023-2028 (%)
- Exhibits78: Chart on Genetic disorders - Market size and forecast 2023-2028 ($ billion)
- Exhibits79: Data Table on Genetic disorders - Market size and forecast 2023-2028 ($ billion)
- Exhibits80: Chart on Genetic disorders - Year-over-year growth 2023-2028 (%)
- Exhibits81: Data Table on Genetic disorders - Year-over-year growth 2023-2028 (%)
- Exhibits82: Market opportunity by Application ($ billion)
- Exhibits83: Data Table on Market opportunity by Application ($ billion)
- Exhibits84: Analysis of price sensitivity, lifecycle, customer purchase basket, adoption rates, and purchase criteria
- Exhibits85: Chart on Market share by geography 2023-2028 (%)
- Exhibits86: Data Table on Market share by geography 2023-2028 (%)
- Exhibits87: Chart on Geographic comparison
- Exhibits88: Data Table on Geographic comparison
- Exhibits89: Chart on North America - Market size and forecast 2023-2028 ($ billion)
- Exhibits90: Data Table on North America - Market size and forecast 2023-2028 ($ billion)
- Exhibits91: Chart on North America - Year-over-year growth 2023-2028 (%)
- Exhibits92: Data Table on North America - Year-over-year growth 2023-2028 (%)
- Exhibits93: Chart on Europe - Market size and forecast 2023-2028 ($ billion)
- Exhibits94: Data Table on Europe - Market size and forecast 2023-2028 ($ billion)
- Exhibits95: Chart on Europe - Year-over-year growth 2023-2028 (%)
- Exhibits96: Data Table on Europe - Year-over-year growth 2023-2028 (%)
- Exhibits97: Chart on Asia - Market size and forecast 2023-2028 ($ billion)
- Exhibits98: Data Table on Asia - Market size and forecast 2023-2028 ($ billion)
- Exhibits99: Chart on Asia - Year-over-year growth 2023-2028 (%)
- Exhibits100: Data Table on Asia - Year-over-year growth 2023-2028 (%)
- Exhibits101: Chart on Rest of World (ROW) - Market size and forecast 2023-2028 ($ billion)
- Exhibits102: Data Table on Rest of World (ROW) - Market size and forecast 2023-2028 ($ billion)
- Exhibits103: Chart on Rest of World (ROW) - Year-over-year growth 2023-2028 (%)
- Exhibits104: Data Table on Rest of World (ROW) - Year-over-year growth 2023-2028 (%)
- Exhibits105: Chart on US - Market size and forecast 2023-2028 ($ billion)
- Exhibits106: Data Table on US - Market size and forecast 2023-2028 ($ billion)
- Exhibits107: Chart on US - Year-over-year growth 2023-2028 (%)
- Exhibits108: Data Table on US - Year-over-year growth 2023-2028 (%)
- Exhibits109: Chart on Canada - Market size and forecast 2023-2028 ($ billion)
- Exhibits110: Data Table on Canada - Market size and forecast 2023-2028 ($ billion)
- Exhibits111: Chart on Canada - Year-over-year growth 2023-2028 (%)
- Exhibits112: Data Table on Canada - Year-over-year growth 2023-2028 (%)
- Exhibits113: Chart on Germany - Market size and forecast 2023-2028 ($ billion)
- Exhibits114: Data Table on Germany - Market size and forecast 2023-2028 ($ billion)
- Exhibits115: Chart on Germany - Year-over-year growth 2023-2028 (%)
- Exhibits116: Data Table on Germany - Year-over-year growth 2023-2028 (%)
- Exhibits117: Chart on UK - Market size and forecast 2023-2028 ($ billion)
- Exhibits118: Data Table on UK - Market size and forecast 2023-2028 ($ billion)
- Exhibits119: Chart on UK - Year-over-year growth 2023-2028 (%)
- Exhibits120: Data Table on UK - Year-over-year growth 2023-2028 (%)
- Exhibits121: Chart on China - Market size and forecast 2023-2028 ($ billion)
- Exhibits122: Data Table on China - Market size and forecast 2023-2028 ($ billion)
- Exhibits123: Chart on China - Year-over-year growth 2023-2028 (%)
- Exhibits124: Data Table on China - Year-over-year growth 2023-2028 (%)
- Exhibits125: Market opportunity by geography ($ billion)
- Exhibits126: Data Tables on Market opportunity by geography ($ billion)
- Exhibits127: Impact of drivers and challenges in 2023 and 2028
- Exhibits128: Overview on criticality of inputs and factors of differentiation
- Exhibits129: Overview on factors of disruption
- Exhibits130: Impact of key risks on business
- Exhibits131: Companies covered
- Exhibits132: Matrix on companies position and classification
- Exhibits133: AbbVie Inc. - Overview
- Exhibits134: AbbVie Inc. - Product / Service
- Exhibits135: AbbVie Inc. - Key news
- Exhibits136: AbbVie Inc. - Key offerings
- Exhibits137: Amgen Inc. - Overview
- Exhibits138: Amgen Inc. - Product / Service
- Exhibits139: Amgen Inc. - Key offerings
- Exhibits140: AstraZeneca Plc - Overview
- Exhibits141: AstraZeneca Plc - Product / Service
- Exhibits142: AstraZeneca Plc - Key news
- Exhibits143: AstraZeneca Plc - Key offerings
- Exhibits144: Biogen Inc. - Overview
- Exhibits145: Biogen Inc. - Product / Service
- Exhibits146: Biogen Inc. - Key news
- Exhibits147: Biogen Inc. - Key offerings
- Exhibits148: Bristol Myers Squibb Co. - Overview
- Exhibits149: Bristol Myers Squibb Co. - Product / Service
- Exhibits150: Bristol Myers Squibb Co. - Key news
- Exhibits151: Bristol Myers Squibb Co. - Key offerings
- Exhibits152: Creative Biolabs - Overview
- Exhibits153: Creative Biolabs - Product / Service
- Exhibits154: Creative Biolabs - Key offerings
- Exhibits155: Eli Lilly and Co. - Overview
- Exhibits156: Eli Lilly and Co. - Product / Service
- Exhibits157: Eli Lilly and Co. - Key news
- Exhibits158: Eli Lilly and Co. - Key offerings
- Exhibits159: F. Hoffmann La Roche Ltd. - Overview
- Exhibits160: F. Hoffmann La Roche Ltd. - Business segments
- Exhibits161: F. Hoffmann La Roche Ltd. - Key news
- Exhibits162: F. Hoffmann La Roche Ltd. - Key offerings
- Exhibits163: F. Hoffmann La Roche Ltd. - Segment focus
- Exhibits164: Ipsen Pharma - Overview
- Exhibits165: Ipsen Pharma - Business segments
- Exhibits166: Ipsen Pharma - Key offerings
- Exhibits167: Ipsen Pharma - Segment focus
- Exhibits168: Johnson and Johnson Services Inc. - Overview
- Exhibits169: Johnson and Johnson Services Inc. - Business segments
- Exhibits170: Johnson and Johnson Services Inc. - Key news
- Exhibits171: Johnson and Johnson Services Inc. - Key offerings
- Exhibits172: Johnson and Johnson Services Inc. - Segment focus
- Exhibits173: LGM Pharma LLC - Overview
- Exhibits174: LGM Pharma LLC - Product / Service
- Exhibits175: LGM Pharma LLC - Key offerings
- Exhibits176: Novartis AG - Overview
- Exhibits177: Novartis AG - Business segments
- Exhibits178: Novartis AG - Key news
- Exhibits179: Novartis AG - Key offerings
- Exhibits180: Novartis AG - Segment focus
- Exhibits181: Novo Nordisk AS - Overview
- Exhibits182: Novo Nordisk AS - Business segments
- Exhibits183: Novo Nordisk AS - Key offerings
- Exhibits184: Novo Nordisk AS - Segment focus
- Exhibits185: Pfizer Inc. - Overview
- Exhibits186: Pfizer Inc. - Product / Service
- Exhibits187: Pfizer Inc. - Key news
- Exhibits188: Pfizer Inc. - Key offerings
- Exhibits189: Sanofi SA - Overview
- Exhibits190: Sanofi SA - Business segments
- Exhibits191: Sanofi SA - Key news
- Exhibits192: Sanofi SA - Key offerings
- Exhibits193: Sanofi SA - Segment focus
- Exhibits194: Inclusions checklist
- Exhibits195: Exclusions checklist
- Exhibits196: Currency conversion rates for US$
- Exhibits197: Research methodology
- Exhibits198: Information sources
- Exhibits199: Data validation
- Exhibits200: Validation techniques employed for market sizing
- Exhibits201: Data synthesis
- Exhibits202: 360 degree market analysis
- Exhibits203: List of abbreviations
Technavio has been monitoring the protein therapeutics market and is forecast to grow by USD 172.8 bn during 2023-2028, accelerating at a CAGR of 9.47% during the forecast period. Our report on the protein therapeutics market provides a holistic analysis, market size and forecast, trends, growth drivers, and challenges, as well as vendor analysis covering around 25 vendors.
The report offers an up-to-date analysis regarding the current market scenario, the latest trends and drivers, and the overall market environment. The market is driven by increased demand for MABS, development of novel therapies using innovative technologies, and availability of favorable reimbursement policies.
Technavio's protein therapeutics market is segmented as below:
| Market Scope | |
|---|---|
| Base Year | 2024 |
| End Year | 2028 |
| Series Year | 2024-2028 |
| Growth Momentum | Accelerate |
| YOY 2024 | 8.44% |
| CAGR | 9.47% |
| Incremental Value | $172.8bn |
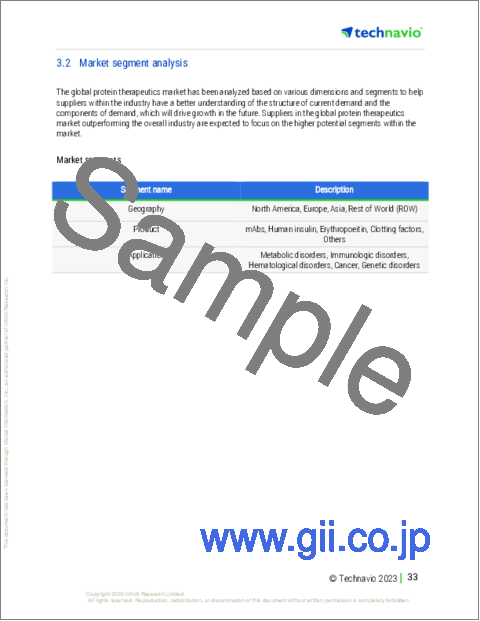
By Product
- mAbs
- Human insulin
- Erythropoeitin
- Clotting factors
- Others
By Application
- Metabolic disorders
- Immunologic disorders
- Hematological disorders
- Cancer
- Genetic disorders
By Geography
- North America
- Europe
- Asia
- Rest of World (ROW)
This study identifies the continued focus on improvement of protein therapeutics as one of the prime reasons driving the protein therapeutics market growth during the next few years. Also, emergence of bi-specific and multi-specific antibodies and increase in chronic diseases will lead to sizable demand in the market.
Technavio presents a detailed picture of the market by the way of study, synthesis, and summation of data from multiple sources by an analysis of key parameters. Our report on the protein therapeutics market covers the following areas:
- Protein therapeutics market sizing
- Protein therapeutics market forecast
- Protein therapeutics market industry analysis
Technavio's robust vendor analysis is designed to help clients improve their market position, and in line with this, this report provides a detailed analysis of several leading protein therapeutics market vendors that include AbbVie Inc., Amgen Inc., AstraZeneca Plc, Biocon Ltd., Biogen Inc., Bristol Myers Squibb Co., Celltrion Healthcare Co. Ltd., Creative Biolabs, Eli Lilly and Co., F. Hoffmann La Roche Ltd., Intas Pharmaceuticals Ltd., Ipsen Pharma, Johnson and Johnson Services Inc., LGM Pharma LLC, Midas Pharma GmbH, Novartis AG, Novo Nordisk AS, Pfizer Inc., PV Pharma Healthcare Pvt. Ltd., and Sanofi SA. Also, the protein therapeutics market analysis report includes information on upcoming trends and challenges that will influence market growth. This is to help companies strategize and leverage all forthcoming growth opportunities.
The study was conducted using an objective combination of primary and secondary information including inputs from key participants in the industry. The report contains a comprehensive market and vendor landscape in addition to an analysis of the key vendors.
Technavio presents a detailed picture of the market by the way of study, synthesis, and summation of data from multiple sources by an analysis of key parameters such as profit, pricing, competition, and promotions. It presents various market facets by identifying the key industry influencers. The data presented is comprehensive, reliable, and a result of extensive research - both primary and secondary. Technavio's market research reports provide a complete competitive landscape and an in-depth vendor selection methodology and analysis using qualitative and quantitative research to forecast accurate market growth.
Table of Contents
1 Executive Summary
- 1.1 Market overview
- Executive Summary - Chart on Market Overview
- Executive Summary - Data Table on Market Overview
- Executive Summary - Chart on Global Market Characteristics
- Executive Summary - Chart on Market by Geography
- Executive Summary - Chart on Market Segmentation by Product
- Executive Summary - Chart on Market Segmentation by Application
- Executive Summary - Chart on Incremental Growth
- Executive Summary - Data Table on Incremental Growth
- Executive Summary - Chart on Company Market Positioning
2 Market Landscape
- 2.1 Market ecosystem
- Parent Market
- Data Table on - Parent Market
- 2.2 Market characteristics
- Market characteristics analysis
- 2.3 Value chain analysis
- Value Chain Analysis
3 Market Sizing
- 3.1 Market definition
- Offerings of companies included in the market definition
- 3.2 Market segment analysis
- Market segments
- 3.3 Market size 2023
- 3.4 Market outlook: Forecast for 2023-2028
- Chart on Global - Market size and forecast 2023-2028 ($ billion)
- Data Table on Global - Market size and forecast 2023-2028 ($ billion)
- Chart on Global Market: Year-over-year growth 2023-2028 (%)
- Data Table on Global Market: Year-over-year growth 2023-2028 (%)
4 Historic Market Size
- 4.1 Global Protein Therapeutics Market 2018 - 2022
- Historic Market Size - Data Table on Global Protein Therapeutics Market 2018 - 2022 ($ billion)
- 4.2 Product segment analysis 2018 - 2022
- Historic Market Size - Product Segment 2018 - 2022 ($ billion)
- 4.3 Application segment analysis 2018 - 2022
- Historic Market Size - Application Segment 2018 - 2022 ($ billion)
- 4.4 Geography segment analysis 2018 - 2022
- Historic Market Size - Geography Segment 2018 - 2022 ($ billion)
- 4.5 Country segment analysis 2018 - 2022
- Historic Market Size - Country Segment 2018 - 2022 ($ billion)
5 Five Forces Analysis
- 5.1 Five forces summary
- Five forces analysis - Comparison between 2023 and 2028
- 5.2 Bargaining power of buyers
- Bargaining power of buyers - Impact of key factors 2023 and 2028
- 5.3 Bargaining power of suppliers
- Bargaining power of suppliers - Impact of key factors in 2023 and 2028
- 5.4 Threat of new entrants
- Threat of new entrants - Impact of key factors in 2023 and 2028
- 5.5 Threat of substitutes
- Threat of substitutes - Impact of key factors in 2023 and 2028
- 5.6 Threat of rivalry
- Threat of rivalry - Impact of key factors in 2023 and 2028
- 5.7 Market condition
- Chart on Market condition - Five forces 2023 and 2028
6 Market Segmentation by Product
- 6.1 Market segments
- Chart on Product - Market share 2023-2028 (%)
- Data Table on Product - Market share 2023-2028 (%)
- 6.2 Comparison by Product
- Chart on Comparison by Product
- Data Table on Comparison by Product
- 6.3 mAbs - Market size and forecast 2023-2028
- Chart on mAbs - Market size and forecast 2023-2028 ($ billion)
- Data Table on mAbs - Market size and forecast 2023-2028 ($ billion)
- Chart on mAbs - Year-over-year growth 2023-2028 (%)
- Data Table on mAbs - Year-over-year growth 2023-2028 (%)
- 6.4 Human insulin - Market size and forecast 2023-2028
- Chart on Human insulin - Market size and forecast 2023-2028 ($ billion)
- Data Table on Human insulin - Market size and forecast 2023-2028 ($ billion)
- Chart on Human insulin - Year-over-year growth 2023-2028 (%)
- Data Table on Human insulin - Year-over-year growth 2023-2028 (%)
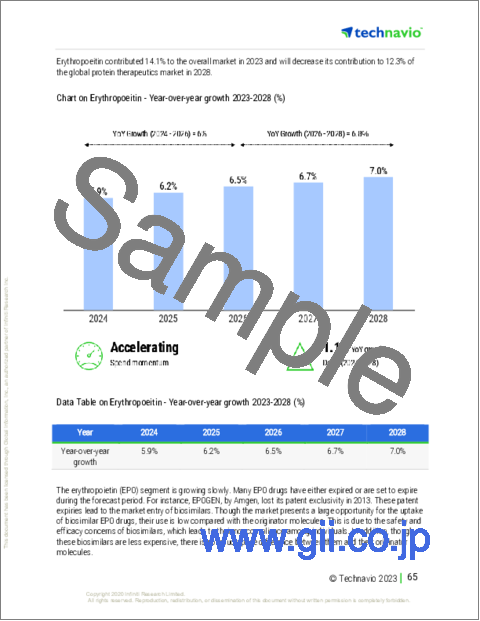
- 6.5 Erythropoeitin - Market size and forecast 2023-2028
- Chart on Erythropoeitin - Market size and forecast 2023-2028 ($ billion)
- Data Table on Erythropoeitin - Market size and forecast 2023-2028 ($ billion)
- Chart on Erythropoeitin - Year-over-year growth 2023-2028 (%)
- Data Table on Erythropoeitin - Year-over-year growth 2023-2028 (%)
- 6.6 Clotting factors - Market size and forecast 2023-2028
- Chart on Clotting factors - Market size and forecast 2023-2028 ($ billion)
- Data Table on Clotting factors - Market size and forecast 2023-2028 ($ billion)
- Chart on Clotting factors - Year-over-year growth 2023-2028 (%)
- Data Table on Clotting factors - Year-over-year growth 2023-2028 (%)
- 6.7 Others - Market size and forecast 2023-2028
- Chart on Others - Market size and forecast 2023-2028 ($ billion)
- Data Table on Others - Market size and forecast 2023-2028 ($ billion)
- Chart on Others - Year-over-year growth 2023-2028 (%)
- Data Table on Others - Year-over-year growth 2023-2028 (%)
- 6.8 Market opportunity by Product
- Market opportunity by Product ($ billion)
- Data Table on Market opportunity by Product ($ billion)
7 Market Segmentation by Application
- 7.1 Market segments
- Chart on Application - Market share 2023-2028 (%)
- Data Table on Application - Market share 2023-2028 (%)
- 7.2 Comparison by Application
- Chart on Comparison by Application
- Data Table on Comparison by Application
- 7.3 Metabolic disorders - Market size and forecast 2023-2028
- Chart on Metabolic disorders - Market size and forecast 2023-2028 ($ billion)
- Data Table on Metabolic disorders - Market size and forecast 2023-2028 ($ billion)
- Chart on Metabolic disorders - Year-over-year growth 2023-2028 (%)
- Data Table on Metabolic disorders - Year-over-year growth 2023-2028 (%)
- 7.4 Immunologic disorders - Market size and forecast 2023-2028
- Chart on Immunologic disorders - Market size and forecast 2023-2028 ($ billion)
- Data Table on Immunologic disorders - Market size and forecast 2023-2028 ($ billion)
- Chart on Immunologic disorders - Year-over-year growth 2023-2028 (%)
- Data Table on Immunologic disorders - Year-over-year growth 2023-2028 (%)
- 7.5 Hematological disorders - Market size and forecast 2023-2028
- Chart on Hematological disorders - Market size and forecast 2023-2028 ($ billion)
- Data Table on Hematological disorders - Market size and forecast 2023-2028 ($ billion)
- Chart on Hematological disorders - Year-over-year growth 2023-2028 (%)
- Data Table on Hematological disorders - Year-over-year growth 2023-2028 (%)
- 7.6 Cancer - Market size and forecast 2023-2028
- Chart on Cancer - Market size and forecast 2023-2028 ($ billion)
- Data Table on Cancer - Market size and forecast 2023-2028 ($ billion)
- Chart on Cancer - Year-over-year growth 2023-2028 (%)
- Data Table on Cancer - Year-over-year growth 2023-2028 (%)
- 7.7 Genetic disorders - Market size and forecast 2023-2028
- Chart on Genetic disorders - Market size and forecast 2023-2028 ($ billion)
- Data Table on Genetic disorders - Market size and forecast 2023-2028 ($ billion)
- Chart on Genetic disorders - Year-over-year growth 2023-2028 (%)
- Data Table on Genetic disorders - Year-over-year growth 2023-2028 (%)
- 7.8 Market opportunity by Application
- Market opportunity by Application ($ billion)
- Data Table on Market opportunity by Application ($ billion)
8 Customer Landscape
- 8.1 Customer landscape overview
- Analysis of price sensitivity, lifecycle, customer purchase basket, adoption rates, and purchase criteria
9 Geographic Landscape
- 9.1 Geographic segmentation
- Chart on Market share by geography 2023-2028 (%)
- Data Table on Market share by geography 2023-2028 (%)
- 9.2 Geographic comparison
- Chart on Geographic comparison
- Data Table on Geographic comparison
- 9.3 North America - Market size and forecast 2023-2028
- Chart on North America - Market size and forecast 2023-2028 ($ billion)
- Data Table on North America - Market size and forecast 2023-2028 ($ billion)
- Chart on North America - Year-over-year growth 2023-2028 (%)
- Data Table on North America - Year-over-year growth 2023-2028 (%)
- 9.4 Europe - Market size and forecast 2023-2028
- Chart on Europe - Market size and forecast 2023-2028 ($ billion)
- Data Table on Europe - Market size and forecast 2023-2028 ($ billion)
- Chart on Europe - Year-over-year growth 2023-2028 (%)
- Data Table on Europe - Year-over-year growth 2023-2028 (%)
- 9.5 Asia - Market size and forecast 2023-2028
- Chart on Asia - Market size and forecast 2023-2028 ($ billion)
- Data Table on Asia - Market size and forecast 2023-2028 ($ billion)
- Chart on Asia - Year-over-year growth 2023-2028 (%)
- Data Table on Asia - Year-over-year growth 2023-2028 (%)
- 9.6 Rest of World (ROW) - Market size and forecast 2023-2028
- Chart on Rest of World (ROW) - Market size and forecast 2023-2028 ($ billion)
- Data Table on Rest of World (ROW) - Market size and forecast 2023-2028 ($ billion)
- Chart on Rest of World (ROW) - Year-over-year growth 2023-2028 (%)
- Data Table on Rest of World (ROW) - Year-over-year growth 2023-2028 (%)
- 9.7 US - Market size and forecast 2023-2028
- Chart on US - Market size and forecast 2023-2028 ($ billion)
- Data Table on US - Market size and forecast 2023-2028 ($ billion)
- Chart on US - Year-over-year growth 2023-2028 (%)
- Data Table on US - Year-over-year growth 2023-2028 (%)
- 9.8 Canada - Market size and forecast 2023-2028
- Chart on Canada - Market size and forecast 2023-2028 ($ billion)
- Data Table on Canada - Market size and forecast 2023-2028 ($ billion)
- Chart on Canada - Year-over-year growth 2023-2028 (%)
- Data Table on Canada - Year-over-year growth 2023-2028 (%)
- 9.9 Germany - Market size and forecast 2023-2028
- Chart on Germany - Market size and forecast 2023-2028 ($ billion)
- Data Table on Germany - Market size and forecast 2023-2028 ($ billion)
- Chart on Germany - Year-over-year growth 2023-2028 (%)
- Data Table on Germany - Year-over-year growth 2023-2028 (%)
- 9.10 UK - Market size and forecast 2023-2028
- Chart on UK - Market size and forecast 2023-2028 ($ billion)
- Data Table on UK - Market size and forecast 2023-2028 ($ billion)
- Chart on UK - Year-over-year growth 2023-2028 (%)
- Data Table on UK - Year-over-year growth 2023-2028 (%)
- 9.11 China - Market size and forecast 2023-2028
- Chart on China - Market size and forecast 2023-2028 ($ billion)
- Data Table on China - Market size and forecast 2023-2028 ($ billion)
- Chart on China - Year-over-year growth 2023-2028 (%)
- Data Table on China - Year-over-year growth 2023-2028 (%)
- 9.12 Market opportunity by geography
- Market opportunity by geography ($ billion)
- Data Tables on Market opportunity by geography ($ billion)
10 Drivers, Challenges, and Opportunity/Restraints
- 10.1 Market drivers
- 10.2 Market challenges
- 10.3 Impact of drivers and challenges
- Impact of drivers and challenges in 2023 and 2028
- 10.4 Market opportunities/restraints
11 Competitive Landscape
- 11.1 Overview
- 11.2 Competitive Landscape
- Overview on criticality of inputs and factors of differentiation
- 11.3 Landscape disruption
- Overview on factors of disruption
- 11.4 Industry risks
- Impact of key risks on business
12 Competitive Analysis
- 12.1 Companies profiled
- Companies covered
- 12.2 Market positioning of companies
- Matrix on companies position and classification
- 12.3 AbbVie Inc.
- AbbVie Inc. - Overview
- AbbVie Inc. - Product / Service
- AbbVie Inc. - Key news
- AbbVie Inc. - Key offerings
- 12.4 Amgen Inc.
- Amgen Inc. - Overview
- Amgen Inc. - Product / Service
- Amgen Inc. - Key offerings
- 12.5 AstraZeneca Plc
- AstraZeneca Plc - Overview
- AstraZeneca Plc - Product / Service
- AstraZeneca Plc - Key news
- AstraZeneca Plc - Key offerings
- 12.6 Biogen Inc.
- Biogen Inc. - Overview
- Biogen Inc. - Product / Service
- Biogen Inc. - Key news
- Biogen Inc. - Key offerings
- 12.7 Bristol Myers Squibb Co.
- Bristol Myers Squibb Co. - Overview
- Bristol Myers Squibb Co. - Product / Service
- Bristol Myers Squibb Co. - Key news
- Bristol Myers Squibb Co. - Key offerings
- 12.8 Creative Biolabs
- Creative Biolabs - Overview
- Creative Biolabs - Product / Service
- Creative Biolabs - Key offerings
- 12.9 Eli Lilly and Co.
- Eli Lilly and Co. - Overview
- Eli Lilly and Co. - Product / Service
- Eli Lilly and Co. - Key news
- Eli Lilly and Co. - Key offerings
- 12.10 F. Hoffmann La Roche Ltd.
- F. Hoffmann La Roche Ltd. - Overview
- F. Hoffmann La Roche Ltd. - Business segments
- F. Hoffmann La Roche Ltd. - Key news
- F. Hoffmann La Roche Ltd. - Key offerings
- F. Hoffmann La Roche Ltd. - Segment focus
- 12.11 Ipsen Pharma
- Ipsen Pharma - Overview
- Ipsen Pharma - Business segments
- Ipsen Pharma - Key offerings
- Ipsen Pharma - Segment focus
- 12.12 Johnson and Johnson Services Inc.
- Johnson and Johnson Services Inc. - Overview
- Johnson and Johnson Services Inc. - Business segments
- Johnson and Johnson Services Inc. - Key news
- Johnson and Johnson Services Inc. - Key offerings
- Johnson and Johnson Services Inc. - Segment focus
- 12.13 LGM Pharma LLC
- LGM Pharma LLC - Overview
- LGM Pharma LLC - Product / Service
- LGM Pharma LLC - Key offerings
- 12.14 Novartis AG
- Novartis AG - Overview
- Novartis AG - Business segments
- Novartis AG - Key news
- Novartis AG - Key offerings
- Novartis AG - Segment focus
- 12.15 Novo Nordisk AS
- Novo Nordisk AS - Overview
- Novo Nordisk AS - Business segments
- Novo Nordisk AS - Key offerings
- Novo Nordisk AS - Segment focus
- 12.16 Pfizer Inc.
- Pfizer Inc. - Overview
- Pfizer Inc. - Product / Service
- Pfizer Inc. - Key news
- Pfizer Inc. - Key offerings
- 12.17 Sanofi SA
- Sanofi SA - Overview
- Sanofi SA - Business segments
- Sanofi SA - Key news
- Sanofi SA - Key offerings
- Sanofi SA - Segment focus
13 Appendix
- 13.1 Scope of the report
- 13.2 Inclusions and exclusions checklist
- Inclusions checklist
- Exclusions checklist
- 13.3 Currency conversion rates for US$
- Currency conversion rates for US$
- 13.4 Research methodology
- Research methodology
- 13.5 Data procurement
- Information sources
- 13.6 Data validation
- Data validation
- 13.7 Validation techniques employed for market sizing
- Validation techniques employed for market sizing
- 13.8 Data synthesis
- Data synthesis
- 13.9 market analysis
- market analysis
- 13.10 List of abbreviations
- List of abbreviations

