|
|
市場調査レポート
商品コード
1788434
作物保険の世界市場、2025年~2029年Global Crop Insurance Market 2025-2029 |
||||||

|
|||||||
カスタマイズ可能
|
|||||||


| 作物保険の世界市場、2025年~2029年 |
|
出版日: 2025年08月02日
発行: TechNavio
ページ情報: 英文 218 Pages
納期: 即納可能
|

全表示
- 概要
- 図表
- 目次
作物保険市場は2024-2029年に156億2,000万米ドル、予測期間中のCAGRで6.3%の成長が予測されています。
当レポートでは、作物保険市場の全体的な分析、市場規模・予測、動向、成長促進要因、課題、約25のベンダーを網羅したベンダー分析などを掲載しています。
現在の市場シナリオ、最新動向と促進要因、市場環境全体に関する最新分析を提供しています。地球温暖化による異常気象、作物保険に対する政府支援の増加、作物保険製品ラインの拡大などが市場を牽引しています。
| 市場範囲 | |
|---|---|
| 基準年 | 2025 |
| 終了年 | 2029 |
| 予測期間 | 2025-2029 |
| 成長モメンタム | 加速 |
| 前年比 | 5.8% |
| CAGR | 6.3% |
| 増分額 | 156億2,000万米ドル |
本調査は、業界の主要参加者からのインプットを含め、一次情報と二次情報を客観的に組み合わせて実施しました。レポートには、主要企業の分析に加え、包括的な市場規模データ、地域別分析によるセグメント、ベンダー情勢が含まれています。レポートには過去データと予測データがあります。
本調査では、作物保険におけるデジタルイニシアチブは、今後数年間の作物保険市場の成長を促進する主要な理由の1つであると特定しています。また、作物保険分野での統合や気候インデックス保険の採用拡大も、市場の大きな需要につながるでしょう。
目次
第1章 エグゼクティブサマリー
- 市場概要
第2章 Technavio分析
- 価格・ライフサイクル・顧客購入バスケット・採用率・購入基準の分析
- インプットの重要性と差別化の要因
- 混乱の要因
- 促進要因と課題の影響
第3章 市場情勢
- 市場エコシステム
- 市場の特徴
- バリューチェーン分析
第4章 市場規模
- 市場の定義
- 市場セグメント分析
- 市場規模 2024
- 市場の見通し 2024-2029
第5章 市場規模実績
- 世界の作物保険市場 2019-2023
- 製品別セグメント分析 2019-2023
- タイプ別セグメント分析 2019-2023
- 流通チャネル別セグメント分析 2019-2023
- 地域別セグメント分析 2019-2023
- 国別セグメント分析 2019-2023
第6章 定性分析
- AIの影響:世界の作物保険市場
第7章 ファイブフォース分析
- ファイブフォースの要約
- 買い手の交渉力
- 供給企業の交渉力
- 新規参入業者の脅威
- 代替品の脅威
- 競争の脅威
- 市況
第8章 市場セグメンテーション:製品別
- 市場セグメント
- 比較:製品別
- 補償ベース:市場規模と予測 2024-2029
- インデックスベース:市場規模と予測 2024-2029
- 市場機会:製品別
第9章 市場セグメンテーション:タイプ別
- 市場セグメント
- 比較:タイプ別
- 農作物収量保険:市場規模と予測 2024-2029
- 農作物収入保険:市場規模と予測 2024-2029
- 市場機会:タイプ別
第10章 市場セグメンテーション:流通チャネル別
- 市場セグメント
- 比較:流通チャネル別
- 直接販売:市場規模と予測 2024-2029
- ブローカー:市場規模と予測 2024-2029
- バンカシュアランス:市場規模と予測 2024-2029
- 市場機会:流通チャネル別
第11章 顧客情勢
- 顧客情勢の概要
第12章 地域別情勢
- 地域別セグメンテーション
- 地域別比較
- 北米:市場規模と予測 2024-2029
- アジア太平洋:市場規模と予測 2024-2029
- 欧州:市場規模と予測 2024-2029
- 南米:市場規模と予測 2024-2029
- 中東・アフリカ:市場規模と予測 2024-2029
- 米国:市場規模と予測 2024-2029
- 中国:市場規模と予測 2024-2029
- インド:市場規模と予測 2024-2029
- ブラジル:市場規模と予測 2024-2029
- ドイツ:市場規模と予測 2024-2029
- フランス:市場規模と予測 2024-2029
- カナダ:市場規模と予測 2024-2029
- 日本:市場規模と予測 2024-2029
- アルゼンチン:市場規模と予測 2024-2029
- 英国:市場規模と予測 2024-2029
- 市場機会:地域情勢別
第13章 促進要因・課題・機会・抑制要因
- 市場促進要因
- 市場の課題
- 促進要因と課題の影響
- 市場の機会・抑制要因
第14章 競合情勢
- 概要
- 競合情勢
- 混乱の状況
- 業界のリスク
第15章 競合分析
- 企業プロファイル
- 企業ランキング指数
- 企業の市場ポジショニング
- Agriculture Insurance Co. of India Ltd.
- Allianz SE
- Aon plc
- AXA Group
- Bajaj Finserv Ltd.
- Chubb Ltd.
- Everest Group Ltd.
- Great American Insurance Co
- Hannover Re
- HDFC ERGO General Insurance Co Ltd
- ICICI Bank Ltd.
- Indian Farmers Fertiliser Cooperative Ltd.
- Munich Reinsurance Co.
- Reliance General Insurance
- State Bank of India
第16章 付録
Exhibits:
- Exhibits1: Executive Summary - Chart on Market Overview
- Exhibits2: Executive Summary - Data Table on Market Overview
- Exhibits3: Executive Summary - Chart on Global Market Characteristics
- Exhibits4: Executive Summary - Chart on Market By Geographical Landscape
- Exhibits5: Executive Summary - Chart on Market Segmentation by Product
- Exhibits6: Executive Summary - Chart on Market Segmentation by Type
- Exhibits7: Executive Summary - Chart on Market Segmentation by Distribution Channel
- Exhibits8: Executive Summary - Chart on Incremental Growth
- Exhibits9: Executive Summary - Data Table on Incremental Growth
- Exhibits10: Executive Summary - Chart on Company Market Positioning
- Exhibits11: Analysis of price sensitivity, lifecycle, customer purchase basket, adoption rates, and purchase criteria
- Exhibits12: Overview on criticality of inputs and factors of differentiation
- Exhibits13: Overview on factors of disruption
- Exhibits14: Impact of drivers and challenges in 2024 and 2029
- Exhibits15: Parent Market
- Exhibits16: Data Table on - Parent Market
- Exhibits17: Market characteristics analysis
- Exhibits18: Value chain analysis
- Exhibits19: Offerings of companies included in the market definition
- Exhibits20: Market segments
- Exhibits21: Chart on Global - Market size and forecast 2024-2029 ($ million)
- Exhibits22: Data Table on Global - Market size and forecast 2024-2029 ($ million)
- Exhibits23: Chart on Global Market: Year-over-year growth 2024-2029 (%)
- Exhibits24: Data Table on Global Market: Year-over-year growth 2024-2029 (%)
- Exhibits25: Historic Market Size - Data Table on Global Crop Insurance Market 2019 - 2023 ($ million)
- Exhibits26: Historic Market Size - Product Segment 2019 - 2023 ($ million)
- Exhibits27: Historic Market Size - Type Segment 2019 - 2023 ($ million)
- Exhibits28: Historic Market Size - Distribution Channel Segment 2019 - 2023 ($ million)
- Exhibits29: Historic Market Size - Geography Segment 2019 - 2023 ($ million)
- Exhibits30: Historic Market Size - Country Segment 2019 - 2023 ($ million)
- Exhibits31: Five forces analysis - Comparison between 2024 and 2029
- Exhibits32: Bargaining power of buyers - Impact of key factors 2024 and 2029
- Exhibits33: Bargaining power of suppliers - Impact of key factors in 2024 and 2029
- Exhibits34: Threat of new entrants - Impact of key factors in 2024 and 2029
- Exhibits35: Threat of substitutes - Impact of key factors in 2024 and 2029
- Exhibits36: Threat of rivalry - Impact of key factors in 2024 and 2029
- Exhibits37: Chart on Market condition - Five forces 2024 and 2029
- Exhibits38: Chart on Product - Market share 2024-2029 (%)
- Exhibits39: Data Table on Product - Market share 2024-2029 (%)
- Exhibits40: Chart on Comparison by Product
- Exhibits41: Data Table on Comparison by Product
- Exhibits42: Chart on Indemnity-based - Market size and forecast 2024-2029 ($ million)
- Exhibits43: Data Table on Indemnity-based - Market size and forecast 2024-2029 ($ million)
- Exhibits44: Chart on Indemnity-based - Year-over-year growth 2024-2029 (%)
- Exhibits45: Data Table on Indemnity-based - Year-over-year growth 2024-2029 (%)
- Exhibits46: Chart on Index-based - Market size and forecast 2024-2029 ($ million)
- Exhibits47: Data Table on Index-based - Market size and forecast 2024-2029 ($ million)
- Exhibits48: Chart on Index-based - Year-over-year growth 2024-2029 (%)
- Exhibits49: Data Table on Index-based - Year-over-year growth 2024-2029 (%)
- Exhibits50: Market opportunity by Product ($ million)
- Exhibits51: Data Table on Market opportunity by Product ($ million)
- Exhibits52: Chart on Type - Market share 2024-2029 (%)
- Exhibits53: Data Table on Type - Market share 2024-2029 (%)
- Exhibits54: Chart on Comparison by Type
- Exhibits55: Data Table on Comparison by Type
- Exhibits56: Chart on Crop yielded insurance - Market size and forecast 2024-2029 ($ million)
- Exhibits57: Data Table on Crop yielded insurance - Market size and forecast 2024-2029 ($ million)
- Exhibits58: Chart on Crop yielded insurance - Year-over-year growth 2024-2029 (%)
- Exhibits59: Data Table on Crop yielded insurance - Year-over-year growth 2024-2029 (%)
- Exhibits60: Chart on Crop revenue insurance - Market size and forecast 2024-2029 ($ million)
- Exhibits61: Data Table on Crop revenue insurance - Market size and forecast 2024-2029 ($ million)
- Exhibits62: Chart on Crop revenue insurance - Year-over-year growth 2024-2029 (%)
- Exhibits63: Data Table on Crop revenue insurance - Year-over-year growth 2024-2029 (%)
- Exhibits64: Market opportunity by Type ($ million)
- Exhibits65: Data Table on Market opportunity by Type ($ million)
- Exhibits66: Chart on Distribution Channel - Market share 2024-2029 (%)
- Exhibits67: Data Table on Distribution Channel - Market share 2024-2029 (%)
- Exhibits68: Chart on Comparison by Distribution Channel
- Exhibits69: Data Table on Comparison by Distribution Channel
- Exhibits70: Chart on Direct sales - Market size and forecast 2024-2029 ($ million)
- Exhibits71: Data Table on Direct sales - Market size and forecast 2024-2029 ($ million)
- Exhibits72: Chart on Direct sales - Year-over-year growth 2024-2029 (%)
- Exhibits73: Data Table on Direct sales - Year-over-year growth 2024-2029 (%)
- Exhibits74: Chart on Brokers - Market size and forecast 2024-2029 ($ million)
- Exhibits75: Data Table on Brokers - Market size and forecast 2024-2029 ($ million)
- Exhibits76: Chart on Brokers - Year-over-year growth 2024-2029 (%)
- Exhibits77: Data Table on Brokers - Year-over-year growth 2024-2029 (%)
- Exhibits78: Chart on Bancassurance - Market size and forecast 2024-2029 ($ million)
- Exhibits79: Data Table on Bancassurance - Market size and forecast 2024-2029 ($ million)
- Exhibits80: Chart on Bancassurance - Year-over-year growth 2024-2029 (%)
- Exhibits81: Data Table on Bancassurance - Year-over-year growth 2024-2029 (%)
- Exhibits82: Market opportunity by Distribution Channel ($ million)
- Exhibits83: Data Table on Market opportunity by Distribution Channel ($ million)
- Exhibits84: Analysis of price sensitivity, lifecycle, customer purchase basket, adoption rates, and purchase criteria
- Exhibits85: Chart on Market share By Geographical Landscape 2024-2029 (%)
- Exhibits86: Data Table on Market share By Geographical Landscape 2024-2029 (%)
- Exhibits87: Chart on Geographic comparison
- Exhibits88: Data Table on Geographic comparison
- Exhibits89: Chart on North America - Market size and forecast 2024-2029 ($ million)
- Exhibits90: Data Table on North America - Market size and forecast 2024-2029 ($ million)
- Exhibits91: Chart on North America - Year-over-year growth 2024-2029 (%)
- Exhibits92: Data Table on North America - Year-over-year growth 2024-2029 (%)
- Exhibits93: Chart on APAC - Market size and forecast 2024-2029 ($ million)
- Exhibits94: Data Table on APAC - Market size and forecast 2024-2029 ($ million)
- Exhibits95: Chart on APAC - Year-over-year growth 2024-2029 (%)
- Exhibits96: Data Table on APAC - Year-over-year growth 2024-2029 (%)
- Exhibits97: Chart on Europe - Market size and forecast 2024-2029 ($ million)
- Exhibits98: Data Table on Europe - Market size and forecast 2024-2029 ($ million)
- Exhibits99: Chart on Europe - Year-over-year growth 2024-2029 (%)
- Exhibits100: Data Table on Europe - Year-over-year growth 2024-2029 (%)
- Exhibits101: Chart on South America - Market size and forecast 2024-2029 ($ million)
- Exhibits102: Data Table on South America - Market size and forecast 2024-2029 ($ million)
- Exhibits103: Chart on South America - Year-over-year growth 2024-2029 (%)
- Exhibits104: Data Table on South America - Year-over-year growth 2024-2029 (%)
- Exhibits105: Chart on Middle East and Africa - Market size and forecast 2024-2029 ($ million)
- Exhibits106: Data Table on Middle East and Africa - Market size and forecast 2024-2029 ($ million)
- Exhibits107: Chart on Middle East and Africa - Year-over-year growth 2024-2029 (%)
- Exhibits108: Data Table on Middle East and Africa - Year-over-year growth 2024-2029 (%)
- Exhibits109: Chart on US - Market size and forecast 2024-2029 ($ million)
- Exhibits110: Data Table on US - Market size and forecast 2024-2029 ($ million)
- Exhibits111: Chart on US - Year-over-year growth 2024-2029 (%)
- Exhibits112: Data Table on US - Year-over-year growth 2024-2029 (%)
- Exhibits113: Chart on China - Market size and forecast 2024-2029 ($ million)
- Exhibits114: Data Table on China - Market size and forecast 2024-2029 ($ million)
- Exhibits115: Chart on China - Year-over-year growth 2024-2029 (%)
- Exhibits116: Data Table on China - Year-over-year growth 2024-2029 (%)
- Exhibits117: Chart on India - Market size and forecast 2024-2029 ($ million)
- Exhibits118: Data Table on India - Market size and forecast 2024-2029 ($ million)
- Exhibits119: Chart on India - Year-over-year growth 2024-2029 (%)
- Exhibits120: Data Table on India - Year-over-year growth 2024-2029 (%)
- Exhibits121: Chart on Brazil - Market size and forecast 2024-2029 ($ million)
- Exhibits122: Data Table on Brazil - Market size and forecast 2024-2029 ($ million)
- Exhibits123: Chart on Brazil - Year-over-year growth 2024-2029 (%)
- Exhibits124: Data Table on Brazil - Year-over-year growth 2024-2029 (%)
- Exhibits125: Chart on Germany - Market size and forecast 2024-2029 ($ million)
- Exhibits126: Data Table on Germany - Market size and forecast 2024-2029 ($ million)
- Exhibits127: Chart on Germany - Year-over-year growth 2024-2029 (%)
- Exhibits128: Data Table on Germany - Year-over-year growth 2024-2029 (%)
- Exhibits129: Chart on France - Market size and forecast 2024-2029 ($ million)
- Exhibits130: Data Table on France - Market size and forecast 2024-2029 ($ million)
- Exhibits131: Chart on France - Year-over-year growth 2024-2029 (%)
- Exhibits132: Data Table on France - Year-over-year growth 2024-2029 (%)
- Exhibits133: Chart on Canada - Market size and forecast 2024-2029 ($ million)
- Exhibits134: Data Table on Canada - Market size and forecast 2024-2029 ($ million)
- Exhibits135: Chart on Canada - Year-over-year growth 2024-2029 (%)
- Exhibits136: Data Table on Canada - Year-over-year growth 2024-2029 (%)
- Exhibits137: Chart on Japan - Market size and forecast 2024-2029 ($ million)
- Exhibits138: Data Table on Japan - Market size and forecast 2024-2029 ($ million)
- Exhibits139: Chart on Japan - Year-over-year growth 2024-2029 (%)
- Exhibits140: Data Table on Japan - Year-over-year growth 2024-2029 (%)
- Exhibits141: Chart on Argentina - Market size and forecast 2024-2029 ($ million)
- Exhibits142: Data Table on Argentina - Market size and forecast 2024-2029 ($ million)
- Exhibits143: Chart on Argentina - Year-over-year growth 2024-2029 (%)
- Exhibits144: Data Table on Argentina - Year-over-year growth 2024-2029 (%)
- Exhibits145: Chart on UK - Market size and forecast 2024-2029 ($ million)
- Exhibits146: Data Table on UK - Market size and forecast 2024-2029 ($ million)
- Exhibits147: Chart on UK - Year-over-year growth 2024-2029 (%)
- Exhibits148: Data Table on UK - Year-over-year growth 2024-2029 (%)
- Exhibits149: Market opportunity By Geographical Landscape ($ million)
- Exhibits150: Data Tables on Market opportunity By Geographical Landscape ($ million)
- Exhibits151: Impact of drivers and challenges in 2024 and 2029
- Exhibits152: Overview on criticality of inputs and factors of differentiation
- Exhibits153: Overview on factors of disruption
- Exhibits154: Impact of key risks on business
- Exhibits155: Companies covered
- Exhibits156: Company ranking index
- Exhibits157: Matrix on companies position and classification
- Exhibits158: Agriculture Insurance Co. of India Ltd. - Overview
- Exhibits159: Agriculture Insurance Co. of India Ltd. - Product / Service
- Exhibits160: Agriculture Insurance Co. of India Ltd. - Key offerings
- Exhibits161: SWOT
- Exhibits162: Allianz SE - Overview
- Exhibits163: Allianz SE - Business segments
- Exhibits164: Allianz SE - Key news
- Exhibits165: Allianz SE - Key offerings
- Exhibits166: Allianz SE - Segment focus
- Exhibits167: SWOT
- Exhibits168: Aon plc - Overview
- Exhibits169: Aon plc - Business segments
- Exhibits170: Aon plc - Key news
- Exhibits171: Aon plc - Key offerings
- Exhibits172: Aon plc - Segment focus
- Exhibits173: SWOT
- Exhibits174: AXA Group - Overview
- Exhibits175: AXA Group - Business segments
- Exhibits176: AXA Group - Key news
- Exhibits177: AXA Group - Key offerings
- Exhibits178: AXA Group - Segment focus
- Exhibits179: SWOT
- Exhibits180: Bajaj Finserv Ltd. - Overview
- Exhibits181: Bajaj Finserv Ltd. - Business segments
- Exhibits182: Bajaj Finserv Ltd. - Key offerings
- Exhibits183: Bajaj Finserv Ltd. - Segment focus
- Exhibits184: SWOT
- Exhibits185: Chubb Ltd. - Overview
- Exhibits186: Chubb Ltd. - Business segments
- Exhibits187: Chubb Ltd. - Key news
- Exhibits188: Chubb Ltd. - Key offerings
- Exhibits189: Chubb Ltd. - Segment focus
- Exhibits190: SWOT
- Exhibits191: Everest Group Ltd. - Overview
- Exhibits192: Everest Group Ltd. - Business segments
- Exhibits193: Everest Group Ltd. - Key offerings
- Exhibits194: Everest Group Ltd. - Segment focus
- Exhibits195: SWOT
- Exhibits196: Great American Insurance Co - Overview
- Exhibits197: Great American Insurance Co - Product / Service
- Exhibits198: Great American Insurance Co - Key offerings
- Exhibits199: SWOT
- Exhibits200: Hannover Re - Overview
- Exhibits201: Hannover Re - Product / Service
- Exhibits202: Hannover Re - Key offerings
- Exhibits203: SWOT
- Exhibits204: HDFC ERGO General Insurance Co Ltd - Overview
- Exhibits205: HDFC ERGO General Insurance Co Ltd - Product / Service
- Exhibits206: HDFC ERGO General Insurance Co Ltd - Key offerings
- Exhibits207: SWOT
- Exhibits208: ICICI Bank Ltd. - Overview
- Exhibits209: ICICI Bank Ltd. - Business segments
- Exhibits210: ICICI Bank Ltd. - Key offerings
- Exhibits211: ICICI Bank Ltd. - Segment focus
- Exhibits212: SWOT
- Exhibits213: Indian Farmers Fertiliser Cooperative Ltd. - Overview
- Exhibits214: Indian Farmers Fertiliser Cooperative Ltd. - Product / Service
- Exhibits215: Indian Farmers Fertiliser Cooperative Ltd. - Key offerings
- Exhibits216: SWOT
- Exhibits217: Munich Reinsurance Co. - Overview
- Exhibits218: Munich Reinsurance Co. - Business segments
- Exhibits219: Munich Reinsurance Co. - Key news
- Exhibits220: Munich Reinsurance Co. - Key offerings
- Exhibits221: Munich Reinsurance Co. - Segment focus
- Exhibits222: SWOT
- Exhibits223: Reliance General Insurance - Overview
- Exhibits224: Reliance General Insurance - Product / Service
- Exhibits225: Reliance General Insurance - Key offerings
- Exhibits226: SWOT
- Exhibits227: State Bank of India - Overview
- Exhibits228: State Bank of India - Business segments
- Exhibits229: State Bank of India - Key offerings
- Exhibits230: State Bank of India - Segment focus
- Exhibits231: SWOT
- Exhibits232: Inclusions checklist
- Exhibits233: Exclusions checklist
- Exhibits234: Currency conversion rates for US$
- Exhibits235: Research methodology
- Exhibits236: Information sources
- Exhibits237: Data validation
- Exhibits238: Validation techniques employed for market sizing
- Exhibits239: Data synthesis
- Exhibits240: 360 degree market analysis
- Exhibits241: List of abbreviations
The crop insurance market is forecasted to grow by USD 15.62 bn during 2024-2029, accelerating at a CAGR of 6.3% during the forecast period. The report on the crop insurance market provides a holistic analysis, market size and forecast, trends, growth drivers, and challenges, as well as vendor analysis covering around 25 vendors.
The report offers an up-to-date analysis regarding the current market scenario, the latest trends and drivers, and the overall market environment. The market is driven by extreme weather conditions due to global warming, rise in government support for crop insurance, and expansion of crop insurance product lines.
| Market Scope | |
|---|---|
| Base Year | 2025 |
| End Year | 2029 |
| Series Year | 2025-2029 |
| Growth Momentum | Accelerate |
| YOY 2025 | 5.8% |
| CAGR | 6.3% |
| Incremental Value | $15.62 bn |
The study was conducted using an objective combination of primary and secondary information including inputs from key participants in the industry. The report contains a comprehensive market size data, segment with regional analysis and vendor landscape in addition to an analysis of the key companies. Reports have historic and forecast data.
Technavio's crop insurance market is segmented as below:
By Product
- Indemnity-based
- Index-based
By Type
- Crop yielded insurance
- Crop revenue insurance
By Distribution Channel
- Direct sales
- Brokers
- Bancassurance
By Geographical Landscape
- North America
- APAC
- Europe
- South America
- Middle East and Africa
This study identifies the digital initiatives in crop insurance as one of the prime reasons driving the crop insurance market growth during the next few years. Also, consolidation in the crop insurance sector and growing adoption of climate index insurance will lead to sizable demand in the market.
The report on the crop insurance market covers the following areas:
- Crop Insurance Market sizing
- Crop Insurance Market forecast
- Crop Insurance Market industry analysis
The robust vendor analysis is designed to help clients improve their market position, and in line with this, this report provides a detailed analysis of several leading crop insurance market vendors that include Agriculture Insurance Co. of India Ltd., Allianz SE, Aon plc, AXA Group, Bajaj Finserv Ltd., Chubb Ltd., Everest Group Ltd., Great American Insurance Co, Hannover Re, HDFC ERGO General Insurance Co Ltd, ICICI Bank Ltd., Indian Farmers Fertiliser Cooperative Ltd., MARSH LLC, Munich Reinsurance Co., QBE Insurance Group Ltd., Reliance General Insurance, Sompo Holdings Inc., State Bank of India, Swiss Re Ltd., and Willis Towers Watson Public Ltd. Co.. Also, the crop insurance market analysis report includes information on upcoming trends and challenges that will influence market growth. This is to help companies strategize and leverage all forthcoming growth opportunities.
The publisher presents a detailed picture of the market by the way of study, synthesis, and summation of data from multiple sources by an analysis of key parameters such as profit, pricing, competition, and promotions. It presents various market facets by identifying the key industry influencers. The data presented is comprehensive, reliable, and a result of extensive primary and secondary research. The market research reports provide a complete competitive landscape and an in-depth vendor selection methodology and analysis using qualitative and quantitative research to forecast accurate market growth.
Table of Contents
1 Executive Summary
- 1.1 Market overview
- Executive Summary - Chart on Market Overview
- Executive Summary - Data Table on Market Overview
- Executive Summary - Chart on Global Market Characteristics
- Executive Summary - Chart on Market By Geographical Landscape
- Executive Summary - Chart on Market Segmentation by Product
- Executive Summary - Chart on Market Segmentation by Type
- Executive Summary - Chart on Market Segmentation by Distribution Channel
- Executive Summary - Chart on Incremental Growth
- Executive Summary - Data Table on Incremental Growth
- Executive Summary - Chart on Company Market Positioning
2 Technavio Analysis
- 2.1 Analysis of price sensitivity, lifecycle, customer purchase basket, adoption rates, and purchase criteria
- Analysis of price sensitivity, lifecycle, customer purchase basket, adoption rates, and purchase criteria
- 2.2 Criticality of inputs and Factors of differentiation
- Overview on criticality of inputs and factors of differentiation
- 2.3 Factors of disruption
- Overview on factors of disruption
- 2.4 Impact of drivers and challenges
- Impact of drivers and challenges in 2024 and 2029
3 Market Landscape
- 3.1 Market ecosystem
- Parent Market
- Data Table on - Parent Market
- 3.2 Market characteristics
- Market characteristics analysis
- 3.3 Value chain analysis
- Value chain analysis
4 Market Sizing
- 4.1 Market definition
- Offerings of companies included in the market definition
- 4.2 Market segment analysis
- Market segments
- 4.3 Market size 2024
- 4.4 Market outlook: Forecast for 2024-2029
- Chart on Global - Market size and forecast 2024-2029 ($ million)
- Data Table on Global - Market size and forecast 2024-2029 ($ million)
- Chart on Global Market: Year-over-year growth 2024-2029 (%)
- Data Table on Global Market: Year-over-year growth 2024-2029 (%)
5 Historic Market Size
- 5.1 Global Crop Insurance Market 2019 - 2023
- Historic Market Size - Data Table on Global Crop Insurance Market 2019 - 2023 ($ million)
- 5.2 Product segment analysis 2019 - 2023
- Historic Market Size - Product Segment 2019 - 2023 ($ million)
- 5.3 Type segment analysis 2019 - 2023
- Historic Market Size - Type Segment 2019 - 2023 ($ million)
- 5.4 Distribution Channel segment analysis 2019 - 2023
- Historic Market Size - Distribution Channel Segment 2019 - 2023 ($ million)
- 5.5 Geography segment analysis 2019 - 2023
- Historic Market Size - Geography Segment 2019 - 2023 ($ million)
- 5.6 Country segment analysis 2019 - 2023
- Historic Market Size - Country Segment 2019 - 2023 ($ million)
6 Qualitative Analysis
- 6.1 The AI impact on Global Crop Insurance Market
7 Five Forces Analysis
- 7.1 Five forces summary
- Five forces analysis - Comparison between 2024 and 2029
- 7.2 Bargaining power of buyers
- Bargaining power of buyers - Impact of key factors 2024 and 2029
- 7.3 Bargaining power of suppliers
- Bargaining power of suppliers - Impact of key factors in 2024 and 2029
- 7.4 Threat of new entrants
- Threat of new entrants - Impact of key factors in 2024 and 2029
- 7.5 Threat of substitutes
- Threat of substitutes - Impact of key factors in 2024 and 2029
- 7.6 Threat of rivalry
- Threat of rivalry - Impact of key factors in 2024 and 2029
- 7.7 Market condition
- Chart on Market condition - Five forces 2024 and 2029
8 Market Segmentation by Product
- 8.1 Market segments
- Chart on Product - Market share 2024-2029 (%)
- Data Table on Product - Market share 2024-2029 (%)
- 8.2 Comparison by Product
- Chart on Comparison by Product
- Data Table on Comparison by Product
- 8.3 Indemnity-based - Market size and forecast 2024-2029
- Chart on Indemnity-based - Market size and forecast 2024-2029 ($ million)
- Data Table on Indemnity-based - Market size and forecast 2024-2029 ($ million)
- Chart on Indemnity-based - Year-over-year growth 2024-2029 (%)
- Data Table on Indemnity-based - Year-over-year growth 2024-2029 (%)
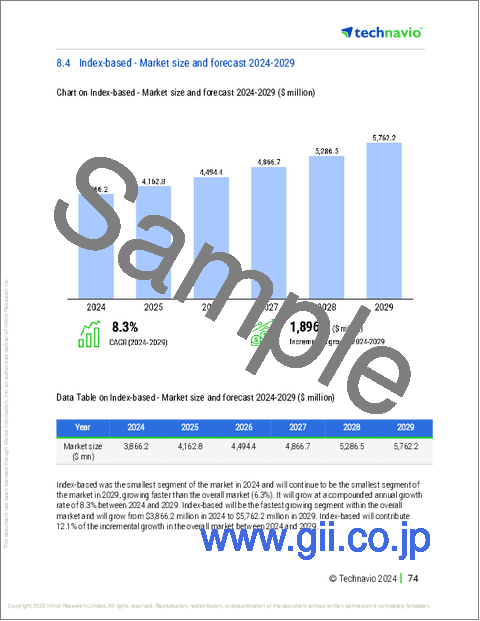
- 8.4 Index-based - Market size and forecast 2024-2029
- Chart on Index-based - Market size and forecast 2024-2029 ($ million)
- Data Table on Index-based - Market size and forecast 2024-2029 ($ million)
- Chart on Index-based - Year-over-year growth 2024-2029 (%)
- Data Table on Index-based - Year-over-year growth 2024-2029 (%)
- 8.5 Market opportunity by Product
- Market opportunity by Product ($ million)
- Data Table on Market opportunity by Product ($ million)
9 Market Segmentation by Type
- 9.1 Market segments
- Chart on Type - Market share 2024-2029 (%)
- Data Table on Type - Market share 2024-2029 (%)
- 9.2 Comparison by Type
- Chart on Comparison by Type
- Data Table on Comparison by Type
- 9.3 Crop yielded insurance - Market size and forecast 2024-2029
- Chart on Crop yielded insurance - Market size and forecast 2024-2029 ($ million)
- Data Table on Crop yielded insurance - Market size and forecast 2024-2029 ($ million)
- Chart on Crop yielded insurance - Year-over-year growth 2024-2029 (%)
- Data Table on Crop yielded insurance - Year-over-year growth 2024-2029 (%)
- 9.4 Crop revenue insurance - Market size and forecast 2024-2029
- Chart on Crop revenue insurance - Market size and forecast 2024-2029 ($ million)
- Data Table on Crop revenue insurance - Market size and forecast 2024-2029 ($ million)
- Chart on Crop revenue insurance - Year-over-year growth 2024-2029 (%)
- Data Table on Crop revenue insurance - Year-over-year growth 2024-2029 (%)
- 9.5 Market opportunity by Type
- Market opportunity by Type ($ million)
- Data Table on Market opportunity by Type ($ million)
10 Market Segmentation by Distribution Channel
- 10.1 Market segments
- Chart on Distribution Channel - Market share 2024-2029 (%)
- Data Table on Distribution Channel - Market share 2024-2029 (%)
- 10.2 Comparison by Distribution Channel
- Chart on Comparison by Distribution Channel
- Data Table on Comparison by Distribution Channel
- 10.3 Direct sales - Market size and forecast 2024-2029
- Chart on Direct sales - Market size and forecast 2024-2029 ($ million)
- Data Table on Direct sales - Market size and forecast 2024-2029 ($ million)
- Chart on Direct sales - Year-over-year growth 2024-2029 (%)
- Data Table on Direct sales - Year-over-year growth 2024-2029 (%)
- 10.4 Brokers - Market size and forecast 2024-2029
- Chart on Brokers - Market size and forecast 2024-2029 ($ million)
- Data Table on Brokers - Market size and forecast 2024-2029 ($ million)
- Chart on Brokers - Year-over-year growth 2024-2029 (%)
- Data Table on Brokers - Year-over-year growth 2024-2029 (%)
- 10.5 Bancassurance - Market size and forecast 2024-2029
- Chart on Bancassurance - Market size and forecast 2024-2029 ($ million)
- Data Table on Bancassurance - Market size and forecast 2024-2029 ($ million)
- Chart on Bancassurance - Year-over-year growth 2024-2029 (%)
- Data Table on Bancassurance - Year-over-year growth 2024-2029 (%)
- 10.6 Market opportunity by Distribution Channel
- Market opportunity by Distribution Channel ($ million)
- Data Table on Market opportunity by Distribution Channel ($ million)
11 Customer Landscape
- 11.1 Customer landscape overview
- Analysis of price sensitivity, lifecycle, customer purchase basket, adoption rates, and purchase criteria
12 Geographic Landscape
- 12.1 Geographic segmentation
- Chart on Market share By Geographical Landscape 2024-2029 (%)
- Data Table on Market share By Geographical Landscape 2024-2029 (%)
- 12.2 Geographic comparison
- Chart on Geographic comparison
- Data Table on Geographic comparison
- 12.3 North America - Market size and forecast 2024-2029
- Chart on North America - Market size and forecast 2024-2029 ($ million)
- Data Table on North America - Market size and forecast 2024-2029 ($ million)
- Chart on North America - Year-over-year growth 2024-2029 (%)
- Data Table on North America - Year-over-year growth 2024-2029 (%)
- 12.4 APAC - Market size and forecast 2024-2029
- Chart on APAC - Market size and forecast 2024-2029 ($ million)
- Data Table on APAC - Market size and forecast 2024-2029 ($ million)
- Chart on APAC - Year-over-year growth 2024-2029 (%)
- Data Table on APAC - Year-over-year growth 2024-2029 (%)
- 12.5 Europe - Market size and forecast 2024-2029
- Chart on Europe - Market size and forecast 2024-2029 ($ million)
- Data Table on Europe - Market size and forecast 2024-2029 ($ million)
- Chart on Europe - Year-over-year growth 2024-2029 (%)
- Data Table on Europe - Year-over-year growth 2024-2029 (%)
- 12.6 South America - Market size and forecast 2024-2029
- Chart on South America - Market size and forecast 2024-2029 ($ million)
- Data Table on South America - Market size and forecast 2024-2029 ($ million)
- Chart on South America - Year-over-year growth 2024-2029 (%)
- Data Table on South America - Year-over-year growth 2024-2029 (%)
- 12.7 Middle East and Africa - Market size and forecast 2024-2029
- Chart on Middle East and Africa - Market size and forecast 2024-2029 ($ million)
- Data Table on Middle East and Africa - Market size and forecast 2024-2029 ($ million)
- Chart on Middle East and Africa - Year-over-year growth 2024-2029 (%)
- Data Table on Middle East and Africa - Year-over-year growth 2024-2029 (%)
- 12.8 US - Market size and forecast 2024-2029
- Chart on US - Market size and forecast 2024-2029 ($ million)
- Data Table on US - Market size and forecast 2024-2029 ($ million)
- Chart on US - Year-over-year growth 2024-2029 (%)
- Data Table on US - Year-over-year growth 2024-2029 (%)
- 12.9 China - Market size and forecast 2024-2029
- Chart on China - Market size and forecast 2024-2029 ($ million)
- Data Table on China - Market size and forecast 2024-2029 ($ million)
- Chart on China - Year-over-year growth 2024-2029 (%)
- Data Table on China - Year-over-year growth 2024-2029 (%)
- 12.10 India - Market size and forecast 2024-2029
- Chart on India - Market size and forecast 2024-2029 ($ million)
- Data Table on India - Market size and forecast 2024-2029 ($ million)
- Chart on India - Year-over-year growth 2024-2029 (%)
- Data Table on India - Year-over-year growth 2024-2029 (%)
- 12.11 Brazil - Market size and forecast 2024-2029
- Chart on Brazil - Market size and forecast 2024-2029 ($ million)
- Data Table on Brazil - Market size and forecast 2024-2029 ($ million)
- Chart on Brazil - Year-over-year growth 2024-2029 (%)
- Data Table on Brazil - Year-over-year growth 2024-2029 (%)
- 12.12 Germany - Market size and forecast 2024-2029
- Chart on Germany - Market size and forecast 2024-2029 ($ million)
- Data Table on Germany - Market size and forecast 2024-2029 ($ million)
- Chart on Germany - Year-over-year growth 2024-2029 (%)
- Data Table on Germany - Year-over-year growth 2024-2029 (%)
- 12.13 France - Market size and forecast 2024-2029
- Chart on France - Market size and forecast 2024-2029 ($ million)
- Data Table on France - Market size and forecast 2024-2029 ($ million)
- Chart on France - Year-over-year growth 2024-2029 (%)
- Data Table on France - Year-over-year growth 2024-2029 (%)
- 12.14 Canada - Market size and forecast 2024-2029
- Chart on Canada - Market size and forecast 2024-2029 ($ million)
- Data Table on Canada - Market size and forecast 2024-2029 ($ million)
- Chart on Canada - Year-over-year growth 2024-2029 (%)
- Data Table on Canada - Year-over-year growth 2024-2029 (%)
- 12.15 Japan - Market size and forecast 2024-2029
- Chart on Japan - Market size and forecast 2024-2029 ($ million)
- Data Table on Japan - Market size and forecast 2024-2029 ($ million)
- Chart on Japan - Year-over-year growth 2024-2029 (%)
- Data Table on Japan - Year-over-year growth 2024-2029 (%)
- 12.16 Argentina - Market size and forecast 2024-2029
- Chart on Argentina - Market size and forecast 2024-2029 ($ million)
- Data Table on Argentina - Market size and forecast 2024-2029 ($ million)
- Chart on Argentina - Year-over-year growth 2024-2029 (%)
- Data Table on Argentina - Year-over-year growth 2024-2029 (%)
- 12.17 UK - Market size and forecast 2024-2029
- Chart on UK - Market size and forecast 2024-2029 ($ million)
- Data Table on UK - Market size and forecast 2024-2029 ($ million)
- Chart on UK - Year-over-year growth 2024-2029 (%)
- Data Table on UK - Year-over-year growth 2024-2029 (%)
- 12.18 Market opportunity By Geographical Landscape
- Market opportunity By Geographical Landscape ($ million)
- Data Tables on Market opportunity By Geographical Landscape ($ million)
13 Drivers, Challenges, and Opportunity/Restraints
- 13.1 Market drivers
- 13.2 Market challenges
- 13.3 Impact of drivers and challenges
- Impact of drivers and challenges in 2024 and 2029
- 13.4 Market opportunities/restraints
14 Competitive Landscape
- 14.1 Overview
- 14.2 Competitive Landscape
- Overview on criticality of inputs and factors of differentiation
- 14.3 Landscape disruption
- Overview on factors of disruption
- 14.4 Industry risks
- Impact of key risks on business
15 Competitive Analysis
- 15.1 Companies profiled
- Companies covered
- 15.2 Company ranking index
- Company ranking index
- 15.3 Market positioning of companies
- Matrix on companies position and classification
- 15.4 Agriculture Insurance Co. of India Ltd.
- Agriculture Insurance Co. of India Ltd. - Overview
- Agriculture Insurance Co. of India Ltd. - Product / Service
- Agriculture Insurance Co. of India Ltd. - Key offerings
- SWOT
- 15.5 Allianz SE
- Allianz SE - Overview
- Allianz SE - Business segments
- Allianz SE - Key news
- Allianz SE - Key offerings
- Allianz SE - Segment focus
- SWOT
- 15.6 Aon plc
- Aon plc - Overview
- Aon plc - Business segments
- Aon plc - Key news
- Aon plc - Key offerings
- Aon plc - Segment focus
- SWOT
- 15.7 AXA Group
- AXA Group - Overview
- AXA Group - Business segments
- AXA Group - Key news
- AXA Group - Key offerings
- AXA Group - Segment focus
- SWOT
- 15.8 Bajaj Finserv Ltd.
- Bajaj Finserv Ltd. - Overview
- Bajaj Finserv Ltd. - Business segments
- Bajaj Finserv Ltd. - Key offerings
- Bajaj Finserv Ltd. - Segment focus
- SWOT
- 15.9 Chubb Ltd.
- Chubb Ltd. - Overview
- Chubb Ltd. - Business segments
- Chubb Ltd. - Key news
- Chubb Ltd. - Key offerings
- Chubb Ltd. - Segment focus
- SWOT
- 15.10 Everest Group Ltd.
- Everest Group Ltd. - Overview
- Everest Group Ltd. - Business segments
- Everest Group Ltd. - Key offerings
- Everest Group Ltd. - Segment focus
- SWOT
- 15.11 Great American Insurance Co
- Great American Insurance Co - Overview
- Great American Insurance Co - Product / Service
- Great American Insurance Co - Key offerings
- SWOT
- 15.12 Hannover Re
- Hannover Re - Overview
- Hannover Re - Product / Service
- Hannover Re - Key offerings
- SWOT
- 15.13 HDFC ERGO General Insurance Co Ltd
- HDFC ERGO General Insurance Co Ltd - Overview
- HDFC ERGO General Insurance Co Ltd - Product / Service
- HDFC ERGO General Insurance Co Ltd - Key offerings
- SWOT
- 15.14 ICICI Bank Ltd.
- ICICI Bank Ltd. - Overview
- ICICI Bank Ltd. - Business segments
- ICICI Bank Ltd. - Key offerings
- ICICI Bank Ltd. - Segment focus
- SWOT
- 15.15 Indian Farmers Fertiliser Cooperative Ltd.
- Indian Farmers Fertiliser Cooperative Ltd. - Overview
- Indian Farmers Fertiliser Cooperative Ltd. - Product / Service
- Indian Farmers Fertiliser Cooperative Ltd. - Key offerings
- SWOT
- 15.16 Munich Reinsurance Co.
- Munich Reinsurance Co. - Overview
- Munich Reinsurance Co. - Business segments
- Munich Reinsurance Co. - Key news
- Munich Reinsurance Co. - Key offerings
- Munich Reinsurance Co. - Segment focus
- SWOT
- 15.17 Reliance General Insurance
- Reliance General Insurance - Overview
- Reliance General Insurance - Product / Service
- Reliance General Insurance - Key offerings
- SWOT
- 15.18 State Bank of India
- State Bank of India - Overview
- State Bank of India - Business segments
- State Bank of India - Key offerings
- State Bank of India - Segment focus
- SWOT
16 Appendix
- 16.1 Scope of the report
- 16.2 Inclusions and exclusions checklist
- Inclusions checklist
- Exclusions checklist
- 16.3 Currency conversion rates for US$
- Currency conversion rates for US$
- 16.4 Research methodology
- Research methodology
- 16.5 Data procurement
- Information sources
- 16.6 Data validation
- Data validation
- 16.7 Validation techniques employed for market sizing
- Validation techniques employed for market sizing
- 16.8 Data synthesis
- Data synthesis
- 16.9 360 degree market analysis
- 360 degree market analysis
- 16.10 List of abbreviations
- List of abbreviations

