|
|
市場調査レポート
商品コード
1652813
トートバッグの世界市場(2025年~2029年)Global Tote Bags Market 2025-2029 |
||||||

|
|||||||
カスタマイズ可能
|
|||||||


| トートバッグの世界市場(2025年~2029年) |
|
出版日: 2025年01月23日
発行: TechNavio
ページ情報: 英文 204 Pages
納期: 即納可能
|

全表示
- 概要
- 目次
世界のトートバッグの市場規模は、2024年~2029年に98億1,550万米ドルに達し、予測期間中のCAGRは6.8%で成長すると予測されています。
この調査レポートは、トートバッグ市場の全体分析、市場規模・予測、動向、成長促進要因、課題、約25のベンダーを網羅したベンダー分析などを掲載しています。
当レポートは、現在の市場シナリオ、最新動向と促進要因、市場環境全体に関する最新分析を提供しています。市場は、高級品のパーソナライゼーションとカスタマイズ化、マーケティングキャンペーン、有名人の推薦、ブランド促進活動の増加、消費者のファッション意識と個人消費財への支出の増加によって牽引されています。
| 市場範囲 | |
|---|---|
| 基準年 | 2025年 |
| 終了年 | 2029年 |
| 予測期間 | 2025年~2029年 |
| 成長モメンタム | 加速 |
| 前年比2025年 | 6.2% |
| CAGR | 6.8% |
| 増分額 | 98億1,550万米ドル |
本調査では、今後数年間のトートバッグ市場の成長を促進する主な理由の一つとして、空港の小売店における需要の増加を挙げています。また、手頃な価格の高級トートバッグへの嗜好の高まりや、さまざまなレザータイプの採用は、市場の大きな需要につながります。
目次
第1章 エグゼクティブサマリー
- 市場概要
第2章 Technavioの分析
- 価格感度・ライフサイクル・顧客購入バスケット・採用率・購入基準の分析
- インプットの重要性と差別化の要因
- ディスラプションの要因
- 促進要因と課題の影響
第3章 市場情勢
- 市場エコシステム
- 市場の特徴
- バリューチェーン分析
第4章 市場規模
- 市場の定義
- 市場セグメント分析
- 市場規模(2024年)
- 市場の見通し(2024年~2029年)
第5章 市場規模実績
- トートバッグの世界市場(2019年~2023年)
- 流通チャネルセグメント分析(2019年~2023年)
- 材料セグメント分析(2019年~2023年)
- 地域セグメント分析(2019年~2023年)
- 国セグメント分析(2019年~2023年)
第6章 定性分析
- AIの影響:トートバッグの世界市場
第7章 ファイブフォース分析
- ファイブフォースの要約
- 買い手の交渉力
- 供給企業の交渉力
- 新規参入業者の脅威
- 代替品の脅威
- 競争の脅威
- 市況
第8章 市場セグメンテーション:流通チャネル別
- 市場セグメント
- 比較:流通チャネル別
- オフライン:市場規模と予測(2024年~2029年)
- オンライン:市場規模と予測(2024年~2029年)
- 市場機会:流通チャネル別
第9章 市場セグメンテーション:材料別
- 市場セグメント
- 比較:材料別
- コットン:市場規模と予測(2024年~2029年)
- レザー:市場規模と予測(2024年~2029年)
- その他:市場規模と予測(2024年~2029年)
- 市場機会:材料別
第10章 顧客情勢
- 顧客情勢の概要
第11章 地域別情勢
- 地域別セグメンテーション
- 地域別比較
- 欧州:市場規模と予測(2024年~2029年)
- アジア太平洋:市場規模と予測(2024年~2029年)
- 北米:市場規模と予測(2024年~2029年)
- 中東・アフリカ:市場規模と予測(2024年~2029年)
- 南米:市場規模と予測(2024年~2029年)
- 米国:市場規模と予測(2024年~2029年)
- 中国:市場規模と予測(2024年~2029年)
- フランス:市場規模と予測(2024年~2029年)
- 英国:市場規模と予測(2024年~2029年)
- ドイツ:市場規模と予測(2024年~2029年)
- 日本:市場規模と予測(2024年~2029年)
- インド:市場規模と予測(2024年~2029年)
- カナダ:市場規模と予測(2024年~2029年)
- 韓国:市場規模と予測(2024年~2029年)
- イタリア:市場規模と予測(2024年~2029年)
- 市場機会:地域情勢別
第12章 促進要因・課題・機会・抑制要因
- 市場促進要因
- 市場の課題
- 促進要因と課題の影響
- 市場の機会・抑制要因
第13章 競合情勢
- 概要
- 競合情勢
- ディスラプションの状況
- 業界のリスク
第14章 競合分析
- 企業プロファイル
- 企業ランキング指数
- 企業の市場ポジショニング
- Burberry Group Plc
- Capri Holdings Ltd.
- Chanel Ltd.
- Dolce and Gabbana S.r.l.
- Giorgio Armani SpA
- Hermes International SA
- Kering SA
- LVMH Moet Hennessy Louis Vuitton SE
- Mulberry Group Plc
- Prada S.p.A
- PVH Corp.
- Ralph Lauren Corp.
- Samsonite International SA
- Tapestry Inc.
- VF Corp.
第15章 付録
The tote bags market is forecasted to grow by $ 9815.5 mn during 2024-2029, accelerating at a CAGR of 6.8% during the forecast period. The report on the tote bags market provides a holistic analysis, market size and forecast, trends, growth drivers, and challenges, as well as vendor analysis covering around 25 vendors.
The report offers an up-to-date analysis regarding the current market scenario, the latest trends and drivers, and the overall market environment. The market is driven by personalization and customization of luxury tote bags, increasing marketing campaigns, celebrity endorsement, and brand promotion activities, and increased consumer fashion consciousness and spending on personal goods.
| Market Scope | |
|---|---|
| Base Year | 2025 |
| End Year | 2029 |
| Series Year | 2025-2029 |
| Growth Momentum | Accelerate |
| YOY 2025 | 6.2% |
| CAGR | 6.8% |
| Incremental Value | $9815.5 mn |
Technavio's tote bags market is segmented as below:
By Distribution Channel
- Offline
- Online
By Material
- Cotton
- Leather
- Others
By Geographical Landscape
- Europe
- APAC
- North America
- Middle East and Africa
- South America
This study identifies the increased demand at airport retail stores as one of the prime reasons driving the tote bags market growth during the next few years. Also, growing preference for affordable luxury tote bags and introduction of different leather varieties will lead to sizable demand in the market.
The report on the tote bags market covers the following areas:
- Tote Bags Market sizing
- Tote Bags Market forecast
- Tote Bags Market industry analysis
The robust vendor analysis is designed to help clients improve their market position, and in line with this, this report provides a detailed analysis of several leading tote bags market vendors that include Burberry Group Plc, Capri Holdings Ltd., Chanel Ltd., Dolce and Gabbana S.r.l., Double R Bags, Giorgio Armani SpA, Hermes International SA, Kering SA, Lavie, LVMH Moet Hennessy Louis Vuitton SE, Mulberry Group Plc, Prada S.p.A, PVH Corp., Ralph Lauren Corp., Ronak Industries, Samsonite International SA, Tapestry Inc., Targus Inc., Tods Spa, and VF Corp.. Also, the tote bags market analysis report includes information on upcoming trends and challenges that will influence market growth. This is to help companies strategize and leverage all forthcoming growth opportunities.
The study was conducted using an objective combination of primary and secondary information including inputs from key participants in the industry. The report contains a comprehensive market and vendor landscape in addition to an analysis of the key vendors.
The publisher presents a detailed picture of the market by the way of study, synthesis, and summation of data from multiple sources by an analysis of key parameters such as profit, pricing, competition, and promotions. It presents various market facets by identifying the key industry influencers. The data presented is comprehensive, reliable, and a result of extensive primary and secondary research. The market research reports provide a complete competitive landscape and an in-depth vendor selection methodology and analysis using qualitative and quantitative research to forecast accurate market growth.
Table of Contents
1 Executive Summary
- 1.1 Market overview
- Executive Summary - Chart on Market Overview
- Executive Summary - Data Table on Market Overview
- Executive Summary - Chart on Global Market Characteristics
- Executive Summary - Chart on Market By Geographical Landscape
- Executive Summary - Chart on Market Segmentation by Distribution Channel
- Executive Summary - Chart on Market Segmentation by Material
- Executive Summary - Chart on Incremental Growth
- Executive Summary - Data Table on Incremental Growth
- Executive Summary - Chart on Company Market Positioning
2 Technavio Analysis
- 2.1 Analysis of price sensitivity, lifecycle, customer purchase basket, adoption rates, and purchase criteria
- Analysis of price sensitivity, lifecycle, customer purchase basket, adoption rates, and purchase criteria
- 2.2 Criticality of inputs and Factors of differentiation
- Overview on criticality of inputs and factors of differentiation
- 2.3 Factors of disruption
- Overview on factors of disruption
- 2.4 Impact of drivers and challenges
- Impact of drivers and challenges in 2024 and 2029
3 Market Landscape
- 3.1 Market ecosystem
- Parent Market
- Data Table on - Parent Market
- 3.2 Market characteristics
- Market characteristics analysis
- 3.3 Value chain analysis
- Value chain analysis
4 Market Sizing
- 4.1 Market definition
- Offerings of companies included in the market definition
- 4.2 Market segment analysis
- Market segments
- 4.3 Market size 2024
- 4.4 Market outlook: Forecast for 2024-2029
- Chart on Global - Market size and forecast 2024-2029 ($ million)
- Data Table on Global - Market size and forecast 2024-2029 ($ million)
- Chart on Global Market: Year-over-year growth 2024-2029 (%)
- Data Table on Global Market: Year-over-year growth 2024-2029 (%)
5 Historic Market Size
- 5.1 Global Tote Bags Market 2019 - 2023
- Historic Market Size - Data Table on Global Tote Bags Market 2019 - 2023 ($ million)
- 5.2 Distribution Channel segment analysis 2019 - 2023
- Historic Market Size - Distribution Channel Segment 2019 - 2023 ($ million)
- 5.3 Material segment analysis 2019 - 2023
- Historic Market Size - Material Segment 2019 - 2023 ($ million)
- 5.4 Geography segment analysis 2019 - 2023
- Historic Market Size - Geography Segment 2019 - 2023 ($ million)
- 5.5 Country segment analysis 2019 - 2023
- Historic Market Size - Country Segment 2019 - 2023 ($ million)
6 Qualitative Analysis
- 6.1 Impact of AI in the global tote bags market
7 Five Forces Analysis
- 7.1 Five forces summary
- Five forces analysis - Comparison between 2024 and 2029
- 7.2 Bargaining power of buyers
- Bargaining power of buyers - Impact of key factors 2024 and 2029
- 7.3 Bargaining power of suppliers
- Bargaining power of suppliers - Impact of key factors in 2024 and 2029
- 7.4 Threat of new entrants
- Threat of new entrants - Impact of key factors in 2024 and 2029
- 7.5 Threat of substitutes
- Threat of substitutes - Impact of key factors in 2024 and 2029
- 7.6 Threat of rivalry
- Threat of rivalry - Impact of key factors in 2024 and 2029
- 7.7 Market condition
- Chart on Market condition - Five forces 2024 and 2029
8 Market Segmentation by Distribution Channel
- 8.1 Market segments
- Chart on Distribution Channel - Market share 2024-2029 (%)
- Data Table on Distribution Channel - Market share 2024-2029 (%)
- 8.2 Comparison by Distribution Channel
- Chart on Comparison by Distribution Channel
- Data Table on Comparison by Distribution Channel
- 8.3 Offline - Market size and forecast 2024-2029
- Chart on Offline - Market size and forecast 2024-2029 ($ million)
- Data Table on Offline - Market size and forecast 2024-2029 ($ million)
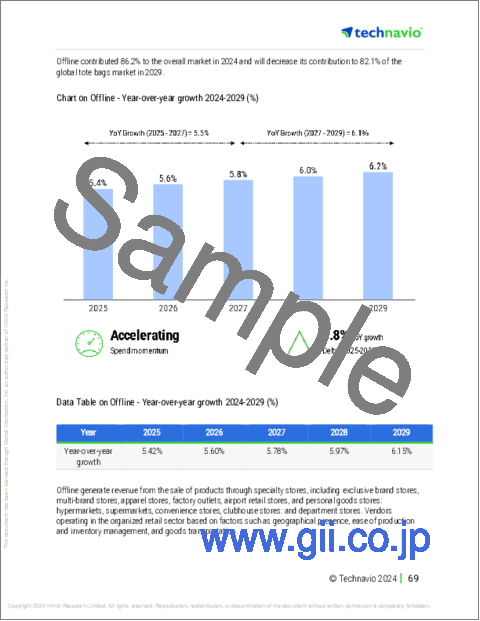
- Chart on Offline - Year-over-year growth 2024-2029 (%)
- Data Table on Offline - Year-over-year growth 2024-2029 (%)
- 8.4 Online - Market size and forecast 2024-2029
- Chart on Online - Market size and forecast 2024-2029 ($ million)
- Data Table on Online - Market size and forecast 2024-2029 ($ million)
- Chart on Online - Year-over-year growth 2024-2029 (%)
- Data Table on Online - Year-over-year growth 2024-2029 (%)
- 8.5 Market opportunity by Distribution Channel
- Market opportunity by Distribution Channel ($ million)
- Data Table on Market opportunity by Distribution Channel ($ million)
9 Market Segmentation by Material
- 9.1 Market segments
- Chart on Material - Market share 2024-2029 (%)
- Data Table on Material - Market share 2024-2029 (%)
- 9.2 Comparison by Material
- Chart on Comparison by Material
- Data Table on Comparison by Material
- 9.3 Cotton - Market size and forecast 2024-2029
- Chart on Cotton - Market size and forecast 2024-2029 ($ million)
- Data Table on Cotton - Market size and forecast 2024-2029 ($ million)
- Chart on Cotton - Year-over-year growth 2024-2029 (%)
- Data Table on Cotton - Year-over-year growth 2024-2029 (%)
- 9.4 Leather - Market size and forecast 2024-2029
- Chart on Leather - Market size and forecast 2024-2029 ($ million)
- Data Table on Leather - Market size and forecast 2024-2029 ($ million)
- Chart on Leather - Year-over-year growth 2024-2029 (%)
- Data Table on Leather - Year-over-year growth 2024-2029 (%)
- 9.5 Others - Market size and forecast 2024-2029
- Chart on Others - Market size and forecast 2024-2029 ($ million)
- Data Table on Others - Market size and forecast 2024-2029 ($ million)
- Chart on Others - Year-over-year growth 2024-2029 (%)
- Data Table on Others - Year-over-year growth 2024-2029 (%)
- 9.6 Market opportunity by Material
- Market opportunity by Material ($ million)
- Data Table on Market opportunity by Material ($ million)
10 Customer Landscape
- 10.1 Customer landscape overview
- Analysis of price sensitivity, lifecycle, customer purchase basket, adoption rates, and purchase criteria
11 Geographic Landscape
- 11.1 Geographic segmentation
- Chart on Market share By Geographical Landscape 2024-2029 (%)
- Data Table on Market share By Geographical Landscape 2024-2029 (%)
- 11.2 Geographic comparison
- Chart on Geographic comparison
- Data Table on Geographic comparison
- 11.3 Europe - Market size and forecast 2024-2029
- Chart on Europe - Market size and forecast 2024-2029 ($ million)
- Data Table on Europe - Market size and forecast 2024-2029 ($ million)
- Chart on Europe - Year-over-year growth 2024-2029 (%)
- Data Table on Europe - Year-over-year growth 2024-2029 (%)
- 11.4 APAC - Market size and forecast 2024-2029
- Chart on APAC - Market size and forecast 2024-2029 ($ million)
- Data Table on APAC - Market size and forecast 2024-2029 ($ million)
- Chart on APAC - Year-over-year growth 2024-2029 (%)
- Data Table on APAC - Year-over-year growth 2024-2029 (%)
- 11.5 North America - Market size and forecast 2024-2029
- Chart on North America - Market size and forecast 2024-2029 ($ million)
- Data Table on North America - Market size and forecast 2024-2029 ($ million)
- Chart on North America - Year-over-year growth 2024-2029 (%)
- Data Table on North America - Year-over-year growth 2024-2029 (%)
- 11.6 Middle East and Africa - Market size and forecast 2024-2029
- Chart on Middle East and Africa - Market size and forecast 2024-2029 ($ million)
- Data Table on Middle East and Africa - Market size and forecast 2024-2029 ($ million)
- Chart on Middle East and Africa - Year-over-year growth 2024-2029 (%)
- Data Table on Middle East and Africa - Year-over-year growth 2024-2029 (%)
- 11.7 South America - Market size and forecast 2024-2029
- Chart on South America - Market size and forecast 2024-2029 ($ million)
- Data Table on South America - Market size and forecast 2024-2029 ($ million)
- Chart on South America - Year-over-year growth 2024-2029 (%)
- Data Table on South America - Year-over-year growth 2024-2029 (%)
- 11.8 US - Market size and forecast 2024-2029
- Chart on US - Market size and forecast 2024-2029 ($ million)
- Data Table on US - Market size and forecast 2024-2029 ($ million)
- Chart on US - Year-over-year growth 2024-2029 (%)
- Data Table on US - Year-over-year growth 2024-2029 (%)
- 11.9 China - Market size and forecast 2024-2029
- Chart on China - Market size and forecast 2024-2029 ($ million)
- Data Table on China - Market size and forecast 2024-2029 ($ million)
- Chart on China - Year-over-year growth 2024-2029 (%)
- Data Table on China - Year-over-year growth 2024-2029 (%)
- 11.10 France - Market size and forecast 2024-2029
- Chart on France - Market size and forecast 2024-2029 ($ million)
- Data Table on France - Market size and forecast 2024-2029 ($ million)
- Chart on France - Year-over-year growth 2024-2029 (%)
- Data Table on France - Year-over-year growth 2024-2029 (%)
- 11.11 UK - Market size and forecast 2024-2029
- Chart on UK - Market size and forecast 2024-2029 ($ million)
- Data Table on UK - Market size and forecast 2024-2029 ($ million)
- Chart on UK - Year-over-year growth 2024-2029 (%)
- Data Table on UK - Year-over-year growth 2024-2029 (%)
- 11.12 Germany - Market size and forecast 2024-2029
- Chart on Germany - Market size and forecast 2024-2029 ($ million)
- Data Table on Germany - Market size and forecast 2024-2029 ($ million)
- Chart on Germany - Year-over-year growth 2024-2029 (%)
- Data Table on Germany - Year-over-year growth 2024-2029 (%)
- 11.13 Japan - Market size and forecast 2024-2029
- Chart on Japan - Market size and forecast 2024-2029 ($ million)
- Data Table on Japan - Market size and forecast 2024-2029 ($ million)
- Chart on Japan - Year-over-year growth 2024-2029 (%)
- Data Table on Japan - Year-over-year growth 2024-2029 (%)
- 11.14 India - Market size and forecast 2024-2029
- Chart on India - Market size and forecast 2024-2029 ($ million)
- Data Table on India - Market size and forecast 2024-2029 ($ million)
- Chart on India - Year-over-year growth 2024-2029 (%)
- Data Table on India - Year-over-year growth 2024-2029 (%)
- 11.15 Canada - Market size and forecast 2024-2029
- Chart on Canada - Market size and forecast 2024-2029 ($ million)
- Data Table on Canada - Market size and forecast 2024-2029 ($ million)
- Chart on Canada - Year-over-year growth 2024-2029 (%)
- Data Table on Canada - Year-over-year growth 2024-2029 (%)
- 11.16 South Korea - Market size and forecast 2024-2029
- Chart on South Korea - Market size and forecast 2024-2029 ($ million)
- Data Table on South Korea - Market size and forecast 2024-2029 ($ million)
- Chart on South Korea - Year-over-year growth 2024-2029 (%)
- Data Table on South Korea - Year-over-year growth 2024-2029 (%)
- 11.17 Italy - Market size and forecast 2024-2029
- Chart on Italy - Market size and forecast 2024-2029 ($ million)
- Data Table on Italy - Market size and forecast 2024-2029 ($ million)
- Chart on Italy - Year-over-year growth 2024-2029 (%)
- Data Table on Italy - Year-over-year growth 2024-2029 (%)
- 11.18 Market opportunity By Geographical Landscape
- Market opportunity By Geographical Landscape ($ million)
- Data Tables on Market opportunity By Geographical Landscape ($ million)
12 Drivers, Challenges, and Opportunity/Restraints
- 12.1 Market drivers
- 12.2 Market challenges
- 12.3 Impact of drivers and challenges
- Impact of drivers and challenges in 2024 and 2029
- 12.4 Market opportunities/restraints
13 Competitive Landscape
- 13.1 Overview
- 13.2 Competitive Landscape
- Overview on criticality of inputs and factors of differentiation
- 13.3 Landscape disruption
- Overview on factors of disruption
- 13.4 Industry risks
- Impact of key risks on business
14 Competitive Analysis
- 14.1 Companies profiled
- Companies covered
- 14.2 Company ranking index
- Company ranking index
- 14.3 Market positioning of companies
- Matrix on companies position and classification
- 14.4 Burberry Group Plc
- Burberry Group Plc - Overview
- Burberry Group Plc - Business segments
- Burberry Group Plc - Key offerings
- Burberry Group Plc - Segment focus
- SWOT
- 14.5 Capri Holdings Ltd.
- Capri Holdings Ltd. - Overview
- Capri Holdings Ltd. - Business segments
- Capri Holdings Ltd. - Key offerings
- Capri Holdings Ltd. - Segment focus
- SWOT
- 14.6 Chanel Ltd.
- Chanel Ltd. - Overview
- Chanel Ltd. - Product / Service
- Chanel Ltd. - Key offerings
- SWOT
- 14.7 Dolce and Gabbana S.r.l.
- Dolce and Gabbana S.r.l. - Overview
- Dolce and Gabbana S.r.l. - Product / Service
- Dolce and Gabbana S.r.l. - Key offerings
- SWOT
- 14.8 Giorgio Armani SpA
- Giorgio Armani SpA - Overview
- Giorgio Armani SpA - Product / Service
- Giorgio Armani SpA - Key offerings
- SWOT
- 14.9 Hermes International SA
- Hermes International SA - Overview
- Hermes International SA - Business segments
- Hermes International SA - Key news
- Hermes International SA - Key offerings
- Hermes International SA - Segment focus
- SWOT
- 14.10 Kering SA
- Kering SA - Overview
- Kering SA - Business segments
- Kering SA - Key news
- Kering SA - Key offerings
- Kering SA - Segment focus
- SWOT
- 14.11 LVMH Moet Hennessy Louis Vuitton SE
- LVMH Moet Hennessy Louis Vuitton SE - Overview
- LVMH Moet Hennessy Louis Vuitton SE - Business segments
- LVMH Moet Hennessy Louis Vuitton SE - Key news
- LVMH Moet Hennessy Louis Vuitton SE - Key offerings
- LVMH Moet Hennessy Louis Vuitton SE - Segment focus
- SWOT
- 14.12 Mulberry Group Plc
- Mulberry Group Plc - Overview
- Mulberry Group Plc - Business segments
- Mulberry Group Plc - Key offerings
- Mulberry Group Plc - Segment focus
- SWOT
- 14.13 Prada S.p.A
- Prada S.p.A - Overview
- Prada S.p.A - Product / Service
- Prada S.p.A - Key offerings
- SWOT
- 14.14 PVH Corp.
- PVH Corp. - Overview
- PVH Corp. - Business segments
- PVH Corp. - Key offerings
- PVH Corp. - Segment focus
- SWOT
- 14.15 Ralph Lauren Corp.
- Ralph Lauren Corp. - Overview
- Ralph Lauren Corp. - Business segments
- Ralph Lauren Corp. - Key news
- Ralph Lauren Corp. - Key offerings
- Ralph Lauren Corp. - Segment focus
- SWOT
- 14.16 Samsonite International SA
- Samsonite International SA - Overview
- Samsonite International SA - Business segments
- Samsonite International SA - Key offerings
- Samsonite International SA - Segment focus
- SWOT
- 14.17 Tapestry Inc.
- Tapestry Inc. - Overview
- Tapestry Inc. - Business segments
- Tapestry Inc. - Key news
- Tapestry Inc. - Key offerings
- Tapestry Inc. - Segment focus
- SWOT
- 14.18 VF Corp.
- VF Corp. - Overview
- VF Corp. - Business segments
- VF Corp. - Key news
- VF Corp. - Key offerings
- VF Corp. - Segment focus
- SWOT
15 Appendix
- 15.1 Scope of the report
- 15.2 Inclusions and exclusions checklist
- Inclusions checklist
- Exclusions checklist
- 15.3 Currency conversion rates for US$
- Currency conversion rates for US$
- 15.4 Research methodology
- Research methodology
- 15.5 Data procurement
- Information sources
- 15.6 Data validation
- Data validation
- 15.7 Validation techniques employed for market sizing
- Validation techniques employed for market sizing
- 15.8 Data synthesis
- Data synthesis
- 15.9 360 degree market analysis
- 360 degree market analysis
- 15.10 List of abbreviations
- List of abbreviations

