|
|
市場調査レポート
商品コード
1557731
列車用バッテリーの世界市場 2024-2028Global Train Battery Market 2024-2028 |
||||||

|
|||||||
カスタマイズ可能
|
|||||||

| 列車用バッテリーの世界市場 2024-2028 |
|
出版日: 2024年08月13日
発行: TechNavio
ページ情報: 英文 162 Pages
納期: 即納可能
|

全表示
- 概要
- 図表
- 目次
列車用バッテリー市場は2023-2028年に1億8,550万米ドル、予測期間中のCAGRは5.4%で成長すると予測されます。
当レポートでは、列車用バッテリー市場の全体的な分析、市場規模・予測、動向、成長促進要因、課題、約25のベンダーを網羅したベンダー分析などを掲載しています。
現在の市場シナリオ、最新動向と促進要因、市場環境全体に関する最新分析を提供しています。市場は、高速鉄道や自律走行鉄道の導入の増加、鉄道市場開発への予算配分の増加、公害による持続可能な代替手段の増加などが牽引しています。
| 市場範囲 | |
|---|---|
| 基準年 | 2024 |
| 終了年 | 2028 |
| 予測期間 | 2024-2028 |
| 成長モメンタム | 加速 |
| 前年比2024年 | 5.12% |
| CAGR | 5.4% |
| 増分額 | 1億8,550万米ドル |
本調査では、今後数年間の列車用バッテリー市場成長を牽引する主要因の1つとして、効率化を推進するIoTとビッグデータを挙げています。また、鉄道業界における統合の進展と自動車用バッテリー技術の進歩は、市場の大きな需要につながります。
目次
第1章 エグゼクティブサマリー
- 市場概要
第2章 市場情勢
- 市場エコシステム
- 市場の特徴
- バリューチェーン分析
第3章 市場規模の評価
- 市場の定義
- 市場セグメント分析
- 市場規模 2023
- 市場の見通し 2023-2028
第4章 市場規模実績
- 列車用バッテリーの世界市場 2018-2022
- 用途別セグメント分析 2018-2022
- バッテリータイプ別セグメント分析 2018-2022
- 地域別セグメント分析 2018-2022
- 国別セグメント分析 2018-2022
第5章 ファイブフォース分析
- ファイブフォースの要約
- 買い手の交渉力
- 供給企業の交渉力
- 新規参入業者の脅威
- 代替品の脅威
- 競争の脅威
- 市況
第6章 市場セグメンテーション:用途別
- 市場セグメンテーション
- 比較:用途別
- 補助バッテリー:市場規模と予測 2023-2028
- スターターバッテリー:市場規模と予測 2023-2028
- 市場機会:用途別
第7章 市場セグメンテーション:バッテリータイプ別
- 市場セグメンテーション
- 比較:バッテリータイプ別
- 鉛蓄電池:市場規模と予測 2023-2028
- リチウムイオン:市場規模と予測 2023-2028
- ニッケルカドミウム:市場規模と予測 2023-2028
- 市場機会:バッテリータイプ別
第8章 顧客情勢
- 顧客情勢の概要
第9章 地域別情勢
- 地域別セグメンテーション
- 地域別比較
- 欧州:市場規模と予測 2023-2028
- アジア太平洋:市場規模と予測 2023-2028
- 北米:市場規模と予測 2023-2028
- 南米:市場規模と予測 2023-2028
- 中東・アフリカ:市場規模と予測 2023-2028
- 米国:市場規模と予測 2023-2028
- 中国:市場規模と予測 2023-2028
- ドイツ:市場規模と予測 2023-2028
- 英国:市場規模と予測 2023-2028
- 日本:市場規模と予測 2023-2028
- 市場機会:地域別
第10章 促進要因・課題・機会・抑制要因
- 市場促進要因
- 市場の課題
- 促進要因と課題の影響
- 市場の機会・抑制要因
第11章 競合情勢
- 概要
- 競合情勢
- 混乱の状況
- 業界のリスク
第12章 競合分析
- 企業プロファイル
- 企業の市場ポジショニング
- Accumulatorenwerke HOPPECKE Carl Zoellner and Sohn GmbH
- AEG Power Solutions BV
- Amara Raja Group
- East Penn Manufacturing Co. Inc.
- EnerSys
- Exide Industries Ltd.
- Furukawa Electric Co. Ltd.
- GS Yuasa International Ltd.
- Hitachi Ltd.
- JFM Engineering Inc.
- Leclanche SA
- Saft Groupe SAS
- Stryten Energy LLC
- Toshiba Corp.
- Wisdom Industrial Power Co. Ltd.
第13章 付録
Exhibits:
- Exhibits1: Executive Summary - Chart on Market Overview
- Exhibits2: Executive Summary - Data Table on Market Overview
- Exhibits3: Executive Summary - Chart on Global Market Characteristics
- Exhibits4: Executive Summary - Chart on Market by Geography
- Exhibits5: Executive Summary - Chart on Market Segmentation by Application
- Exhibits6: Executive Summary - Chart on Market Segmentation by Battery Type
- Exhibits7: Executive Summary - Chart on Incremental Growth
- Exhibits8: Executive Summary - Data Table on Incremental Growth
- Exhibits9: Executive Summary - Chart on Company Market Positioning
- Exhibits10: Parent Market
- Exhibits11: Data Table on - Parent Market
- Exhibits12: Market characteristics analysis
- Exhibits13: Value Chain Analysis
- Exhibits14: Offerings of companies included in the market definition
- Exhibits15: Market segments
- Exhibits16: Chart on Global - Market size and forecast 2023-2028 ($ million)
- Exhibits17: Data Table on Global - Market size and forecast 2023-2028 ($ million)
- Exhibits18: Chart on Global Market: Year-over-year growth 2023-2028 (%)
- Exhibits19: Data Table on Global Market: Year-over-year growth 2023-2028 (%)
- Exhibits20: Historic Market Size - Data Table on Global Train Battery Market 2018 - 2022 ($ million)
- Exhibits21: Historic Market Size - Application Segment 2018 - 2022 ($ million)
- Exhibits22: Historic Market Size - Battery Type Segment 2018 - 2022 ($ million)
- Exhibits23: Historic Market Size - Geography Segment 2018 - 2022 ($ million)
- Exhibits24: Historic Market Size - Country Segment 2018 - 2022 ($ million)
- Exhibits25: Five forces analysis - Comparison between 2023 and 2028
- Exhibits26: Bargaining power of buyers - Impact of key factors 2023 and 2028
- Exhibits27: Bargaining power of suppliers - Impact of key factors in 2023 and 2028
- Exhibits28: Threat of new entrants - Impact of key factors in 2023 and 2028
- Exhibits29: Threat of substitutes - Impact of key factors in 2023 and 2028
- Exhibits30: Threat of rivalry - Impact of key factors in 2023 and 2028
- Exhibits31: Chart on Market condition - Five forces 2023 and 2028
- Exhibits32: Chart on Application - Market share 2023-2028 (%)
- Exhibits33: Data Table on Application - Market share 2023-2028 (%)
- Exhibits34: Chart on Comparison by Application
- Exhibits35: Data Table on Comparison by Application
- Exhibits36: Chart on Auxiliary battery - Market size and forecast 2023-2028 ($ million)
- Exhibits37: Data Table on Auxiliary battery - Market size and forecast 2023-2028 ($ million)
- Exhibits38: Chart on Auxiliary battery - Year-over-year growth 2023-2028 (%)
- Exhibits39: Data Table on Auxiliary battery - Year-over-year growth 2023-2028 (%)
- Exhibits40: Chart on Starter battery - Market size and forecast 2023-2028 ($ million)
- Exhibits41: Data Table on Starter battery - Market size and forecast 2023-2028 ($ million)
- Exhibits42: Chart on Starter battery - Year-over-year growth 2023-2028 (%)
- Exhibits43: Data Table on Starter battery - Year-over-year growth 2023-2028 (%)
- Exhibits44: Market opportunity by Application ($ million)
- Exhibits45: Data Table on Market opportunity by Application ($ million)
- Exhibits46: Chart on Battery Type - Market share 2023-2028 (%)
- Exhibits47: Data Table on Battery Type - Market share 2023-2028 (%)
- Exhibits48: Chart on Comparison by Battery Type
- Exhibits49: Data Table on Comparison by Battery Type
- Exhibits50: Chart on Lead-acid - Market size and forecast 2023-2028 ($ million)
- Exhibits51: Data Table on Lead-acid - Market size and forecast 2023-2028 ($ million)
- Exhibits52: Chart on Lead-acid - Year-over-year growth 2023-2028 (%)
- Exhibits53: Data Table on Lead-acid - Year-over-year growth 2023-2028 (%)
- Exhibits54: Chart on Lithium-ion - Market size and forecast 2023-2028 ($ million)
- Exhibits55: Data Table on Lithium-ion - Market size and forecast 2023-2028 ($ million)
- Exhibits56: Chart on Lithium-ion - Year-over-year growth 2023-2028 (%)
- Exhibits57: Data Table on Lithium-ion - Year-over-year growth 2023-2028 (%)
- Exhibits58: Chart on Nickel cadmium - Market size and forecast 2023-2028 ($ million)
- Exhibits59: Data Table on Nickel cadmium - Market size and forecast 2023-2028 ($ million)
- Exhibits60: Chart on Nickel cadmium - Year-over-year growth 2023-2028 (%)
- Exhibits61: Data Table on Nickel cadmium - Year-over-year growth 2023-2028 (%)
- Exhibits62: Market opportunity by Battery Type ($ million)
- Exhibits63: Data Table on Market opportunity by Battery Type ($ million)
- Exhibits64: Analysis of price sensitivity, lifecycle, customer purchase basket, adoption rates, and purchase criteria
- Exhibits65: Chart on Market share by geography 2023-2028 (%)
- Exhibits66: Data Table on Market share by geography 2023-2028 (%)
- Exhibits67: Chart on Geographic comparison
- Exhibits68: Data Table on Geographic comparison
- Exhibits69: Chart on Europe - Market size and forecast 2023-2028 ($ million)
- Exhibits70: Data Table on Europe - Market size and forecast 2023-2028 ($ million)
- Exhibits71: Chart on Europe - Year-over-year growth 2023-2028 (%)
- Exhibits72: Data Table on Europe - Year-over-year growth 2023-2028 (%)
- Exhibits73: Chart on APAC - Market size and forecast 2023-2028 ($ million)
- Exhibits74: Data Table on APAC - Market size and forecast 2023-2028 ($ million)
- Exhibits75: Chart on APAC - Year-over-year growth 2023-2028 (%)
- Exhibits76: Data Table on APAC - Year-over-year growth 2023-2028 (%)
- Exhibits77: Chart on North America - Market size and forecast 2023-2028 ($ million)
- Exhibits78: Data Table on North America - Market size and forecast 2023-2028 ($ million)
- Exhibits79: Chart on North America - Year-over-year growth 2023-2028 (%)
- Exhibits80: Data Table on North America - Year-over-year growth 2023-2028 (%)
- Exhibits81: Chart on South America - Market size and forecast 2023-2028 ($ million)
- Exhibits82: Data Table on South America - Market size and forecast 2023-2028 ($ million)
- Exhibits83: Chart on South America - Year-over-year growth 2023-2028 (%)
- Exhibits84: Data Table on South America - Year-over-year growth 2023-2028 (%)
- Exhibits85: Chart on Middle East and Africa - Market size and forecast 2023-2028 ($ million)
- Exhibits86: Data Table on Middle East and Africa - Market size and forecast 2023-2028 ($ million)
- Exhibits87: Chart on Middle East and Africa - Year-over-year growth 2023-2028 (%)
- Exhibits88: Data Table on Middle East and Africa - Year-over-year growth 2023-2028 (%)
- Exhibits89: Chart on US - Market size and forecast 2023-2028 ($ million)
- Exhibits90: Data Table on US - Market size and forecast 2023-2028 ($ million)
- Exhibits91: Chart on US - Year-over-year growth 2023-2028 (%)
- Exhibits92: Data Table on US - Year-over-year growth 2023-2028 (%)
- Exhibits93: Chart on China - Market size and forecast 2023-2028 ($ million)
- Exhibits94: Data Table on China - Market size and forecast 2023-2028 ($ million)
- Exhibits95: Chart on China - Year-over-year growth 2023-2028 (%)
- Exhibits96: Data Table on China - Year-over-year growth 2023-2028 (%)
- Exhibits97: Chart on Germany - Market size and forecast 2023-2028 ($ million)
- Exhibits98: Data Table on Germany - Market size and forecast 2023-2028 ($ million)
- Exhibits99: Chart on Germany - Year-over-year growth 2023-2028 (%)
- Exhibits100: Data Table on Germany - Year-over-year growth 2023-2028 (%)
- Exhibits101: Chart on UK - Market size and forecast 2023-2028 ($ million)
- Exhibits102: Data Table on UK - Market size and forecast 2023-2028 ($ million)
- Exhibits103: Chart on UK - Year-over-year growth 2023-2028 (%)
- Exhibits104: Data Table on UK - Year-over-year growth 2023-2028 (%)
- Exhibits105: Chart on Japan - Market size and forecast 2023-2028 ($ million)
- Exhibits106: Data Table on Japan - Market size and forecast 2023-2028 ($ million)
- Exhibits107: Chart on Japan - Year-over-year growth 2023-2028 (%)
- Exhibits108: Data Table on Japan - Year-over-year growth 2023-2028 (%)
- Exhibits109: Market opportunity by geography ($ million)
- Exhibits110: Data Tables on Market opportunity by geography ($ million)
- Exhibits111: Impact of drivers and challenges in 2023 and 2028
- Exhibits112: Overview on criticality of inputs and factors of differentiation
- Exhibits113: Overview on factors of disruption
- Exhibits114: Impact of key risks on business
- Exhibits115: Companies covered
- Exhibits116: Matrix on companies position and classification
- Exhibits117: Accumulatorenwerke HOPPECKE Carl Zoellner and Sohn GmbH - Overview
- Exhibits118: Accumulatorenwerke HOPPECKE Carl Zoellner and Sohn GmbH - Product / Service
- Exhibits119: Accumulatorenwerke HOPPECKE Carl Zoellner and Sohn GmbH - Key offerings
- Exhibits120: AEG Power Solutions BV - Overview
- Exhibits121: AEG Power Solutions BV - Product / Service
- Exhibits122: AEG Power Solutions BV - Key offerings
- Exhibits123: Amara Raja Group - Overview
- Exhibits124: Amara Raja Group - Product / Service
- Exhibits125: Amara Raja Group - Key offerings
- Exhibits126: East Penn Manufacturing Co. Inc. - Overview
- Exhibits127: East Penn Manufacturing Co. Inc. - Product / Service
- Exhibits128: East Penn Manufacturing Co. Inc. - Key news
- Exhibits129: East Penn Manufacturing Co. Inc. - Key offerings
- Exhibits130: EnerSys - Overview
- Exhibits131: EnerSys - Business segments
- Exhibits132: EnerSys - Key news
- Exhibits133: EnerSys - Key offerings
- Exhibits134: EnerSys - Segment focus
- Exhibits135: Exide Industries Ltd. - Overview
- Exhibits136: Exide Industries Ltd. - Product / Service
- Exhibits137: Exide Industries Ltd. - Key news
- Exhibits138: Exide Industries Ltd. - Key offerings
- Exhibits139: Furukawa Electric Co. Ltd. - Overview
- Exhibits140: Furukawa Electric Co. Ltd. - Business segments
- Exhibits141: Furukawa Electric Co. Ltd. - Key news
- Exhibits142: Furukawa Electric Co. Ltd. - Key offerings
- Exhibits143: Furukawa Electric Co. Ltd. - Segment focus
- Exhibits144: GS Yuasa International Ltd. - Overview
- Exhibits145: GS Yuasa International Ltd. - Business segments
- Exhibits146: GS Yuasa International Ltd. - Key news
- Exhibits147: GS Yuasa International Ltd. - Key offerings
- Exhibits148: GS Yuasa International Ltd. - Segment focus
- Exhibits149: Hitachi Ltd. - Overview
- Exhibits150: Hitachi Ltd. - Business segments
- Exhibits151: Hitachi Ltd. - Key news
- Exhibits152: Hitachi Ltd. - Key offerings
- Exhibits153: Hitachi Ltd. - Segment focus
- Exhibits154: JFM Engineering Inc. - Overview
- Exhibits155: JFM Engineering Inc. - Product / Service
- Exhibits156: JFM Engineering Inc. - Key offerings
- Exhibits157: Leclanche SA - Overview
- Exhibits158: Leclanche SA - Business segments
- Exhibits159: Leclanche SA - Key offerings
- Exhibits160: Leclanche SA - Segment focus
- Exhibits161: Saft Groupe SAS - Overview
- Exhibits162: Saft Groupe SAS - Product / Service
- Exhibits163: Saft Groupe SAS - Key offerings
- Exhibits164: Stryten Energy LLC - Overview
- Exhibits165: Stryten Energy LLC - Product / Service
- Exhibits166: Stryten Energy LLC - Key offerings
- Exhibits167: Toshiba Corp. - Overview
- Exhibits168: Toshiba Corp. - Business segments
- Exhibits169: Toshiba Corp. - Key news
- Exhibits170: Toshiba Corp. - Key offerings
- Exhibits171: Toshiba Corp. - Segment focus
- Exhibits172: Wisdom Industrial Power Co. Ltd. - Overview
- Exhibits173: Wisdom Industrial Power Co. Ltd. - Product / Service
- Exhibits174: Wisdom Industrial Power Co. Ltd. - Key offerings
- Exhibits175: Inclusions checklist
- Exhibits176: Exclusions checklist
- Exhibits177: Currency conversion rates for US$
- Exhibits178: Research methodology
- Exhibits179: Information sources
- Exhibits180: Data validation
- Exhibits181: Validation techniques employed for market sizing
- Exhibits182: Data synthesis
- Exhibits183: 360 degree market analysis
- Exhibits184: List of abbreviations
The train battery market is forecasted to grow by USD 185.5 mn during 2023-2028, accelerating at a CAGR of 5.4% during the forecast period. The report on the train battery market provides a holistic analysis, market size and forecast, trends, growth drivers, and challenges, as well as vendor analysis covering around 25 vendors.
The report offers an up-to-date analysis regarding the current market scenario, the latest trends and drivers, and the overall market environment. The market is driven by increasing adoption of high-speed and autonomous railways, increasing budget allocation for railway development, and growing sustainable alternatives due to pollution.
Technavio's train battery market is segmented as below:
| Market Scope | |
|---|---|
| Base Year | 2024 |
| End Year | 2028 |
| Series Year | 2024-2028 |
| Growth Momentum | Accelerate |
| YOY 2024 | 5.12% |
| CAGR | 5.4% |
| Incremental Value | $185.5mn |
By Application
- Auxiliary battery
- Starter battery
By Battery Type
- Lead-acid
- Lithium-ion
- Nickel cadmium
By Geography
- Europe
- APAC
- North America
- South America
- Middle East and Africa
This study identifies the iot and big data to drive efficiency as one of the prime reasons driving the train battery market growth during the next few years. Also, growing consolidation in railway industry and advances in automotive battery technology will lead to sizable demand in the market.
The report on the train battery market covers the following areas:
- Train battery market sizing
- Train battery market forecast
- Train battery market industry analysis
The robust vendor analysis is designed to help clients improve their market position, and in line with this, this report provides a detailed analysis of several leading train battery market vendors that include Accumulatorenwerke HOPPECKE Carl Zoellner and Sohn GmbH, AEG Power Solutions BV, Amara Raja Group, East Penn Manufacturing Co. Inc., EnerSys, Exide Industries Ltd., First National Battery, Furukawa Electric Co. Ltd., GS Yuasa International Ltd., HBL Power Systems Ltd., Hitachi Ltd., JFM Engineering Inc., Leclanche SA, Microtex Energy Pvt. Ltd., Saft Groupe SAS, Schaltbau Holding AG, Star Battery Ltd., Stryten Energy LLC, Toshiba Corp., and Wisdom Industrial Power Co. Ltd.. Also, the train battery market analysis report includes information on upcoming trends and challenges that will influence market growth. This is to help companies strategize and leverage all forthcoming growth opportunities.
The study was conducted using an objective combination of primary and secondary information including inputs from key participants in the industry. The report contains a comprehensive market and vendor landscape in addition to an analysis of the key vendors.
The publisher presents a detailed picture of the market by the way of study, synthesis, and summation of data from multiple sources by an analysis of key parameters such as profit, pricing, competition, and promotions. It presents various market facets by identifying the key industry influencers. The data presented is comprehensive, reliable, and a result of extensive research - both primary and secondary. The market research reports provide a complete competitive landscape and an in-depth vendor selection methodology and analysis using qualitative and quantitative research to forecast the accurate market growth.
Table of Contents
1 Executive Summary
- 1.1 Market overview
- Executive Summary - Chart on Market Overview
- Executive Summary - Data Table on Market Overview
- Executive Summary - Chart on Global Market Characteristics
- Executive Summary - Chart on Market by Geography
- Executive Summary - Chart on Market Segmentation by Application
- Executive Summary - Chart on Market Segmentation by Battery Type
- Executive Summary - Chart on Incremental Growth
- Executive Summary - Data Table on Incremental Growth
- Executive Summary - Chart on Company Market Positioning
2 Market Landscape
- 2.1 Market ecosystem
- Parent Market
- Data Table on - Parent Market
- 2.2 Market characteristics
- Market characteristics analysis
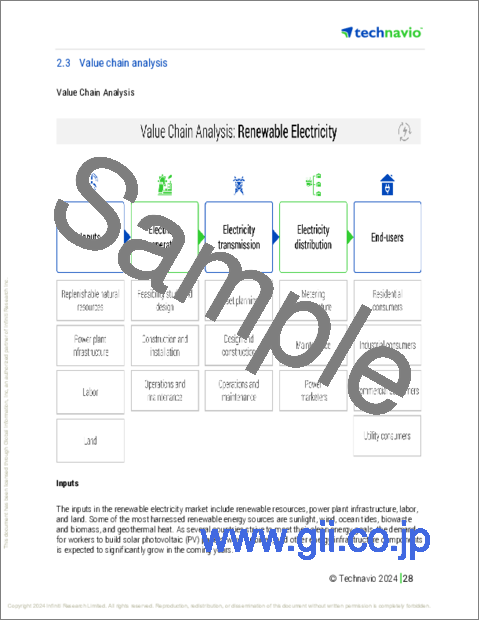
- 2.3 Value chain analysis
- Value Chain Analysis
3 Market Sizing
- 3.1 Market definition
- Offerings of companies included in the market definition
- 3.2 Market segment analysis
- Market segments
- 3.3 Market size 2023
- 3.4 Market outlook: Forecast for 2023-2028
- Chart on Global - Market size and forecast 2023-2028 ($ million)
- Data Table on Global - Market size and forecast 2023-2028 ($ million)
- Chart on Global Market: Year-over-year growth 2023-2028 (%)
- Data Table on Global Market: Year-over-year growth 2023-2028 (%)
4 Historic Market Size
- 4.1 Global Train Battery Market 2018 - 2022
- Historic Market Size - Data Table on Global Train Battery Market 2018 - 2022 ($ million)
- 4.2 Application segment analysis 2018 - 2022
- Historic Market Size - Application Segment 2018 - 2022 ($ million)
- 4.3 Battery Type segment analysis 2018 - 2022
- Historic Market Size - Battery Type Segment 2018 - 2022 ($ million)
- 4.4 Geography segment analysis 2018 - 2022
- Historic Market Size - Geography Segment 2018 - 2022 ($ million)
- 4.5 Country segment analysis 2018 - 2022
- Historic Market Size - Country Segment 2018 - 2022 ($ million)
5 Five Forces Analysis
- 5.1 Five forces summary
- Five forces analysis - Comparison between 2023 and 2028
- 5.2 Bargaining power of buyers
- Bargaining power of buyers - Impact of key factors 2023 and 2028
- 5.3 Bargaining power of suppliers
- Bargaining power of suppliers - Impact of key factors in 2023 and 2028
- 5.4 Threat of new entrants
- Threat of new entrants - Impact of key factors in 2023 and 2028
- 5.5 Threat of substitutes
- Threat of substitutes - Impact of key factors in 2023 and 2028
- 5.6 Threat of rivalry
- Threat of rivalry - Impact of key factors in 2023 and 2028
- 5.7 Market condition
- Chart on Market condition - Five forces 2023 and 2028
6 Market Segmentation by Application
- 6.1 Market segments
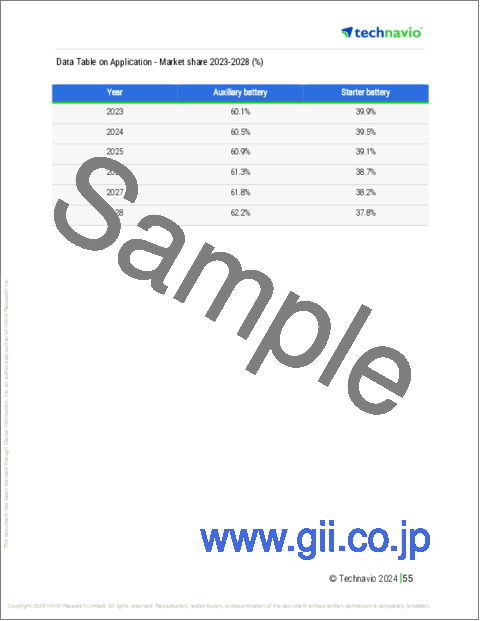
- Chart on Application - Market share 2023-2028 (%)
- Data Table on Application - Market share 2023-2028 (%)
- 6.2 Comparison by Application
- Chart on Comparison by Application
- Data Table on Comparison by Application
- 6.3 Auxiliary battery - Market size and forecast 2023-2028
- Chart on Auxiliary battery - Market size and forecast 2023-2028 ($ million)
- Data Table on Auxiliary battery - Market size and forecast 2023-2028 ($ million)
- Chart on Auxiliary battery - Year-over-year growth 2023-2028 (%)
- Data Table on Auxiliary battery - Year-over-year growth 2023-2028 (%)
- 6.4 Starter battery - Market size and forecast 2023-2028
- Chart on Starter battery - Market size and forecast 2023-2028 ($ million)
- Data Table on Starter battery - Market size and forecast 2023-2028 ($ million)
- Chart on Starter battery - Year-over-year growth 2023-2028 (%)
- Data Table on Starter battery - Year-over-year growth 2023-2028 (%)
- 6.5 Market opportunity by Application
- Market opportunity by Application ($ million)
- Data Table on Market opportunity by Application ($ million)
7 Market Segmentation by Battery Type
- 7.1 Market segments
- Chart on Battery Type - Market share 2023-2028 (%)
- Data Table on Battery Type - Market share 2023-2028 (%)
- 7.2 Comparison by Battery Type
- Chart on Comparison by Battery Type
- Data Table on Comparison by Battery Type
- 7.3 Lead-acid - Market size and forecast 2023-2028
- Chart on Lead-acid - Market size and forecast 2023-2028 ($ million)
- Data Table on Lead-acid - Market size and forecast 2023-2028 ($ million)
- Chart on Lead-acid - Year-over-year growth 2023-2028 (%)
- Data Table on Lead-acid - Year-over-year growth 2023-2028 (%)
- 7.4 Lithium-ion - Market size and forecast 2023-2028
- Chart on Lithium-ion - Market size and forecast 2023-2028 ($ million)
- Data Table on Lithium-ion - Market size and forecast 2023-2028 ($ million)
- Chart on Lithium-ion - Year-over-year growth 2023-2028 (%)
- Data Table on Lithium-ion - Year-over-year growth 2023-2028 (%)
- 7.5 Nickel cadmium - Market size and forecast 2023-2028
- Chart on Nickel cadmium - Market size and forecast 2023-2028 ($ million)
- Data Table on Nickel cadmium - Market size and forecast 2023-2028 ($ million)
- Chart on Nickel cadmium - Year-over-year growth 2023-2028 (%)
- Data Table on Nickel cadmium - Year-over-year growth 2023-2028 (%)
- 7.6 Market opportunity by Battery Type
- Market opportunity by Battery Type ($ million)
- Data Table on Market opportunity by Battery Type ($ million)
8 Customer Landscape
- 8.1 Customer landscape overview
- Analysis of price sensitivity, lifecycle, customer purchase basket, adoption rates, and purchase criteria
9 Geographic Landscape
- 9.1 Geographic segmentation
- Chart on Market share by geography 2023-2028 (%)
- Data Table on Market share by geography 2023-2028 (%)
- 9.2 Geographic comparison
- Chart on Geographic comparison
- Data Table on Geographic comparison
- 9.3 Europe - Market size and forecast 2023-2028
- Chart on Europe - Market size and forecast 2023-2028 ($ million)
- Data Table on Europe - Market size and forecast 2023-2028 ($ million)
- Chart on Europe - Year-over-year growth 2023-2028 (%)
- Data Table on Europe - Year-over-year growth 2023-2028 (%)
- 9.4 APAC - Market size and forecast 2023-2028
- Chart on APAC - Market size and forecast 2023-2028 ($ million)
- Data Table on APAC - Market size and forecast 2023-2028 ($ million)
- Chart on APAC - Year-over-year growth 2023-2028 (%)
- Data Table on APAC - Year-over-year growth 2023-2028 (%)
- 9.5 North America - Market size and forecast 2023-2028
- Chart on North America - Market size and forecast 2023-2028 ($ million)
- Data Table on North America - Market size and forecast 2023-2028 ($ million)
- Chart on North America - Year-over-year growth 2023-2028 (%)
- Data Table on North America - Year-over-year growth 2023-2028 (%)
- 9.6 South America - Market size and forecast 2023-2028
- Chart on South America - Market size and forecast 2023-2028 ($ million)
- Data Table on South America - Market size and forecast 2023-2028 ($ million)
- Chart on South America - Year-over-year growth 2023-2028 (%)
- Data Table on South America - Year-over-year growth 2023-2028 (%)
- 9.7 Middle East and Africa - Market size and forecast 2023-2028
- Chart on Middle East and Africa - Market size and forecast 2023-2028 ($ million)
- Data Table on Middle East and Africa - Market size and forecast 2023-2028 ($ million)
- Chart on Middle East and Africa - Year-over-year growth 2023-2028 (%)
- Data Table on Middle East and Africa - Year-over-year growth 2023-2028 (%)
- 9.8 US - Market size and forecast 2023-2028
- Chart on US - Market size and forecast 2023-2028 ($ million)
- Data Table on US - Market size and forecast 2023-2028 ($ million)
- Chart on US - Year-over-year growth 2023-2028 (%)
- Data Table on US - Year-over-year growth 2023-2028 (%)
- 9.9 China - Market size and forecast 2023-2028
- Chart on China - Market size and forecast 2023-2028 ($ million)
- Data Table on China - Market size and forecast 2023-2028 ($ million)
- Chart on China - Year-over-year growth 2023-2028 (%)
- Data Table on China - Year-over-year growth 2023-2028 (%)
- 9.10 Germany - Market size and forecast 2023-2028
- Chart on Germany - Market size and forecast 2023-2028 ($ million)
- Data Table on Germany - Market size and forecast 2023-2028 ($ million)
- Chart on Germany - Year-over-year growth 2023-2028 (%)
- Data Table on Germany - Year-over-year growth 2023-2028 (%)
- 9.11 UK - Market size and forecast 2023-2028
- Chart on UK - Market size and forecast 2023-2028 ($ million)
- Data Table on UK - Market size and forecast 2023-2028 ($ million)
- Chart on UK - Year-over-year growth 2023-2028 (%)
- Data Table on UK - Year-over-year growth 2023-2028 (%)
- 9.12 Japan - Market size and forecast 2023-2028
- Chart on Japan - Market size and forecast 2023-2028 ($ million)
- Data Table on Japan - Market size and forecast 2023-2028 ($ million)
- Chart on Japan - Year-over-year growth 2023-2028 (%)
- Data Table on Japan - Year-over-year growth 2023-2028 (%)
- 9.13 Market opportunity by geography
- Market opportunity by geography ($ million)
- Data Tables on Market opportunity by geography ($ million)
10 Drivers, Challenges, and Opportunity/Restraints
- 10.1 Market drivers
- 10.2 Market challenges
- 10.3 Impact of drivers and challenges
- Impact of drivers and challenges in 2023 and 2028
- 10.4 Market opportunities/restraints
11 Competitive Landscape
- 11.1 Overview
- 11.2 Competitive Landscape
- Overview on criticality of inputs and factors of differentiation
- 11.3 Landscape disruption
- Overview on factors of disruption
- 11.4 Industry risks
- Impact of key risks on business
12 Competitive Analysis
- 12.1 Companies profiled
- Companies covered
- 12.2 Market positioning of companies
- Matrix on companies position and classification
- 12.3 Accumulatorenwerke HOPPECKE Carl Zoellner and Sohn GmbH
- Accumulatorenwerke HOPPECKE Carl Zoellner and Sohn GmbH - Overview
- Accumulatorenwerke HOPPECKE Carl Zoellner and Sohn GmbH - Product / Service
- Accumulatorenwerke HOPPECKE Carl Zoellner and Sohn GmbH - Key offerings
- 12.4 AEG Power Solutions BV
- AEG Power Solutions BV - Overview
- AEG Power Solutions BV - Product / Service
- AEG Power Solutions BV - Key offerings
- 12.5 Amara Raja Group
- Amara Raja Group - Overview
- Amara Raja Group - Product / Service
- Amara Raja Group - Key offerings
- 12.6 East Penn Manufacturing Co. Inc.
- East Penn Manufacturing Co. Inc. - Overview
- East Penn Manufacturing Co. Inc. - Product / Service
- East Penn Manufacturing Co. Inc. - Key news
- East Penn Manufacturing Co. Inc. - Key offerings
- 12.7 EnerSys
- EnerSys - Overview
- EnerSys - Business segments
- EnerSys - Key news
- EnerSys - Key offerings
- EnerSys - Segment focus
- 12.8 Exide Industries Ltd.
- Exide Industries Ltd. - Overview
- Exide Industries Ltd. - Product / Service
- Exide Industries Ltd. - Key news
- Exide Industries Ltd. - Key offerings
- 12.9 Furukawa Electric Co. Ltd.
- Furukawa Electric Co. Ltd. - Overview
- Furukawa Electric Co. Ltd. - Business segments
- Furukawa Electric Co. Ltd. - Key news
- Furukawa Electric Co. Ltd. - Key offerings
- Furukawa Electric Co. Ltd. - Segment focus
- 12.10 GS Yuasa International Ltd.
- GS Yuasa International Ltd. - Overview
- GS Yuasa International Ltd. - Business segments
- GS Yuasa International Ltd. - Key news
- GS Yuasa International Ltd. - Key offerings
- GS Yuasa International Ltd. - Segment focus
- 12.11 Hitachi Ltd.
- Hitachi Ltd. - Overview
- Hitachi Ltd. - Business segments
- Hitachi Ltd. - Key news
- Hitachi Ltd. - Key offerings
- Hitachi Ltd. - Segment focus
- 12.12 JFM Engineering Inc.
- JFM Engineering Inc. - Overview
- JFM Engineering Inc. - Product / Service
- JFM Engineering Inc. - Key offerings
- 12.13 Leclanche SA
- Leclanche SA - Overview
- Leclanche SA - Business segments
- Leclanche SA - Key offerings
- Leclanche SA - Segment focus
- 12.14 Saft Groupe SAS
- Saft Groupe SAS - Overview
- Saft Groupe SAS - Product / Service
- Saft Groupe SAS - Key offerings
- 12.15 Stryten Energy LLC
- Stryten Energy LLC - Overview
- Stryten Energy LLC - Product / Service
- Stryten Energy LLC - Key offerings
- 12.16 Toshiba Corp.
- Toshiba Corp. - Overview
- Toshiba Corp. - Business segments
- Toshiba Corp. - Key news
- Toshiba Corp. - Key offerings
- Toshiba Corp. - Segment focus
- 12.17 Wisdom Industrial Power Co. Ltd.
- Wisdom Industrial Power Co. Ltd. - Overview
- Wisdom Industrial Power Co. Ltd. - Product / Service
- Wisdom Industrial Power Co. Ltd. - Key offerings
13 Appendix
- 13.1 Scope of the report
- 13.2 Inclusions and exclusions checklist
- Inclusions checklist
- Exclusions checklist
- 13.3 Currency conversion rates for US$
- Currency conversion rates for US$
- 13.4 Research methodology
- Research methodology
- 13.5 Data procurement
- Information sources
- 13.6 Data validation
- Data validation
- 13.7 Validation techniques employed for market sizing
- Validation techniques employed for market sizing
- 13.8 Data synthesis
- Data synthesis
- 13.9 360 degree market analysis
- 360 degree market analysis
- 13.10 List of abbreviations
- List of abbreviations

