|
|
市場調査レポート
商品コード
1464546
グリーンおよびバイオ溶剤の世界市場 2024-2028Global Green and Bio Solvent Market 2024-2028 |
||||||
|
|||||||
カスタマイズ可能
|
|||||||

| グリーンおよびバイオ溶剤の世界市場 2024-2028 |
|
出版日: 2024年04月04日
発行: TechNavio
ページ情報: 英文 189 Pages
納期: 即納可能
|

全表示
- 概要
- 図表
- 目次
グリーンおよびバイオ溶剤市場は2023-2028年に72億9,000万米ドル、予測期間中のCAGRは10.13%で成長すると予測されます。
当レポートでは、グリーンおよびバイオ溶剤市場の全体的な分析、市場規模・予測、動向、成長促進要因、課題、約25のベンダーを網羅したベンダー分析などを掲載しています。
現在の市場シナリオ、最新動向と促進要因、市場環境全体に関する最新分析を提供しています。市場は、多くのエンドユーザー産業におけるグリーンおよびバイオ溶剤採用の増加、新興経済圏における環境に優しい製品に対する需要の増加、グリーンおよびバイオ溶剤に関する政府の有利な規制などが牽引しています。
| 市場範囲 | |
|---|---|
| 基準年 | 2024 |
| 終了年 | 2028 |
| 予測期間 | 2024-2028 |
| 成長モメンタム | 加速 |
| 前年比2024年 | 9.61% |
| CAGR | 10.13% |
| 増分額 | 72億9,000万米ドル |
本調査では、今後数年間のグリーンおよびバイオ溶剤市場成長を牽引する主な要因として、ベンダーによる新製品投入の増加を挙げています。また、研究開発活動への投資の増加やグリーンおよびバイオ溶剤生産施設の拡張は、市場の大きな需要につながります。
目次
第1章 エグゼクティブサマリー
- 市場概要
第2章 市場情勢
- 市場エコシステム
第3章 市場規模の評価
- 市場の定義
- 市場セグメント分析
- 市場規模 2023
- 市場の見通し 2023-2028
第4章 市場規模実績
- グリーンおよびバイオ溶剤の世界市場 2018-2022
- 製品セグメント分析 2018-2022
- 用途別セグメント分析 2018-2022
- 地域別セグメント分析 2018-2022
- 国別セグメント分析 2018-2022
第5章 ファイブフォース分析
- ファイブフォースの要約
- 買い手の交渉力
- 供給企業の交渉力
- 新規参入業者の脅威
- 代替品の脅威
- 競争の脅威
- 市況
第6章 市場セグメンテーション:製品別
- 市場セグメント
- 比較:製品別
- 乳酸エステル:市場規模と予測 2023-2028
- 大豆メチル溶剤:市場規模と予測 2023-2028
- アルコール:市場規模と予測 2023-2028
- D-リモネン:市場規模と予測 2023-2028
- その他:市場規模と予測 2023-2028
- 市場機会:製品別
第7章 市場セグメンテーション:用途別
- 市場セグメント
- 比較:用途別
- 塗料およびコーティング:市場規模と予測 2023-2028
- 印刷インク:市場規模と予測 2023-2028
- 洗浄剤:市場規模と予測 2023-2028
- 接着剤およびシーラント:市場規模と予測 2023-2028
- その他:市場規模と予測 2023-2028
- 市場機会:用途別
第8章 顧客情勢
- 顧客情勢の概要
第9章 地域別情勢
- 地域別セグメンテーション
- 地域別比較
- 北米:市場規模と予測 2023-2028
- 欧州:市場規模と予測 2023-2028
- アジア太平洋:市場規模と予測 2023-2028
- 南米:市場規模と予測 2023-2028
- 中東・アフリカ:市場規模と予測 2023-2028
- 米国:市場規模と予測 2023-2028
- 中国:市場規模と予測 2023-2028
- ドイツ:市場規模と予測 2023-2028
- 英国:市場規模と予測 2023-2028
- カナダ:市場規模と予測 2023-2028
- 市場機会:地域情勢別
第10章 促進要因、課題、および動向
- 市場促進要因
- 市場の課題
- 促進要因と課題の影響
- 市場動向
第11章 ベンダー情勢
- 概要
- ベンダー情勢
- 混乱の状況
- 業界のリスク
第12章 ベンダー分析
- 対象ベンダー
- ベンダーの市場ポジショニング
- Archer Daniels Midland Co.
- BASF SE
- Braskem SA
- Cargill Inc.
- Circa Group AS
- Corbion NV
- CREMER OLEO GmbH and Co. KG
- DuPont de Nemours Inc.
- Gevo Inc.
- GFBio
- Huntsman International LLC
- India Glycols Ltd.
- Solvay SA
- Stepan Co.
- Vertec Biosolvents Inc.
第13章 付録
Exhibits:
- Exhibits1: Executive Summary - Chart on Market Overview
- Exhibits2: Executive Summary - Data Table on Market Overview
- Exhibits3: Executive Summary - Chart on Global Market Characteristics
- Exhibits4: Executive Summary - Chart on Market By Geographical Landscape
- Exhibits5: Executive Summary - Chart on Market Segmentation by Product
- Exhibits6: Executive Summary - Chart on Market Segmentation by Application
- Exhibits7: Executive Summary - Chart on Incremental Growth
- Exhibits8: Executive Summary - Data Table on Incremental Growth
- Exhibits9: Executive Summary - Chart on Vendor Market Positioning
- Exhibits10: Parent market
- Exhibits11: Market Characteristics
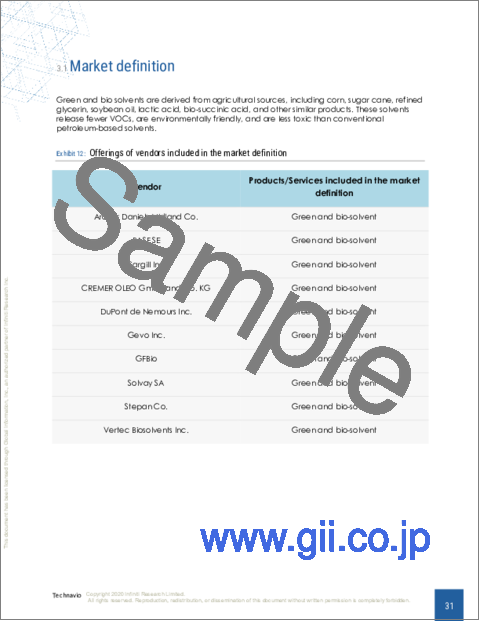
- Exhibits12: Offerings of vendors included in the market definition
- Exhibits13: Market segments
- Exhibits14: Chart on Global - Market size and forecast 2023-2028 ($ billion)
- Exhibits15: Data Table on Global - Market size and forecast 2023-2028 ($ billion)
- Exhibits16: Chart on Global Market: Year-over-year growth 2023-2028 (%)
- Exhibits17: Data Table on Global Market: Year-over-year growth 2023-2028 (%)
- Exhibits18: Historic Market Size - Data Table on global green and bio solvent market 2018 - 2022 ($ billion)
- Exhibits19: Historic Market Size - Product Segment 2018 - 2022 ($ billion)
- Exhibits20: Historic Market Size - Application Segment 2018 - 2022 ($ billion)
- Exhibits21: Historic Market Size - Geography Segment 2018 - 2022 ($ billion)
- Exhibits22: Historic Market Size - Country Segment 2018 - 2022 ($ billion)
- Exhibits23: Five forces analysis - Comparison between 2023 and 2028
- Exhibits24: Chart on Bargaining power of buyers - Impact of key factors 2023 and 2028
- Exhibits25: Bargaining power of suppliers - Impact of key factors in 2023 and 2028
- Exhibits26: Threat of new entrants - Impact of key factors in 2023 and 2028
- Exhibits27: Threat of substitutes - Impact of key factors in 2023 and 2028
- Exhibits28: Threat of rivalry - Impact of key factors in 2023 and 2028
- Exhibits29: Chart on Market condition - Five forces 2023 and 2028
- Exhibits30: Chart on Product - Market share 2023-2028 (%)
- Exhibits31: Data Table on Product - Market share 2023-2028 (%)
- Exhibits32: Chart on Comparison by Product
- Exhibits33: Data Table on Comparison by Product
- Exhibits34: Chart on Lactate esters - Market size and forecast 2023-2028 ($ billion)
- Exhibits35: Data Table on Lactate esters - Market size and forecast 2023-2028 ($ billion)
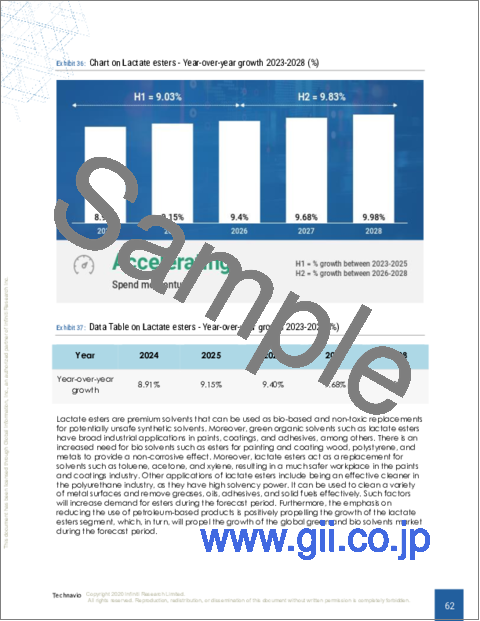
- Exhibits36: Chart on Lactate esters - Year-over-year growth 2023-2028 (%)
- Exhibits37: Data Table on Lactate esters - Year-over-year growth 2023-2028 (%)
- Exhibits38: Chart on Methyl soyate solvents - Market size and forecast 2023-2028 ($ billion)
- Exhibits39: Data Table on Methyl soyate solvents - Market size and forecast 2023-2028 ($ billion)
- Exhibits40: Chart on Methyl soyate solvents - Year-over-year growth 2023-2028 (%)
- Exhibits41: Data Table on Methyl soyate solvents - Year-over-year growth 2023-2028 (%)
- Exhibits42: Chart on Alcohols - Market size and forecast 2023-2028 ($ billion)
- Exhibits43: Data Table on Alcohols - Market size and forecast 2023-2028 ($ billion)
- Exhibits44: Chart on Alcohols - Year-over-year growth 2023-2028 (%)
- Exhibits45: Data Table on Alcohols - Year-over-year growth 2023-2028 (%)
- Exhibits46: Chart on D-limonene - Market size and forecast 2023-2028 ($ billion)
- Exhibits47: Data Table on D-limonene - Market size and forecast 2023-2028 ($ billion)
- Exhibits48: Chart on D-limonene - Year-over-year growth 2023-2028 (%)
- Exhibits49: Data Table on D-limonene - Year-over-year growth 2023-2028 (%)
- Exhibits50: Chart on Others - Market size and forecast 2023-2028 ($ billion)
- Exhibits51: Data Table on Others - Market size and forecast 2023-2028 ($ billion)
- Exhibits52: Chart on Others - Year-over-year growth 2023-2028 (%)
- Exhibits53: Data Table on Others - Year-over-year growth 2023-2028 (%)
- Exhibits54: Market opportunity by Product ($ billion)
- Exhibits55: Data Table on Market opportunity by Product ($ billion)
- Exhibits56: Chart on Application - Market share 2023-2028 (%)
- Exhibits57: Data Table on Application - Market share 2023-2028 (%)
- Exhibits58: Chart on Comparison by Application
- Exhibits59: Data Table on Comparison by Application
- Exhibits60: Chart on Paints and coatings - Market size and forecast 2023-2028 ($ billion)
- Exhibits61: Data Table on Paints and coatings - Market size and forecast 2023-2028 ($ billion)
- Exhibits62: Chart on Paints and coatings - Year-over-year growth 2023-2028 (%)
- Exhibits63: Data Table on Paints and coatings - Year-over-year growth 2023-2028 (%)
- Exhibits64: Chart on Printing inks - Market size and forecast 2023-2028 ($ billion)
- Exhibits65: Data Table on Printing inks - Market size and forecast 2023-2028 ($ billion)
- Exhibits66: Chart on Printing inks - Year-over-year growth 2023-2028 (%)
- Exhibits67: Data Table on Printing inks - Year-over-year growth 2023-2028 (%)
- Exhibits68: Chart on Cleaning products - Market size and forecast 2023-2028 ($ billion)
- Exhibits69: Data Table on Cleaning products - Market size and forecast 2023-2028 ($ billion)
- Exhibits70: Chart on Cleaning products - Year-over-year growth 2023-2028 (%)
- Exhibits71: Data Table on Cleaning products - Year-over-year growth 2023-2028 (%)
- Exhibits72: Chart on Adhesives and sealants - Market size and forecast 2023-2028 ($ billion)
- Exhibits73: Data Table on Adhesives and sealants - Market size and forecast 2023-2028 ($ billion)
- Exhibits74: Chart on Adhesives and sealants - Year-over-year growth 2023-2028 (%)
- Exhibits75: Data Table on Adhesives and sealants - Year-over-year growth 2023-2028 (%)
- Exhibits76: Chart on Others - Market size and forecast 2023-2028 ($ billion)
- Exhibits77: Data Table on Others - Market size and forecast 2023-2028 ($ billion)
- Exhibits78: Chart on Others - Year-over-year growth 2023-2028 (%)
- Exhibits79: Data Table on Others - Year-over-year growth 2023-2028 (%)
- Exhibits80: Market opportunity by Application ($ billion)
- Exhibits81: Data Table on Market opportunity by Application ($ billion)
- Exhibits82: Analysis of price sensitivity, lifecycle, customer purchase basket, adoption rates, and purchase criteria
- Exhibits83: Chart on Market share By Geographical Landscape 2023-2028 (%)
- Exhibits84: Data Table on Market share By Geographical Landscape 2023-2028 (%)
- Exhibits85: Chart on Geographic comparison
- Exhibits86: Data Table on Geographic comparison
- Exhibits87: Chart on North America - Market size and forecast 2023-2028 ($ billion)
- Exhibits88: Data Table on North America - Market size and forecast 2023-2028 ($ billion)
- Exhibits89: Chart on North America - Year-over-year growth 2023-2028 (%)
- Exhibits90: Data Table on North America - Year-over-year growth 2023-2028 (%)
- Exhibits91: Chart on Europe - Market size and forecast 2023-2028 ($ billion)
- Exhibits92: Data Table on Europe - Market size and forecast 2023-2028 ($ billion)
- Exhibits93: Chart on Europe - Year-over-year growth 2023-2028 (%)
- Exhibits94: Data Table on Europe - Year-over-year growth 2023-2028 (%)
- Exhibits95: Chart on APAC - Market size and forecast 2023-2028 ($ billion)
- Exhibits96: Data Table on APAC - Market size and forecast 2023-2028 ($ billion)
- Exhibits97: Chart on APAC - Year-over-year growth 2023-2028 (%)
- Exhibits98: Data Table on APAC - Year-over-year growth 2023-2028 (%)
- Exhibits99: Chart on South America - Market size and forecast 2023-2028 ($ billion)
- Exhibits100: Data Table on South America - Market size and forecast 2023-2028 ($ billion)
- Exhibits101: Chart on South America - Year-over-year growth 2023-2028 (%)
- Exhibits102: Data Table on South America - Year-over-year growth 2023-2028 (%)
- Exhibits103: Chart on Middle East and Africa - Market size and forecast 2023-2028 ($ billion)
- Exhibits104: Data Table on Middle East and Africa - Market size and forecast 2023-2028 ($ billion)
- Exhibits105: Chart on Middle East and Africa - Year-over-year growth 2023-2028 (%)
- Exhibits106: Data Table on Middle East and Africa - Year-over-year growth 2023-2028 (%)
- Exhibits107: Chart on US - Market size and forecast 2023-2028 ($ billion)
- Exhibits108: Data Table on US - Market size and forecast 2023-2028 ($ billion)
- Exhibits109: Chart on US - Year-over-year growth 2023-2028 (%)
- Exhibits110: Data Table on US - Year-over-year growth 2023-2028 (%)
- Exhibits111: Chart on China - Market size and forecast 2023-2028 ($ billion)
- Exhibits112: Data Table on China - Market size and forecast 2023-2028 ($ billion)
- Exhibits113: Chart on China - Year-over-year growth 2023-2028 (%)
- Exhibits114: Data Table on China - Year-over-year growth 2023-2028 (%)
- Exhibits115: Chart on Germany - Market size and forecast 2023-2028 ($ billion)
- Exhibits116: Data Table on Germany - Market size and forecast 2023-2028 ($ billion)
- Exhibits117: Chart on Germany - Year-over-year growth 2023-2028 (%)
- Exhibits118: Data Table on Germany - Year-over-year growth 2023-2028 (%)
- Exhibits119: Chart on UK - Market size and forecast 2023-2028 ($ billion)
- Exhibits120: Data Table on UK - Market size and forecast 2023-2028 ($ billion)
- Exhibits121: Chart on UK - Year-over-year growth 2023-2028 (%)
- Exhibits122: Data Table on UK - Year-over-year growth 2023-2028 (%)
- Exhibits123: Chart on Canada - Market size and forecast 2023-2028 ($ billion)
- Exhibits124: Data Table on Canada - Market size and forecast 2023-2028 ($ billion)
- Exhibits125: Chart on Canada - Year-over-year growth 2023-2028 (%)
- Exhibits126: Data Table on Canada - Year-over-year growth 2023-2028 (%)
- Exhibits127: Market opportunity By Geographical Landscape ($ billion)
- Exhibits128: Data Tables on Market opportunity By Geographical Landscape ($ billion)
- Exhibits129: Impact of drivers and challenges in 2023 and 2028
- Exhibits130: Overview on Criticality of inputs and Factors of differentiation
- Exhibits131: Overview on factors of disruption
- Exhibits132: Impact of key risks on business
- Exhibits133: Vendors covered
- Exhibits134: Matrix on vendor position and classification
- Exhibits135: Archer Daniels Midland Co. - Overview
- Exhibits136: Archer Daniels Midland Co. - Business segments
- Exhibits137: Archer Daniels Midland Co. - Key news
- Exhibits138: Archer Daniels Midland Co. - Key offerings
- Exhibits139: Archer Daniels Midland Co. - Segment focus
- Exhibits140: BASF SE - Overview
- Exhibits141: BASF SE - Business segments
- Exhibits142: BASF SE - Key news
- Exhibits143: BASF SE - Key offerings
- Exhibits144: BASF SE - Segment focus
- Exhibits145: Braskem SA - Overview
- Exhibits146: Braskem SA - Business segments
- Exhibits147: Braskem SA - Key news
- Exhibits148: Braskem SA - Key offerings
- Exhibits149: Braskem SA - Segment focus
- Exhibits150: Cargill Inc. - Overview
- Exhibits151: Cargill Inc. - Product / Service
- Exhibits152: Cargill Inc. - Key news
- Exhibits153: Cargill Inc. - Key offerings
- Exhibits154: Circa Group AS - Overview
- Exhibits155: Circa Group AS - Product / Service
- Exhibits156: Circa Group AS - Key offerings
- Exhibits157: Corbion NV - Overview
- Exhibits158: Corbion NV - Business segments
- Exhibits159: Corbion NV - Key offerings
- Exhibits160: Corbion NV - Segment focus
- Exhibits161: CREMER OLEO GmbH and Co. KG - Overview
- Exhibits162: CREMER OLEO GmbH and Co. KG - Product / Service
- Exhibits163: CREMER OLEO GmbH and Co. KG - Key offerings
- Exhibits164: DuPont de Nemours Inc. - Overview
- Exhibits165: DuPont de Nemours Inc. - Business segments
- Exhibits166: DuPont de Nemours Inc. - Key news
- Exhibits167: DuPont de Nemours Inc. - Key offerings
- Exhibits168: DuPont de Nemours Inc. - Segment focus
- Exhibits169: Gevo Inc. - Overview
- Exhibits170: Gevo Inc. - Business segments
- Exhibits171: Gevo Inc. - Key news
- Exhibits172: Gevo Inc. - Key offerings
- Exhibits173: Gevo Inc. - Segment focus
- Exhibits174: GFBio - Overview
- Exhibits175: GFBio - Product / Service
- Exhibits176: GFBio - Key offerings
- Exhibits177: Huntsman International LLC - Overview
- Exhibits178: Huntsman International LLC - Business segments
- Exhibits179: Huntsman International LLC - Key news
- Exhibits180: Huntsman International LLC - Key offerings
- Exhibits181: Huntsman International LLC - Segment focus
- Exhibits182: India Glycols Ltd. - Overview
- Exhibits183: India Glycols Ltd. - Business segments
- Exhibits184: India Glycols Ltd. - Key offerings
- Exhibits185: India Glycols Ltd. - Segment focus
- Exhibits186: Solvay SA - Overview
- Exhibits187: Solvay SA - Business segments
- Exhibits188: Solvay SA - Key news
- Exhibits189: Solvay SA - Key offerings
- Exhibits190: Solvay SA - Segment focus
- Exhibits191: Stepan Co. - Overview
- Exhibits192: Stepan Co. - Business segments
- Exhibits193: Stepan Co. - Key offerings
- Exhibits194: Stepan Co. - Segment focus
- Exhibits195: Vertec Biosolvents Inc. - Overview
- Exhibits196: Vertec Biosolvents Inc. - Product / Service
- Exhibits197: Vertec Biosolvents Inc. - Key offerings
- Exhibits198: Inclusions checklist
- Exhibits199: Exclusions checklist
- Exhibits200: Currency conversion rates for US$
- Exhibits201: Research methodology
- Exhibits202: Validation techniques employed for market sizing
- Exhibits203: Information sources
- Exhibits204: List of abbreviations
The green and bio solvent market is forecasted to grow by USD 7.29 bn during 2023-2028, accelerating at a CAGR of 10.13% during the forecast period. The report on the green and bio solvent market provides a holistic analysis, market size and forecast, trends, growth drivers, and challenges, as well as vendor analysis covering around 25 vendors.
The report offers an up-to-date analysis regarding the current market scenario, the latest trends and drivers, and the overall market environment. The market is driven by an increase in the adoption of green and bio solvents among numerous end-user industries, increasing demand for environment-friendly products from emerging economies, and favorable government regulations on green and bio solvents.
Technavio's green and bio solvent market is segmented as below:
| Market Scope | |
|---|---|
| Base Year | 2024 |
| End Year | 2028 |
| Series Year | 2024-2028 |
| Growth Momentum | Accelerate |
| YOY 2024 | 9.61% |
| CAGR | 10.13% |
| Incremental Value | $7.29bn |
By Product
- Lactate esters
- Methyl soyate solvents
- Alcohols
- D-limonene
- Others
By Application
- Paints and coatings
- Printing inks
- Cleaning products
- Adhesives and sealants
- Others
By Geographical Landscape
- North America
- Europe
- APAC
- South America
- Middle East and Africa
This study identifies the increase in new product launches by market vendors as one of the prime reasons driving the green and bio solvent market growth during the next few years. Also, increasing investments in r and d activities and expansion of green and bio solvent production facilities will lead to sizable demand in the market.
The report on the green and bio solvent market covers the following areas:
- Green and bio solvent market sizing
- Green and bio solvent market forecast
- Green and bio solvent market industry analysis
The robust vendor analysis is designed to help clients improve their market position, and in line with this, this report provides a detailed analysis of several leading green and bio solvent market vendors that include alteqo bv, Archer Daniels Midland Co., Astrobio, BASF SE, Braskem SA, Cargill Inc., Circa Group AS, Corbion NV, CREMER OLEO GmbH and Co. KG, DuPont de Nemours Inc., Gevo Inc., GFBio, Huntsman International LLC, India Glycols Ltd., Roquette Freres SA, SEKAB Biofuels and Chemicals AB, Solvay SA, Stepan Co., Vertec Biosolvents Inc., and Somaiya Group. Also, the green and bio solvent market analysis report includes information on upcoming trends and challenges that will influence market growth. This is to help companies strategize and leverage all forthcoming growth opportunities.
The study was conducted using an objective combination of primary and secondary information including inputs from key participants in the industry. The report contains a comprehensive market and vendor landscape in addition to an analysis of the key vendors.
The publisher presents a detailed picture of the market by way of study, synthesis, and summation of data from multiple sources through an analysis of key parameters such as profit, pricing, competition, and promotions. It presents various market facets by identifying the key industry influencers. The data presented is comprehensive, reliable, and a result of extensive research - both primary and secondary. The market research reports provide a complete competitive landscape and an in-depth vendor selection methodology and analysis using qualitative and quantitative research to forecast accurate market growth.
Table of Contents
1 Executive Summary
- 1.1 Market overview
2 Market Landscape
- 2.1 Market ecosystem
3 Market Sizing
- 3.1 Market definition
- 3.2 Market segment analysis
- 3.3 Market size 2023
- 3.4 Market outlook: Forecast for 2023-2028
4 Historic Market Size
- 4.1 Global green and bio solvent market 2018 - 2022
- 4.2 Product Segment Analysis 2018 - 2022
- 4.3 Application Segment Analysis 2018 - 2022
- 4.4 Geography Segment Analysis 2018 - 2022
- 4.5 Country Segment Analysis 2018 - 2022
5 Five Forces Analysis
- 5.1 Five forces summary
- 5.2 Bargaining power of buyers
- 5.3 Bargaining power of suppliers
- 5.4 Threat of new entrants
- 5.5 Threat of substitutes
- 5.6 Threat of rivalry
- 5.7 Market condition
6 Market Segmentation by Product
- 6.1 Market segments
- 6.2 Comparison by Product
- 6.3 Lactate esters - Market size and forecast 2023-2028
- 6.4 Methyl soyate solvents - Market size and forecast 2023-2028
- 6.5 Alcohols - Market size and forecast 2023-2028
- 6.6 D-limonene - Market size and forecast 2023-2028
- 6.7 Others - Market size and forecast 2023-2028
- 6.8 Market opportunity by Product
7 Market Segmentation by Application
- 7.1 Market segments
- 7.2 Comparison by Application
- 7.3 Paints and coatings - Market size and forecast 2023-2028
- 7.4 Printing inks - Market size and forecast 2023-2028
- 7.5 Cleaning products - Market size and forecast 2023-2028
- 7.6 Adhesives and sealants - Market size and forecast 2023-2028
- 7.7 Others - Market size and forecast 2023-2028
- 7.8 Market opportunity by Application
8 Customer Landscape
- 8.1 Customer landscape overview
9 Geographic Landscape
- 9.1 Geographic segmentation
- 9.2 Geographic comparison
- 9.3 North America - Market size and forecast 2023-2028
- 9.4 Europe - Market size and forecast 2023-2028
- 9.5 APAC - Market size and forecast 2023-2028
- 9.6 South America - Market size and forecast 2023-2028
- 9.7 Middle East and Africa - Market size and forecast 2023-2028
- 9.8 US - Market size and forecast 2023-2028
- 9.9 China - Market size and forecast 2023-2028
- 9.10 Germany - Market size and forecast 2023-2028
- 9.11 UK - Market size and forecast 2023-2028
- 9.12 Canada - Market size and forecast 2023-2028
- 9.13 Market opportunity By Geographical Landscape
10 Drivers, Challenges, and Trends
- 10.1 Market drivers
- 10.2 Market challenges
- 10.3 Impact of drivers and challenges
- 10.4 Market trends
11 Vendor Landscape
- 11.1 Overview
- 11.2 Vendor landscape
- 11.3 Landscape disruption
- 11.4 Industry risks
12 Vendor Analysis
- 12.1 Vendors covered
- 12.2 Market positioning of vendors
- 12.3 Archer Daniels Midland Co.
- 12.4 BASF SE
- 12.5 Braskem SA
- 12.6 Cargill Inc.
- 12.7 Circa Group AS
- 12.8 Corbion NV
- 12.9 CREMER OLEO GmbH and Co. KG
- 12.10 DuPont de Nemours Inc.
- 12.11 Gevo Inc.
- 12.12 GFBio
- 12.13 Huntsman International LLC
- 12.14 India Glycols Ltd.
- 12.15 Solvay SA
- 12.16 Stepan Co.
- 12.17 Vertec Biosolvents Inc.
13 Appendix
- 13.1 Scope of the report
- 13.2 Inclusions and exclusions checklist
- 13.3 Currency conversion rates for US$
- 13.4 Research methodology
- 13.5 List of abbreviations

