|
|
市場調査レポート
商品コード
1762881
凍結乾燥装置の世界市場 2025~2029年Global Freeze Drying Equipment Market 2025-2029 |
||||||

|
|||||||
カスタマイズ可能
|
|||||||


| 凍結乾燥装置の世界市場 2025~2029年 |
|
出版日: 2025年06月27日
発行: TechNavio
ページ情報: 英文 226 Pages
納期: 即納可能
|

全表示
- 概要
- 図表
- 目次
凍結乾燥装置市場は2024~2029年に43億3,250万米ドル、予測期間中のCAGRは10.5%で成長すると予測されます。
当レポートでは、凍結乾燥装置市場の全体的な分析、市場規模・予測、動向、成長促進要因、課題、約25のベンダーを網羅したベンダー分析などを掲載しています。
現在の市場シナリオ、最新動向と促進要因、市場環境全体に関する最新分析を提供しています。市場は、凍結乾燥の技術的進歩、従来の乾燥に対する凍結乾燥の利点、バイオバンクの需要の高まりによって牽引されています。
| 市場範囲 | |
|---|---|
| 基準年 | 2025年 |
| 終了年 | 2029年 |
| 予測期間 | 2025~2029年 |
| 成長モメンタム | 加速 |
| 前年比 | 9.5% |
| CAGR | 10.5% |
| 増分額 | 43億3,250万米ドル |
本調査は、業界の主要参加者からのインプットを含め、一次情報と二次情報を客観的に組み合わせて実施しました。レポートには、主要企業の分析に加え、包括的な市場規模データ、地域別分析によるセグメント、ベンダー情勢が含まれています。レポートには過去データと予測データがあります。
本調査では、今後数年間の凍結乾燥装置市場の成長を牽引する主要因の一つとして、スマート凍結乾燥機を挙げています。また、凍結乾燥プロセス用のコンピュータモデリングや新しいソフトウェアの出現、凍結乾燥における制御核生成の需要の高まりは、市場の大きな需要につながります。
目次
第1章 エグゼクティブサマリー
- 市場概要
第2章 Technavio分析
- 価格・ライフサイクル・顧客購入バスケット・採用率・購入基準の分析
- インプットの重要性と差別化の要因
- 混乱の要因
- 促進要因と課題の影響
第3章 市場情勢
- 市場エコシステム
- 市場の特徴
- バリューチェーン分析
第4章 市場規模
- 市場の定義
- 市場セグメント分析
- 市場規模 2024年
- 市場の見通し 2024~2029年
第5章 市場規模実績
- 凍結乾燥装置の世界市場 2019~2023年
- 製品別セグメント分析 2019~2023年
- 用途別セグメント分析 2019~2023年
- 製品タイプ別セグメント分析 2019~2023年
- 地域別セグメント分析 2019~2023年
- 国別セグメント分析 2019~2023年
第6章 定性分析
- AIが世界の凍結乾燥装置市場に与える影響
第7章 ファイブフォース分析
- ファイブフォースの要約
- 買い手の交渉力
- 供給企業の交渉力
- 新規参入業者の脅威
- 代替品の脅威
- 競争の脅威
- 市況
第8章 市場セグメンテーション:製品別
- 市場セグメント
- 比較:製品別
- トレイスタイル:市場規模と予測 2024~2029年
- マニホールド:市場規模と予測 2024~2029年
- ロータリー:市場規模と予測 2024~2029年
- 市場機会:製品別
第9章 市場セグメンテーション:用途別
- 市場セグメント
- 比較:用途別
- バイオテクノロジー:市場規模と予測 2024~2029年
- 食品加工:市場規模と予測 2024~2029年
- 医薬品:市場規模と予測 2024~2029年
- 外科手術:市場規模と予測 2024~2029年
- その他:市場規模と予測 2024~2029年
- 市場機会:用途別
第10章 市場セグメンテーション:製品タイプ別
- 市場セグメント
- 比較:製品タイプ別
- 工業用凍結乾燥機:市場規模と予測 2024~2029年
- 真空凍結乾燥機:市場規模と予測 2024~2029年
- 実験室用凍結乾燥機:市場規模と予測 2024~2029年
- その他:市場規模と予測 2024~2029年
- 市場機会:製品タイプ別
第11章 顧客情勢
- 顧客情勢の概要
第12章 地域別情勢
- 地域別セグメンテーション
- 地域別比較
- 欧州:市場規模と予測 2024~2029年
- アジア太平洋:市場規模と予測 2024~2029年
- 北米:市場規模と予測 2024~2029年
- 南米:市場規模と予測 2024~2029年
- 中東・アフリカ:市場規模と予測 2024~2029年
- 米国:市場規模と予測 2024~2029年
- 中国:市場規模と予測 2024~2029年
- ドイツ:市場規模と予測 2024~2029年
- 英国:市場規模と予測 2024~2029年
- フランス:市場規模と予測 2024~2029年
- イタリア:市場規模と予測 2024~2029年
- カナダ:市場規模と予測 2024~2029年
- インド:市場規模と予測 2024~2029年
- 日本:市場規模と予測 2024~2029年
- スペイン:市場規模と予測 2024~2029年
- 市場機会:地域情勢別
第13章 促進要因・課題・機会・抑制要因
- 市場促進要因
- 市場の課題
- 促進要因と課題の影響
- 市場の機会・抑制要因
第14章 競合情勢
- 概要
- 競合情勢
- 混乱の状況
- 業界のリスク
第15章 競合分析
- 企業プロファイル
- 企業ランキング指数
- 企業の市場ポジショニング
- Azbil Telstar SL
- Biopharma Process Systems Ltd.
- BUCHI Labortechnik AG
- COOLVACUUM TECHNOLOGIES S.L
- Cuddon Freeze Dry
- GEA Group AG
- HOF Sonderanlagenbau GmbH
- IMA Industria Macchine Automatiche Spa
- Labconco Corp.
- Martin Christ Gefriertrocknungsanlagen GmbH
- MechaTech Systems Ltd.
- Millrock Technology Inc.
- OPTIMA packaging group GmbH
- Shanghai Tofflon Science and Technology Co. Ltd.
- ZIRBUS technology GmbH
第16章 付録
Exhibits:
- Exhibits1: Executive Summary - Chart on Market Overview
- Exhibits2: Executive Summary - Data Table on Market Overview
- Exhibits3: Executive Summary - Chart on Global Market Characteristics
- Exhibits4: Executive Summary - Chart on Market By Geographical Landscape
- Exhibits5: Executive Summary - Chart on Market Segmentation by Product
- Exhibits6: Executive Summary - Chart on Market Segmentation by Application
- Exhibits7: Executive Summary - Chart on Market Segmentation by Product Type
- Exhibits8: Executive Summary - Chart on Incremental Growth
- Exhibits9: Executive Summary - Data Table on Incremental Growth
- Exhibits10: Executive Summary - Chart on Company Market Positioning
- Exhibits11: Analysis of price sensitivity, lifecycle, customer purchase basket, adoption rates, and purchase criteria
- Exhibits12: Overview on criticality of inputs and factors of differentiation
- Exhibits13: Overview on factors of disruption
- Exhibits14: Impact of drivers and challenges in 2024 and 2029
- Exhibits15: Parent Market
- Exhibits16: Data Table on - Parent Market
- Exhibits17: Market characteristics analysis
- Exhibits18: Value chain analysis
- Exhibits19: Offerings of companies included in the market definition
- Exhibits20: Market segments
- Exhibits21: Chart on Global - Market size and forecast 2024-2029 ($ million)
- Exhibits22: Data Table on Global - Market size and forecast 2024-2029 ($ million)
- Exhibits23: Chart on Global Market: Year-over-year growth 2024-2029 (%)
- Exhibits24: Data Table on Global Market: Year-over-year growth 2024-2029 (%)
- Exhibits25: Historic Market Size - Data Table on Global Freeze Drying Equipment Market 2019 - 2023 ($ million)
- Exhibits26: Historic Market Size - Product Segment 2019 - 2023 ($ million)
- Exhibits27: Historic Market Size - Application Segment 2019 - 2023 ($ million)
- Exhibits28: Historic Market Size - Product Type Segment 2019 - 2023 ($ million)
- Exhibits29: Historic Market Size - Geography Segment 2019 - 2023 ($ million)
- Exhibits30: Historic Market Size - Country Segment 2019 - 2023 ($ million)
- Exhibits31: Five forces analysis - Comparison between 2024 and 2029
- Exhibits32: Bargaining power of buyers - Impact of key factors 2024 and 2029
- Exhibits33: Bargaining power of suppliers - Impact of key factors in 2024 and 2029
- Exhibits34: Threat of new entrants - Impact of key factors in 2024 and 2029
- Exhibits35: Threat of substitutes - Impact of key factors in 2024 and 2029
- Exhibits36: Threat of rivalry - Impact of key factors in 2024 and 2029
- Exhibits37: Chart on Market condition - Five forces 2024 and 2029
- Exhibits38: Chart on Product - Market share 2024-2029 (%)
- Exhibits39: Data Table on Product - Market share 2024-2029 (%)
- Exhibits40: Chart on Comparison by Product
- Exhibits41: Data Table on Comparison by Product
- Exhibits42: Chart on Tray style - Market size and forecast 2024-2029 ($ million)
- Exhibits43: Data Table on Tray style - Market size and forecast 2024-2029 ($ million)
- Exhibits44: Chart on Tray style - Year-over-year growth 2024-2029 (%)
- Exhibits45: Data Table on Tray style - Year-over-year growth 2024-2029 (%)
- Exhibits46: Chart on Manifold - Market size and forecast 2024-2029 ($ million)
- Exhibits47: Data Table on Manifold - Market size and forecast 2024-2029 ($ million)
- Exhibits48: Chart on Manifold - Year-over-year growth 2024-2029 (%)
- Exhibits49: Data Table on Manifold - Year-over-year growth 2024-2029 (%)
- Exhibits50: Chart on Rotary - Market size and forecast 2024-2029 ($ million)
- Exhibits51: Data Table on Rotary - Market size and forecast 2024-2029 ($ million)
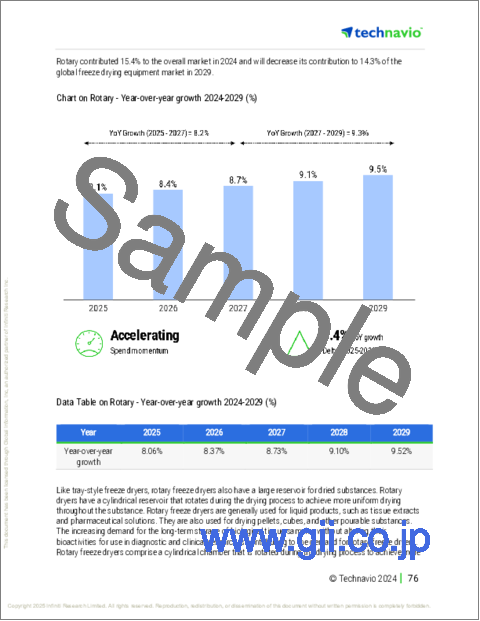
- Exhibits52: Chart on Rotary - Year-over-year growth 2024-2029 (%)
- Exhibits53: Data Table on Rotary - Year-over-year growth 2024-2029 (%)
- Exhibits54: Market opportunity by Product ($ million)
- Exhibits55: Data Table on Market opportunity by Product ($ million)
- Exhibits56: Chart on Application - Market share 2024-2029 (%)
- Exhibits57: Data Table on Application - Market share 2024-2029 (%)
- Exhibits58: Chart on Comparison by Application
- Exhibits59: Data Table on Comparison by Application
- Exhibits60: Chart on Biotechnology - Market size and forecast 2024-2029 ($ million)
- Exhibits61: Data Table on Biotechnology - Market size and forecast 2024-2029 ($ million)
- Exhibits62: Chart on Biotechnology - Year-over-year growth 2024-2029 (%)
- Exhibits63: Data Table on Biotechnology - Year-over-year growth 2024-2029 (%)
- Exhibits64: Chart on Food processing - Market size and forecast 2024-2029 ($ million)
- Exhibits65: Data Table on Food processing - Market size and forecast 2024-2029 ($ million)
- Exhibits66: Chart on Food processing - Year-over-year growth 2024-2029 (%)
- Exhibits67: Data Table on Food processing - Year-over-year growth 2024-2029 (%)
- Exhibits68: Chart on Pharmaceuticals - Market size and forecast 2024-2029 ($ million)
- Exhibits69: Data Table on Pharmaceuticals - Market size and forecast 2024-2029 ($ million)
- Exhibits70: Chart on Pharmaceuticals - Year-over-year growth 2024-2029 (%)
- Exhibits71: Data Table on Pharmaceuticals - Year-over-year growth 2024-2029 (%)
- Exhibits72: Chart on Surgical procedures - Market size and forecast 2024-2029 ($ million)
- Exhibits73: Data Table on Surgical procedures - Market size and forecast 2024-2029 ($ million)
- Exhibits74: Chart on Surgical procedures - Year-over-year growth 2024-2029 (%)
- Exhibits75: Data Table on Surgical procedures - Year-over-year growth 2024-2029 (%)
- Exhibits76: Chart on Others - Market size and forecast 2024-2029 ($ million)
- Exhibits77: Data Table on Others - Market size and forecast 2024-2029 ($ million)
- Exhibits78: Chart on Others - Year-over-year growth 2024-2029 (%)
- Exhibits79: Data Table on Others - Year-over-year growth 2024-2029 (%)
- Exhibits80: Market opportunity by Application ($ million)
- Exhibits81: Data Table on Market opportunity by Application ($ million)
- Exhibits82: Chart on Product Type - Market share 2024-2029 (%)
- Exhibits83: Data Table on Product Type - Market share 2024-2029 (%)
- Exhibits84: Chart on Comparison by Product Type
- Exhibits85: Data Table on Comparison by Product Type
- Exhibits86: Chart on Industrial freeze dryers - Market size and forecast 2024-2029 ($ million)
- Exhibits87: Data Table on Industrial freeze dryers - Market size and forecast 2024-2029 ($ million)
- Exhibits88: Chart on Industrial freeze dryers - Year-over-year growth 2024-2029 (%)
- Exhibits89: Data Table on Industrial freeze dryers - Year-over-year growth 2024-2029 (%)
- Exhibits90: Chart on Vacuum freeze dryers - Market size and forecast 2024-2029 ($ million)
- Exhibits91: Data Table on Vacuum freeze dryers - Market size and forecast 2024-2029 ($ million)
- Exhibits92: Chart on Vacuum freeze dryers - Year-over-year growth 2024-2029 (%)
- Exhibits93: Data Table on Vacuum freeze dryers - Year-over-year growth 2024-2029 (%)
- Exhibits94: Chart on Laboratory freeze dryers - Market size and forecast 2024-2029 ($ million)
- Exhibits95: Data Table on Laboratory freeze dryers - Market size and forecast 2024-2029 ($ million)
- Exhibits96: Chart on Laboratory freeze dryers - Year-over-year growth 2024-2029 (%)
- Exhibits97: Data Table on Laboratory freeze dryers - Year-over-year growth 2024-2029 (%)
- Exhibits98: Chart on Others - Market size and forecast 2024-2029 ($ million)
- Exhibits99: Data Table on Others - Market size and forecast 2024-2029 ($ million)
- Exhibits100: Chart on Others - Year-over-year growth 2024-2029 (%)
- Exhibits101: Data Table on Others - Year-over-year growth 2024-2029 (%)
- Exhibits102: Market opportunity by Product Type ($ million)
- Exhibits103: Data Table on Market opportunity by Product Type ($ million)
- Exhibits104: Analysis of price sensitivity, lifecycle, customer purchase basket, adoption rates, and purchase criteria
- Exhibits105: Chart on Market share By Geographical Landscape 2024-2029 (%)
- Exhibits106: Data Table on Market share By Geographical Landscape 2024-2029 (%)
- Exhibits107: Chart on Geographic comparison
- Exhibits108: Data Table on Geographic comparison
- Exhibits109: Chart on Europe - Market size and forecast 2024-2029 ($ million)
- Exhibits110: Data Table on Europe - Market size and forecast 2024-2029 ($ million)
- Exhibits111: Chart on Europe - Year-over-year growth 2024-2029 (%)
- Exhibits112: Data Table on Europe - Year-over-year growth 2024-2029 (%)
- Exhibits113: Chart on APAC - Market size and forecast 2024-2029 ($ million)
- Exhibits114: Data Table on APAC - Market size and forecast 2024-2029 ($ million)
- Exhibits115: Chart on APAC - Year-over-year growth 2024-2029 (%)
- Exhibits116: Data Table on APAC - Year-over-year growth 2024-2029 (%)
- Exhibits117: Chart on North America - Market size and forecast 2024-2029 ($ million)
- Exhibits118: Data Table on North America - Market size and forecast 2024-2029 ($ million)
- Exhibits119: Chart on North America - Year-over-year growth 2024-2029 (%)
- Exhibits120: Data Table on North America - Year-over-year growth 2024-2029 (%)
- Exhibits121: Chart on South America - Market size and forecast 2024-2029 ($ million)
- Exhibits122: Data Table on South America - Market size and forecast 2024-2029 ($ million)
- Exhibits123: Chart on South America - Year-over-year growth 2024-2029 (%)
- Exhibits124: Data Table on South America - Year-over-year growth 2024-2029 (%)
- Exhibits125: Chart on Middle East and Africa - Market size and forecast 2024-2029 ($ million)
- Exhibits126: Data Table on Middle East and Africa - Market size and forecast 2024-2029 ($ million)
- Exhibits127: Chart on Middle East and Africa - Year-over-year growth 2024-2029 (%)
- Exhibits128: Data Table on Middle East and Africa - Year-over-year growth 2024-2029 (%)
- Exhibits129: Chart on US - Market size and forecast 2024-2029 ($ million)
- Exhibits130: Data Table on US - Market size and forecast 2024-2029 ($ million)
- Exhibits131: Chart on US - Year-over-year growth 2024-2029 (%)
- Exhibits132: Data Table on US - Year-over-year growth 2024-2029 (%)
- Exhibits133: Chart on China - Market size and forecast 2024-2029 ($ million)
- Exhibits134: Data Table on China - Market size and forecast 2024-2029 ($ million)
- Exhibits135: Chart on China - Year-over-year growth 2024-2029 (%)
- Exhibits136: Data Table on China - Year-over-year growth 2024-2029 (%)
- Exhibits137: Chart on Germany - Market size and forecast 2024-2029 ($ million)
- Exhibits138: Data Table on Germany - Market size and forecast 2024-2029 ($ million)
- Exhibits139: Chart on Germany - Year-over-year growth 2024-2029 (%)
- Exhibits140: Data Table on Germany - Year-over-year growth 2024-2029 (%)
- Exhibits141: Chart on UK - Market size and forecast 2024-2029 ($ million)
- Exhibits142: Data Table on UK - Market size and forecast 2024-2029 ($ million)
- Exhibits143: Chart on UK - Year-over-year growth 2024-2029 (%)
- Exhibits144: Data Table on UK - Year-over-year growth 2024-2029 (%)
- Exhibits145: Chart on France - Market size and forecast 2024-2029 ($ million)
- Exhibits146: Data Table on France - Market size and forecast 2024-2029 ($ million)
- Exhibits147: Chart on France - Year-over-year growth 2024-2029 (%)
- Exhibits148: Data Table on France - Year-over-year growth 2024-2029 (%)
- Exhibits149: Chart on Italy - Market size and forecast 2024-2029 ($ million)
- Exhibits150: Data Table on Italy - Market size and forecast 2024-2029 ($ million)
- Exhibits151: Chart on Italy - Year-over-year growth 2024-2029 (%)
- Exhibits152: Data Table on Italy - Year-over-year growth 2024-2029 (%)
- Exhibits153: Chart on Canada - Market size and forecast 2024-2029 ($ million)
- Exhibits154: Data Table on Canada - Market size and forecast 2024-2029 ($ million)
- Exhibits155: Chart on Canada - Year-over-year growth 2024-2029 (%)
- Exhibits156: Data Table on Canada - Year-over-year growth 2024-2029 (%)
- Exhibits157: Chart on India - Market size and forecast 2024-2029 ($ million)
- Exhibits158: Data Table on India - Market size and forecast 2024-2029 ($ million)
- Exhibits159: Chart on India - Year-over-year growth 2024-2029 (%)
- Exhibits160: Data Table on India - Year-over-year growth 2024-2029 (%)
- Exhibits161: Chart on Japan - Market size and forecast 2024-2029 ($ million)
- Exhibits162: Data Table on Japan - Market size and forecast 2024-2029 ($ million)
- Exhibits163: Chart on Japan - Year-over-year growth 2024-2029 (%)
- Exhibits164: Data Table on Japan - Year-over-year growth 2024-2029 (%)
- Exhibits165: Chart on Spain - Market size and forecast 2024-2029 ($ million)
- Exhibits166: Data Table on Spain - Market size and forecast 2024-2029 ($ million)
- Exhibits167: Chart on Spain - Year-over-year growth 2024-2029 (%)
- Exhibits168: Data Table on Spain - Year-over-year growth 2024-2029 (%)
- Exhibits169: Market opportunity By Geographical Landscape ($ million)
- Exhibits170: Data Tables on Market opportunity By Geographical Landscape ($ million)
- Exhibits171: Impact of drivers and challenges in 2024 and 2029
- Exhibits172: Overview on criticality of inputs and factors of differentiation
- Exhibits173: Overview on factors of disruption
- Exhibits174: Impact of key risks on business
- Exhibits175: Companies covered
- Exhibits176: Company ranking index
- Exhibits177: Matrix on companies position and classification
- Exhibits178: Azbil Telstar SL - Overview
- Exhibits179: Azbil Telstar SL - Product / Service
- Exhibits180: Azbil Telstar SL - Key offerings
- Exhibits181: SWOT
- Exhibits182: Biopharma Process Systems Ltd. - Overview
- Exhibits183: Biopharma Process Systems Ltd. - Product / Service
- Exhibits184: Biopharma Process Systems Ltd. - Key offerings
- Exhibits185: SWOT
- Exhibits186: BUCHI Labortechnik AG - Overview
- Exhibits187: BUCHI Labortechnik AG - Product / Service
- Exhibits188: BUCHI Labortechnik AG - Key offerings
- Exhibits189: SWOT
- Exhibits190: COOLVACUUM TECHNOLOGIES S.L - Overview
- Exhibits191: COOLVACUUM TECHNOLOGIES S.L - Product / Service
- Exhibits192: COOLVACUUM TECHNOLOGIES S.L - Key offerings
- Exhibits193: SWOT
- Exhibits194: Cuddon Freeze Dry - Overview
- Exhibits195: Cuddon Freeze Dry - Product / Service
- Exhibits196: Cuddon Freeze Dry - Key offerings
- Exhibits197: SWOT
- Exhibits198: GEA Group AG - Overview
- Exhibits199: GEA Group AG - Business segments
- Exhibits200: GEA Group AG - Key offerings
- Exhibits201: GEA Group AG - Segment focus
- Exhibits202: SWOT
- Exhibits203: HOF Sonderanlagenbau GmbH - Overview
- Exhibits204: HOF Sonderanlagenbau GmbH - Product / Service
- Exhibits205: HOF Sonderanlagenbau GmbH - Key offerings
- Exhibits206: SWOT
- Exhibits207: IMA Industria Macchine Automatiche Spa - Overview
- Exhibits208: IMA Industria Macchine Automatiche Spa - Product / Service
- Exhibits209: IMA Industria Macchine Automatiche Spa - Key offerings
- Exhibits210: SWOT
- Exhibits211: Labconco Corp. - Overview
- Exhibits212: Labconco Corp. - Product / Service
- Exhibits213: Labconco Corp. - Key offerings
- Exhibits214: SWOT
- Exhibits215: Martin Christ Gefriertrocknungsanlagen GmbH - Overview
- Exhibits216: Martin Christ Gefriertrocknungsanlagen GmbH - Product / Service
- Exhibits217: Martin Christ Gefriertrocknungsanlagen GmbH - Key offerings
- Exhibits218: SWOT
- Exhibits219: MechaTech Systems Ltd. - Overview
- Exhibits220: MechaTech Systems Ltd. - Product / Service
- Exhibits221: MechaTech Systems Ltd. - Key offerings
- Exhibits222: SWOT
- Exhibits223: Millrock Technology Inc. - Overview
- Exhibits224: Millrock Technology Inc. - Product / Service
- Exhibits225: Millrock Technology Inc. - Key offerings
- Exhibits226: SWOT
- Exhibits227: OPTIMA packaging group GmbH - Overview
- Exhibits228: OPTIMA packaging group GmbH - Product / Service
- Exhibits229: OPTIMA packaging group GmbH - Key offerings
- Exhibits230: SWOT
- Exhibits231: Shanghai Tofflon Science and Technology Co. Ltd. - Overview
- Exhibits232: Shanghai Tofflon Science and Technology Co. Ltd. - Product / Service
- Exhibits233: Shanghai Tofflon Science and Technology Co. Ltd. - Key offerings
- Exhibits234: SWOT
- Exhibits235: ZIRBUS technology GmbH - Overview
- Exhibits236: ZIRBUS technology GmbH - Product / Service
- Exhibits237: ZIRBUS technology GmbH - Key offerings
- Exhibits238: SWOT
- Exhibits239: Inclusions checklist
- Exhibits240: Exclusions checklist
- Exhibits241: Currency conversion rates for US$
- Exhibits242: Research methodology
- Exhibits243: Information sources
- Exhibits244: Data validation
- Exhibits245: Validation techniques employed for market sizing
- Exhibits246: Data synthesis
- Exhibits247: 360 degree market analysis
- Exhibits248: List of abbreviations
The freeze drying equipment market is forecasted to grow by USD 4,332.5 mn during 2024-2029, accelerating at a CAGR of 10.5% during the forecast period. The report on the freeze drying equipment market provides a holistic analysis, market size and forecast, trends, growth drivers, and challenges, as well as vendor analysis covering around 25 vendors.
The report offers an up-to-date analysis regarding the current market scenario, the latest trends and drivers, and the overall market environment. The market is driven by technological advances in freeze-drying, advantages of freeze-drying over conventional drying, and rising demand for biobanks.
| Market Scope | |
|---|---|
| Base Year | 2025 |
| End Year | 2029 |
| Series Year | 2025-2029 |
| Growth Momentum | Accelerate |
| YOY 2025 | 9.5% |
| CAGR | 10.5% |
| Incremental Value | $4,332.5 mn |
The study was conducted using an objective combination of primary and secondary information including inputs from key participants in the industry. The report contains a comprehensive market size data, segment with regional analysis and vendor landscape in addition to an analysis of the key companies. Reports have historic and forecast data.
Technavio's freeze drying equipment market is segmented as below:
By Product
- Tray style
- Manifold
- Rotary
By Application
- Biotechnology
- Food processing
- Pharmaceuticals
- Surgical procedures
- Others
By Product Type
- Industrial freeze dryers
- Vacuum freeze dryers
- Laboratory freeze dryers
- Others
By Geographical Landscape
- Europe
- APAC
- North America
- South America
- Middle East and Africa
This study identifies the smart freeze dryers as one of the prime reasons driving the freeze drying equipment market growth during the next few years. Also, emergence of computer modeling and new software for freeze-drying process and rise in demand for controlled nucleation in freeze-drying will lead to sizable demand in the market.
The report on the freeze drying equipment market covers the following areas:
- Freeze Drying Equipment Market sizing
- Freeze Drying Equipment Market forecast
- Freeze Drying Equipment Market industry analysis
The robust vendor analysis is designed to help clients improve their market position, and in line with this, this report provides a detailed analysis of several leading freeze drying equipment market vendors that include Azbil Telstar SL, Biopharma Process Systems Ltd., BUCHI Labortechnik AG, COOLVACUUM TECHNOLOGIES S.L, Cuddon Freeze Dry, Freeze Drying Systems Pvt. Ltd., GEA Group AG, HOF Sonderanlagenbau GmbH, IMA Industria Macchine Automatiche Spa, Labconco Corp., Lyophilization Systems India Pvt Ltd., Martin Christ Gefriertrocknungsanlagen GmbH, MechaTech Systems Ltd., Millrock Technology Inc., OPTIMA packaging group GmbH, Shanghai Tofflon Science and Technology Co. Ltd., and ZIRBUS technology GmbH. Also, the freeze drying equipment market analysis report includes information on upcoming trends and challenges that will influence market growth. This is to help companies strategize and leverage all forthcoming growth opportunities.
The publisher presents a detailed picture of the market by the way of study, synthesis, and summation of data from multiple sources by an analysis of key parameters such as profit, pricing, competition, and promotions. It presents various market facets by identifying the key industry influencers. The data presented is comprehensive, reliable, and a result of extensive primary and secondary research. The market research reports provide a complete competitive landscape and an in-depth vendor selection methodology and analysis using qualitative and quantitative research to forecast accurate market growth.
Table of Contents
1 Executive Summary
- 1.1 Market overview
- Executive Summary - Chart on Market Overview
- Executive Summary - Data Table on Market Overview
- Executive Summary - Chart on Global Market Characteristics
- Executive Summary - Chart on Market By Geographical Landscape
- Executive Summary - Chart on Market Segmentation by Product
- Executive Summary - Chart on Market Segmentation by Application
- Executive Summary - Chart on Market Segmentation by Product Type
- Executive Summary - Chart on Incremental Growth
- Executive Summary - Data Table on Incremental Growth
- Executive Summary - Chart on Company Market Positioning
2 Technavio Analysis
- 2.1 Analysis of price sensitivity, lifecycle, customer purchase basket, adoption rates, and purchase criteria
- Analysis of price sensitivity, lifecycle, customer purchase basket, adoption rates, and purchase criteria
- 2.2 Criticality of inputs and Factors of differentiation
- Overview on criticality of inputs and factors of differentiation
- 2.3 Factors of disruption
- Overview on factors of disruption
- 2.4 Impact of drivers and challenges
- Impact of drivers and challenges in 2024 and 2029
3 Market Landscape
- 3.1 Market ecosystem
- Parent Market
- Data Table on - Parent Market
- 3.2 Market characteristics
- Market characteristics analysis
- 3.3 Value chain analysis
- Value chain analysis
4 Market Sizing
- 4.1 Market definition
- Offerings of companies included in the market definition
- 4.2 Market segment analysis
- Market segments
- 4.3 Market size 2024
- 4.4 Market outlook: Forecast for 2024-2029
- Chart on Global - Market size and forecast 2024-2029 ($ million)
- Data Table on Global - Market size and forecast 2024-2029 ($ million)
- Chart on Global Market: Year-over-year growth 2024-2029 (%)
- Data Table on Global Market: Year-over-year growth 2024-2029 (%)
5 Historic Market Size
- 5.1 Global Freeze Drying Equipment Market 2019 - 2023
- Historic Market Size - Data Table on Global Freeze Drying Equipment Market 2019 - 2023 ($ million)
- 5.2 Product segment analysis 2019 - 2023
- Historic Market Size - Product Segment 2019 - 2023 ($ million)
- 5.3 Application segment analysis 2019 - 2023
- Historic Market Size - Application Segment 2019 - 2023 ($ million)
- 5.4 Product Type segment analysis 2019 - 2023
- Historic Market Size - Product Type Segment 2019 - 2023 ($ million)
- 5.5 Geography segment analysis 2019 - 2023
- Historic Market Size - Geography Segment 2019 - 2023 ($ million)
- 5.6 Country segment analysis 2019 - 2023
- Historic Market Size - Country Segment 2019 - 2023 ($ million)
6 Qualitative Analysis
- 6.1 Impact of AI on global freeze-drying equipment market
7 Five Forces Analysis
- 7.1 Five forces summary
- Five forces analysis - Comparison between 2024 and 2029
- 7.2 Bargaining power of buyers
- Bargaining power of buyers - Impact of key factors 2024 and 2029
- 7.3 Bargaining power of suppliers
- Bargaining power of suppliers - Impact of key factors in 2024 and 2029
- 7.4 Threat of new entrants
- Threat of new entrants - Impact of key factors in 2024 and 2029
- 7.5 Threat of substitutes
- Threat of substitutes - Impact of key factors in 2024 and 2029
- 7.6 Threat of rivalry
- Threat of rivalry - Impact of key factors in 2024 and 2029
- 7.7 Market condition
- Chart on Market condition - Five forces 2024 and 2029
8 Market Segmentation by Product
- 8.1 Market segments
- Chart on Product - Market share 2024-2029 (%)
- Data Table on Product - Market share 2024-2029 (%)
- 8.2 Comparison by Product
- Chart on Comparison by Product
- Data Table on Comparison by Product
- 8.3 Tray style - Market size and forecast 2024-2029
- Chart on Tray style - Market size and forecast 2024-2029 ($ million)
- Data Table on Tray style - Market size and forecast 2024-2029 ($ million)
- Chart on Tray style - Year-over-year growth 2024-2029 (%)
- Data Table on Tray style - Year-over-year growth 2024-2029 (%)
- 8.4 Manifold - Market size and forecast 2024-2029
- Chart on Manifold - Market size and forecast 2024-2029 ($ million)
- Data Table on Manifold - Market size and forecast 2024-2029 ($ million)
- Chart on Manifold - Year-over-year growth 2024-2029 (%)
- Data Table on Manifold - Year-over-year growth 2024-2029 (%)
- 8.5 Rotary - Market size and forecast 2024-2029
- Chart on Rotary - Market size and forecast 2024-2029 ($ million)
- Data Table on Rotary - Market size and forecast 2024-2029 ($ million)
- Chart on Rotary - Year-over-year growth 2024-2029 (%)
- Data Table on Rotary - Year-over-year growth 2024-2029 (%)
- 8.6 Market opportunity by Product
- Market opportunity by Product ($ million)
- Data Table on Market opportunity by Product ($ million)
9 Market Segmentation by Application
- 9.1 Market segments
- Chart on Application - Market share 2024-2029 (%)
- Data Table on Application - Market share 2024-2029 (%)
- 9.2 Comparison by Application
- Chart on Comparison by Application
- Data Table on Comparison by Application
- 9.3 Biotechnology - Market size and forecast 2024-2029
- Chart on Biotechnology - Market size and forecast 2024-2029 ($ million)
- Data Table on Biotechnology - Market size and forecast 2024-2029 ($ million)
- Chart on Biotechnology - Year-over-year growth 2024-2029 (%)
- Data Table on Biotechnology - Year-over-year growth 2024-2029 (%)
- 9.4 Food processing - Market size and forecast 2024-2029
- Chart on Food processing - Market size and forecast 2024-2029 ($ million)
- Data Table on Food processing - Market size and forecast 2024-2029 ($ million)
- Chart on Food processing - Year-over-year growth 2024-2029 (%)
- Data Table on Food processing - Year-over-year growth 2024-2029 (%)
- 9.5 Pharmaceuticals - Market size and forecast 2024-2029
- Chart on Pharmaceuticals - Market size and forecast 2024-2029 ($ million)
- Data Table on Pharmaceuticals - Market size and forecast 2024-2029 ($ million)
- Chart on Pharmaceuticals - Year-over-year growth 2024-2029 (%)
- Data Table on Pharmaceuticals - Year-over-year growth 2024-2029 (%)
- 9.6 Surgical procedures - Market size and forecast 2024-2029
- Chart on Surgical procedures - Market size and forecast 2024-2029 ($ million)
- Data Table on Surgical procedures - Market size and forecast 2024-2029 ($ million)
- Chart on Surgical procedures - Year-over-year growth 2024-2029 (%)
- Data Table on Surgical procedures - Year-over-year growth 2024-2029 (%)
- 9.7 Others - Market size and forecast 2024-2029
- Chart on Others - Market size and forecast 2024-2029 ($ million)
- Data Table on Others - Market size and forecast 2024-2029 ($ million)
- Chart on Others - Year-over-year growth 2024-2029 (%)
- Data Table on Others - Year-over-year growth 2024-2029 (%)
- 9.8 Market opportunity by Application
- Market opportunity by Application ($ million)
- Data Table on Market opportunity by Application ($ million)
10 Market Segmentation by Product Type
- 10.1 Market segments
- Chart on Product Type - Market share 2024-2029 (%)
- Data Table on Product Type - Market share 2024-2029 (%)
- 10.2 Comparison by Product Type
- Chart on Comparison by Product Type
- Data Table on Comparison by Product Type
- 10.3 Industrial freeze dryers - Market size and forecast 2024-2029
- Chart on Industrial freeze dryers - Market size and forecast 2024-2029 ($ million)
- Data Table on Industrial freeze dryers - Market size and forecast 2024-2029 ($ million)
- Chart on Industrial freeze dryers - Year-over-year growth 2024-2029 (%)
- Data Table on Industrial freeze dryers - Year-over-year growth 2024-2029 (%)
- 10.4 Vacuum freeze dryers - Market size and forecast 2024-2029
- Chart on Vacuum freeze dryers - Market size and forecast 2024-2029 ($ million)
- Data Table on Vacuum freeze dryers - Market size and forecast 2024-2029 ($ million)
- Chart on Vacuum freeze dryers - Year-over-year growth 2024-2029 (%)
- Data Table on Vacuum freeze dryers - Year-over-year growth 2024-2029 (%)
- 10.5 Laboratory freeze dryers - Market size and forecast 2024-2029
- Chart on Laboratory freeze dryers - Market size and forecast 2024-2029 ($ million)
- Data Table on Laboratory freeze dryers - Market size and forecast 2024-2029 ($ million)
- Chart on Laboratory freeze dryers - Year-over-year growth 2024-2029 (%)
- Data Table on Laboratory freeze dryers - Year-over-year growth 2024-2029 (%)
- 10.6 Others - Market size and forecast 2024-2029
- Chart on Others - Market size and forecast 2024-2029 ($ million)
- Data Table on Others - Market size and forecast 2024-2029 ($ million)
- Chart on Others - Year-over-year growth 2024-2029 (%)
- Data Table on Others - Year-over-year growth 2024-2029 (%)
- 10.7 Market opportunity by Product Type
- Market opportunity by Product Type ($ million)
- Data Table on Market opportunity by Product Type ($ million)
11 Customer Landscape
- 11.1 Customer landscape overview
- Analysis of price sensitivity, lifecycle, customer purchase basket, adoption rates, and purchase criteria
12 Geographic Landscape
- 12.1 Geographic segmentation
- Chart on Market share By Geographical Landscape 2024-2029 (%)
- Data Table on Market share By Geographical Landscape 2024-2029 (%)
- 12.2 Geographic comparison
- Chart on Geographic comparison
- Data Table on Geographic comparison
- 12.3 Europe - Market size and forecast 2024-2029
- Chart on Europe - Market size and forecast 2024-2029 ($ million)
- Data Table on Europe - Market size and forecast 2024-2029 ($ million)
- Chart on Europe - Year-over-year growth 2024-2029 (%)
- Data Table on Europe - Year-over-year growth 2024-2029 (%)
- 12.4 APAC - Market size and forecast 2024-2029
- Chart on APAC - Market size and forecast 2024-2029 ($ million)
- Data Table on APAC - Market size and forecast 2024-2029 ($ million)
- Chart on APAC - Year-over-year growth 2024-2029 (%)
- Data Table on APAC - Year-over-year growth 2024-2029 (%)
- 12.5 North America - Market size and forecast 2024-2029
- Chart on North America - Market size and forecast 2024-2029 ($ million)
- Data Table on North America - Market size and forecast 2024-2029 ($ million)
- Chart on North America - Year-over-year growth 2024-2029 (%)
- Data Table on North America - Year-over-year growth 2024-2029 (%)
- 12.6 South America - Market size and forecast 2024-2029
- Chart on South America - Market size and forecast 2024-2029 ($ million)
- Data Table on South America - Market size and forecast 2024-2029 ($ million)
- Chart on South America - Year-over-year growth 2024-2029 (%)
- Data Table on South America - Year-over-year growth 2024-2029 (%)
- 12.7 Middle East and Africa - Market size and forecast 2024-2029
- Chart on Middle East and Africa - Market size and forecast 2024-2029 ($ million)
- Data Table on Middle East and Africa - Market size and forecast 2024-2029 ($ million)
- Chart on Middle East and Africa - Year-over-year growth 2024-2029 (%)
- Data Table on Middle East and Africa - Year-over-year growth 2024-2029 (%)
- 12.8 US - Market size and forecast 2024-2029
- Chart on US - Market size and forecast 2024-2029 ($ million)
- Data Table on US - Market size and forecast 2024-2029 ($ million)
- Chart on US - Year-over-year growth 2024-2029 (%)
- Data Table on US - Year-over-year growth 2024-2029 (%)
- 12.9 China - Market size and forecast 2024-2029
- Chart on China - Market size and forecast 2024-2029 ($ million)
- Data Table on China - Market size and forecast 2024-2029 ($ million)
- Chart on China - Year-over-year growth 2024-2029 (%)
- Data Table on China - Year-over-year growth 2024-2029 (%)
- 12.10 Germany - Market size and forecast 2024-2029
- Chart on Germany - Market size and forecast 2024-2029 ($ million)
- Data Table on Germany - Market size and forecast 2024-2029 ($ million)
- Chart on Germany - Year-over-year growth 2024-2029 (%)
- Data Table on Germany - Year-over-year growth 2024-2029 (%)
- 12.11 UK - Market size and forecast 2024-2029
- Chart on UK - Market size and forecast 2024-2029 ($ million)
- Data Table on UK - Market size and forecast 2024-2029 ($ million)
- Chart on UK - Year-over-year growth 2024-2029 (%)
- Data Table on UK - Year-over-year growth 2024-2029 (%)
- 12.12 France - Market size and forecast 2024-2029
- Chart on France - Market size and forecast 2024-2029 ($ million)
- Data Table on France - Market size and forecast 2024-2029 ($ million)
- Chart on France - Year-over-year growth 2024-2029 (%)
- Data Table on France - Year-over-year growth 2024-2029 (%)
- 12.13 Italy - Market size and forecast 2024-2029
- Chart on Italy - Market size and forecast 2024-2029 ($ million)
- Data Table on Italy - Market size and forecast 2024-2029 ($ million)
- Chart on Italy - Year-over-year growth 2024-2029 (%)
- Data Table on Italy - Year-over-year growth 2024-2029 (%)
- 12.14 Canada - Market size and forecast 2024-2029
- Chart on Canada - Market size and forecast 2024-2029 ($ million)
- Data Table on Canada - Market size and forecast 2024-2029 ($ million)
- Chart on Canada - Year-over-year growth 2024-2029 (%)
- Data Table on Canada - Year-over-year growth 2024-2029 (%)
- 12.15 India - Market size and forecast 2024-2029
- Chart on India - Market size and forecast 2024-2029 ($ million)
- Data Table on India - Market size and forecast 2024-2029 ($ million)
- Chart on India - Year-over-year growth 2024-2029 (%)
- Data Table on India - Year-over-year growth 2024-2029 (%)
- 12.16 Japan - Market size and forecast 2024-2029
- Chart on Japan - Market size and forecast 2024-2029 ($ million)
- Data Table on Japan - Market size and forecast 2024-2029 ($ million)
- Chart on Japan - Year-over-year growth 2024-2029 (%)
- Data Table on Japan - Year-over-year growth 2024-2029 (%)
- 12.17 Spain - Market size and forecast 2024-2029
- Chart on Spain - Market size and forecast 2024-2029 ($ million)
- Data Table on Spain - Market size and forecast 2024-2029 ($ million)
- Chart on Spain - Year-over-year growth 2024-2029 (%)
- Data Table on Spain - Year-over-year growth 2024-2029 (%)
- 12.18 Market opportunity By Geographical Landscape
- Market opportunity By Geographical Landscape ($ million)
- Data Tables on Market opportunity By Geographical Landscape ($ million)
13 Drivers, Challenges, and Opportunity/Restraints
- 13.1 Market drivers
- 13.2 Market challenges
- 13.3 Impact of drivers and challenges
- Impact of drivers and challenges in 2024 and 2029
- 13.4 Market opportunities/restraints
14 Competitive Landscape
- 14.1 Overview
- 14.2 Competitive Landscape
- Overview on criticality of inputs and factors of differentiation
- 14.3 Landscape disruption
- Overview on factors of disruption
- 14.4 Industry risks
- Impact of key risks on business
15 Competitive Analysis
- 15.1 Companies profiled
- Companies covered
- 15.2 Company ranking index
- Company ranking index
- 15.3 Market positioning of companies
- Matrix on companies position and classification
- 15.4 Azbil Telstar SL
- Azbil Telstar SL - Overview
- Azbil Telstar SL - Product / Service
- Azbil Telstar SL - Key offerings
- SWOT
- 15.5 Biopharma Process Systems Ltd.
- Biopharma Process Systems Ltd. - Overview
- Biopharma Process Systems Ltd. - Product / Service
- Biopharma Process Systems Ltd. - Key offerings
- SWOT
- 15.6 BUCHI Labortechnik AG
- BUCHI Labortechnik AG - Overview
- BUCHI Labortechnik AG - Product / Service
- BUCHI Labortechnik AG - Key offerings
- SWOT
- 15.7 COOLVACUUM TECHNOLOGIES S.L
- COOLVACUUM TECHNOLOGIES S.L - Overview
- COOLVACUUM TECHNOLOGIES S.L - Product / Service
- COOLVACUUM TECHNOLOGIES S.L - Key offerings
- SWOT
- 15.8 Cuddon Freeze Dry
- Cuddon Freeze Dry - Overview
- Cuddon Freeze Dry - Product / Service
- Cuddon Freeze Dry - Key offerings
- SWOT
- 15.9 GEA Group AG
- GEA Group AG - Overview
- GEA Group AG - Business segments
- GEA Group AG - Key offerings
- GEA Group AG - Segment focus
- SWOT
- 15.10 HOF Sonderanlagenbau GmbH
- HOF Sonderanlagenbau GmbH - Overview
- HOF Sonderanlagenbau GmbH - Product / Service
- HOF Sonderanlagenbau GmbH - Key offerings
- SWOT
- 15.11 IMA Industria Macchine Automatiche Spa
- IMA Industria Macchine Automatiche Spa - Overview
- IMA Industria Macchine Automatiche Spa - Product / Service
- IMA Industria Macchine Automatiche Spa - Key offerings
- SWOT
- 15.12 Labconco Corp.
- Labconco Corp. - Overview
- Labconco Corp. - Product / Service
- Labconco Corp. - Key offerings
- SWOT
- 15.13 Martin Christ Gefriertrocknungsanlagen GmbH
- Martin Christ Gefriertrocknungsanlagen GmbH - Overview
- Martin Christ Gefriertrocknungsanlagen GmbH - Product / Service
- Martin Christ Gefriertrocknungsanlagen GmbH - Key offerings
- SWOT
- 15.14 MechaTech Systems Ltd.
- MechaTech Systems Ltd. - Overview
- MechaTech Systems Ltd. - Product / Service
- MechaTech Systems Ltd. - Key offerings
- SWOT
- 15.15 Millrock Technology Inc.
- Millrock Technology Inc. - Overview
- Millrock Technology Inc. - Product / Service
- Millrock Technology Inc. - Key offerings
- SWOT
- 15.16 OPTIMA packaging group GmbH
- OPTIMA packaging group GmbH - Overview
- OPTIMA packaging group GmbH - Product / Service
- OPTIMA packaging group GmbH - Key offerings
- SWOT
- 15.17 Shanghai Tofflon Science and Technology Co. Ltd.
- Shanghai Tofflon Science and Technology Co. Ltd. - Overview
- Shanghai Tofflon Science and Technology Co. Ltd. - Product / Service
- Shanghai Tofflon Science and Technology Co. Ltd. - Key offerings
- SWOT
- 15.18 ZIRBUS technology GmbH
- ZIRBUS technology GmbH - Overview
- ZIRBUS technology GmbH - Product / Service
- ZIRBUS technology GmbH - Key offerings
- SWOT
16 Appendix
- 16.1 Scope of the report
- 16.2 Inclusions and exclusions checklist
- Inclusions checklist
- Exclusions checklist
- 16.3 Currency conversion rates for US$
- Currency conversion rates for US$
- 16.4 Research methodology
- Research methodology
- 16.5 Data procurement
- Information sources
- 16.6 Data validation
- Data validation
- 16.7 Validation techniques employed for market sizing
- Validation techniques employed for market sizing
- 16.8 Data synthesis
- Data synthesis
- 16.9 360 degree market analysis
- 360 degree market analysis
- 16.10 List of abbreviations
- List of abbreviations

