|
|
市場調査レポート
商品コード
1645446
ホットスタンピング箔の世界市場、2025-2029年Global Hot Stamping Foils Market 2025-2029 |
||||||
|
|||||||
カスタマイズ可能
|
|||||||


| ホットスタンピング箔の世界市場、2025-2029年 |
|
出版日: 2025年01月09日
発行: TechNavio
ページ情報: 英文 207 Pages
納期: 即納可能
|

全表示
- 概要
- 図表
- 目次
ホットスタンピング箔市場は2024-2029年に1億8,520万米ドル、予測期間中のCAGRは3%で成長すると予測されます。
この調査レポートは、ホットスタンピング箔市場の全体分析、市場規模・予測、動向、成長促進要因、課題、約25のベンダーを網羅したベンダー分析などを掲載しています。
現在の市場シナリオ、最新動向と促進要因、市場環境全体に関する最新分析を提供しています。市場の牽引役となっているのは、パッケージの美観向上と顧客誘引を目的とした箔押しの利用、新興国におけるFMCG/CPG製品の需要拡大、偽造防止包装の需要などです。
| 市場範囲 | |
|---|---|
| 基準年 | 2025 |
| 終了年 | 2029 |
| 予測期間 | 2025-2029 |
| 成長モメンタム | 加速 |
| 前年比2025年 | 2.9% |
| CAGR | 3% |
| 増分額 | 1億8,520万米ドル |
本調査では、成長する電子小売業界がホットスタンピング箔の需要を押し上げ、今後数年間のホットスタンピング箔市場の成長を促進する主な理由の1つであることを特定しています。また、世界のホットスタンピング箔市場における技術革新と生分解性パッケージの開発は、市場の大きな需要につながります。
目次
第1章 エグゼクティブサマリー
- 市場概要
第2章 Technavio分析
- 価格・ライフサイクル・顧客購入バスケット・採用率・購入基準の分析
- インプットの重要性と差別化の要因
- 混乱の要因
- 促進要因と課題の影響
第3章 市場情勢
- 市場エコシステム
- 市場の特徴
- バリューチェーン分析
第4章 市場規模
- 市場の定義
- 市場セグメント分析
- 市場規模 2024
- 市場の見通し 2024-2029
第5章 市場規模実績
- ホットスタンピング箔の世界市場 2019-2023
- 製品セグメント分析 2019-2023
- エンドユーザーセグメント分析 2019-2023
- 地域別セグメント分析 2019-2023
- 国別セグメント分析 2019-2023
第6章 定性分析
- AIの影響:ホットスタンピング箔の世界市場
第7章 ファイブフォース分析
- ファイブフォースの要約
- 買い手の交渉力
- 供給企業の交渉力
- 新規参入業者の脅威
- 代替品の脅威
- 競争の脅威
- 市況
第8章 市場セグメンテーション:製品別
- 市場セグメント
- 比較:製品別
- メタリック:市場規模と予測 2024-2029
- 顔料:市場規模と予測 2024-2029
- ホログラフィック:市場規模と予測 2024-2029
- 市場機会:製品別
第9章 市場セグメンテーション:エンドユーザー別
- 市場セグメント
- 比較:エンドユーザー別
- タバコと飲料:市場規模と予測 2024-2029
- 化粧品:市場規模と予測 2024-2029
- 家電:市場規模と予測 2024-2029
- 繊維・アパレル:市場規模と予測 2024-2029
- その他:市場規模と予測 2024-2029
- 市場機会:エンドユーザー別
第10章 顧客情勢
- 顧客情勢の概要
第11章 地域別情勢
- 地域別セグメンテーション
- 地域別比較
- 欧州:市場規模と予測 2024-2029
- 北米:市場規模と予測 2024-2029
- アジア太平洋:市場規模と予測 2024-2029
- 南米:市場規模と予測 2024-2029
- 中東・アフリカ:市場規模と予測 2024-2029
- 米国:市場規模と予測 2024-2029
- ドイツ:市場規模と予測 2024-2029
- 中国:市場規模と予測 2024-2029
- カナダ:市場規模と予測 2024-2029
- 英国:市場規模と予測 2024-2029
- 日本:市場規模と予測 2024-2029
- フランス:市場規模と予測 2024-2029
- インド:市場規模と予測 2024-2029
- ブラジル:市場規模と予測 2024-2029
- イタリア:市場規模と予測 2024-2029
- 市場機会:地域情勢別
第12章 促進要因・課題・機会・抑制要因
- 市場促進要因
- 市場の課題
- 促進要因と課題の影響
- 市場の機会・抑制要因
第13章 競合情勢
- 概要
- 競合情勢
- 混乱の状況
- 業界のリスク
第14章 競合分析
- 企業プロファイル
- 企業ランキング指数
- 企業の市場ポジショニング
- API FOILMAKERS LTD.
- Crown Roll Leaf Inc.
- FOLICO LTD.
- Henan Foils
- ITW Specialty Films
- K LASER TECHNOLOGY(HK)Co. Ltd.
- Katani Co. Ltd.
- Kolon Industries Inc.
- LEONHARD KURZ Stiftung and Co. KG
- MURATA KIMPAKU Co. Ltd.
- NAKAJIMA METAL LEAF, POWDER Co. Ltd.
- Nova Polymers Inc.
- Oike Kogyo Co. Ltd.
- Spartanics
- UNIVACCO Technology Inc.
第15章 付録
Exhibits:
- Exhibits1: Executive Summary - Chart on Market Overview
- Exhibits2: Executive Summary - Data Table on Market Overview
- Exhibits3: Executive Summary - Chart on Global Market Characteristics
- Exhibits4: Executive Summary - Chart on Market By Geographical Landscape
- Exhibits5: Executive Summary - Chart on Market Segmentation by Product
- Exhibits6: Executive Summary - Chart on Market Segmentation by End-user
- Exhibits7: Executive Summary - Chart on Incremental Growth
- Exhibits8: Executive Summary - Data Table on Incremental Growth
- Exhibits9: Executive Summary - Chart on Company Market Positioning
- Exhibits10: Analysis of price sensitivity, lifecycle, customer purchase basket, adoption rates, and purchase criteria
- Exhibits11: Overview on criticality of inputs and factors of differentiation
- Exhibits12: Overview on factors of disruption
- Exhibits13: Impact of drivers and challenges in 2024 and 2029
- Exhibits14: Parent Market
- Exhibits15: Data Table on - Parent Market
- Exhibits16: Market characteristics analysis
- Exhibits17: Value chain analysis
- Exhibits18: Offerings of companies included in the market definition
- Exhibits19: Market segments
- Exhibits20: Chart on Global - Market size and forecast 2024-2029 ($ million)
- Exhibits21: Data Table on Global - Market size and forecast 2024-2029 ($ million)
- Exhibits22: Chart on Global Market: Year-over-year growth 2024-2029 (%)
- Exhibits23: Data Table on Global Market: Year-over-year growth 2024-2029 (%)
- Exhibits24: Historic Market Size - Data Table on Global Hot Stamping Foils Market 2019 - 2023 ($ million)
- Exhibits25: Historic Market Size - Product Segment 2019 - 2023 ($ million)
- Exhibits26: Historic Market Size - End-user Segment 2019 - 2023 ($ million)
- Exhibits27: Historic Market Size - Geography Segment 2019 - 2023 ($ million)
- Exhibits28: Historic Market Size - Country Segment 2019 - 2023 ($ million)
- Exhibits29: Five forces analysis - Comparison between 2024 and 2029
- Exhibits30: Bargaining power of buyers - Impact of key factors 2024 and 2029
- Exhibits31: Bargaining power of suppliers - Impact of key factors in 2024 and 2029
- Exhibits32: Threat of new entrants - Impact of key factors in 2024 and 2029
- Exhibits33: Threat of substitutes - Impact of key factors in 2024 and 2029
- Exhibits34: Threat of rivalry - Impact of key factors in 2024 and 2029
- Exhibits35: Chart on Market condition - Five forces 2024 and 2029
- Exhibits36: Chart on Product - Market share 2024-2029 (%)
- Exhibits37: Data Table on Product - Market share 2024-2029 (%)
- Exhibits38: Chart on Comparison by Product
- Exhibits39: Data Table on Comparison by Product
- Exhibits40: Chart on Metallic - Market size and forecast 2024-2029 ($ million)
- Exhibits41: Data Table on Metallic - Market size and forecast 2024-2029 ($ million)
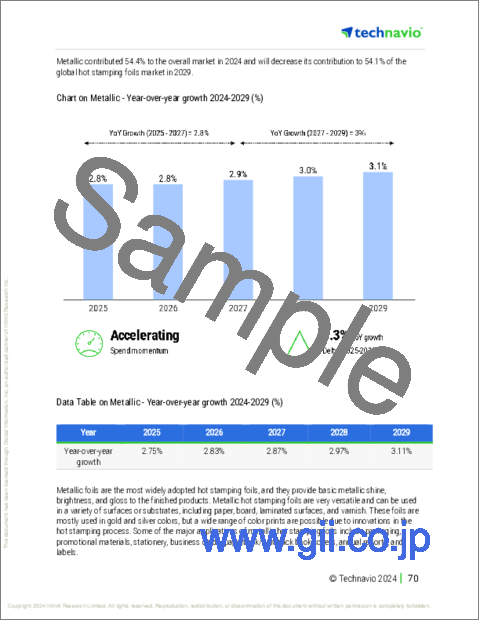
- Exhibits42: Chart on Metallic - Year-over-year growth 2024-2029 (%)
- Exhibits43: Data Table on Metallic - Year-over-year growth 2024-2029 (%)
- Exhibits44: Chart on Pigment - Market size and forecast 2024-2029 ($ million)
- Exhibits45: Data Table on Pigment - Market size and forecast 2024-2029 ($ million)
- Exhibits46: Chart on Pigment - Year-over-year growth 2024-2029 (%)
- Exhibits47: Data Table on Pigment - Year-over-year growth 2024-2029 (%)
- Exhibits48: Chart on Holographic - Market size and forecast 2024-2029 ($ million)
- Exhibits49: Data Table on Holographic - Market size and forecast 2024-2029 ($ million)
- Exhibits50: Chart on Holographic - Year-over-year growth 2024-2029 (%)
- Exhibits51: Data Table on Holographic - Year-over-year growth 2024-2029 (%)
- Exhibits52: Market opportunity by Product ($ million)
- Exhibits53: Data Table on Market opportunity by Product ($ million)
- Exhibits54: Chart on End-user - Market share 2024-2029 (%)
- Exhibits55: Data Table on End-user - Market share 2024-2029 (%)
- Exhibits56: Chart on Comparison by End-user
- Exhibits57: Data Table on Comparison by End-user
- Exhibits58: Chart on Cigarettes and beverages - Market size and forecast 2024-2029 ($ million)
- Exhibits59: Data Table on Cigarettes and beverages - Market size and forecast 2024-2029 ($ million)
- Exhibits60: Chart on Cigarettes and beverages - Year-over-year growth 2024-2029 (%)
- Exhibits61: Data Table on Cigarettes and beverages - Year-over-year growth 2024-2029 (%)
- Exhibits62: Chart on Cosmetics - Market size and forecast 2024-2029 ($ million)
- Exhibits63: Data Table on Cosmetics - Market size and forecast 2024-2029 ($ million)
- Exhibits64: Chart on Cosmetics - Year-over-year growth 2024-2029 (%)
- Exhibits65: Data Table on Cosmetics - Year-over-year growth 2024-2029 (%)
- Exhibits66: Chart on Consumer electronics - Market size and forecast 2024-2029 ($ million)
- Exhibits67: Data Table on Consumer electronics - Market size and forecast 2024-2029 ($ million)
- Exhibits68: Chart on Consumer electronics - Year-over-year growth 2024-2029 (%)
- Exhibits69: Data Table on Consumer electronics - Year-over-year growth 2024-2029 (%)
- Exhibits70: Chart on Textile and apparel - Market size and forecast 2024-2029 ($ million)
- Exhibits71: Data Table on Textile and apparel - Market size and forecast 2024-2029 ($ million)
- Exhibits72: Chart on Textile and apparel - Year-over-year growth 2024-2029 (%)
- Exhibits73: Data Table on Textile and apparel - Year-over-year growth 2024-2029 (%)
- Exhibits74: Chart on Others - Market size and forecast 2024-2029 ($ million)
- Exhibits75: Data Table on Others - Market size and forecast 2024-2029 ($ million)
- Exhibits76: Chart on Others - Year-over-year growth 2024-2029 (%)
- Exhibits77: Data Table on Others - Year-over-year growth 2024-2029 (%)
- Exhibits78: Market opportunity by End-user ($ million)
- Exhibits79: Data Table on Market opportunity by End-user ($ million)
- Exhibits80: Analysis of price sensitivity, lifecycle, customer purchase basket, adoption rates, and purchase criteria
- Exhibits81: Chart on Market share By Geographical Landscape 2024-2029 (%)
- Exhibits82: Data Table on Market share By Geographical Landscape 2024-2029 (%)
- Exhibits83: Chart on Geographic comparison
- Exhibits84: Data Table on Geographic comparison
- Exhibits85: Chart on Europe - Market size and forecast 2024-2029 ($ million)
- Exhibits86: Data Table on Europe - Market size and forecast 2024-2029 ($ million)
- Exhibits87: Chart on Europe - Year-over-year growth 2024-2029 (%)
- Exhibits88: Data Table on Europe - Year-over-year growth 2024-2029 (%)
- Exhibits89: Chart on North America - Market size and forecast 2024-2029 ($ million)
- Exhibits90: Data Table on North America - Market size and forecast 2024-2029 ($ million)
- Exhibits91: Chart on North America - Year-over-year growth 2024-2029 (%)
- Exhibits92: Data Table on North America - Year-over-year growth 2024-2029 (%)
- Exhibits93: Chart on APAC - Market size and forecast 2024-2029 ($ million)
- Exhibits94: Data Table on APAC - Market size and forecast 2024-2029 ($ million)
- Exhibits95: Chart on APAC - Year-over-year growth 2024-2029 (%)
- Exhibits96: Data Table on APAC - Year-over-year growth 2024-2029 (%)
- Exhibits97: Chart on South America - Market size and forecast 2024-2029 ($ million)
- Exhibits98: Data Table on South America - Market size and forecast 2024-2029 ($ million)
- Exhibits99: Chart on South America - Year-over-year growth 2024-2029 (%)
- Exhibits100: Data Table on South America - Year-over-year growth 2024-2029 (%)
- Exhibits101: Chart on Middle East and Africa - Market size and forecast 2024-2029 ($ million)
- Exhibits102: Data Table on Middle East and Africa - Market size and forecast 2024-2029 ($ million)
- Exhibits103: Chart on Middle East and Africa - Year-over-year growth 2024-2029 (%)
- Exhibits104: Data Table on Middle East and Africa - Year-over-year growth 2024-2029 (%)
- Exhibits105: Chart on US - Market size and forecast 2024-2029 ($ million)
- Exhibits106: Data Table on US - Market size and forecast 2024-2029 ($ million)
- Exhibits107: Chart on US - Year-over-year growth 2024-2029 (%)
- Exhibits108: Data Table on US - Year-over-year growth 2024-2029 (%)
- Exhibits109: Chart on Germany - Market size and forecast 2024-2029 ($ million)
- Exhibits110: Data Table on Germany - Market size and forecast 2024-2029 ($ million)
- Exhibits111: Chart on Germany - Year-over-year growth 2024-2029 (%)
- Exhibits112: Data Table on Germany - Year-over-year growth 2024-2029 (%)
- Exhibits113: Chart on China - Market size and forecast 2024-2029 ($ million)
- Exhibits114: Data Table on China - Market size and forecast 2024-2029 ($ million)
- Exhibits115: Chart on China - Year-over-year growth 2024-2029 (%)
- Exhibits116: Data Table on China - Year-over-year growth 2024-2029 (%)
- Exhibits117: Chart on Canada - Market size and forecast 2024-2029 ($ million)
- Exhibits118: Data Table on Canada - Market size and forecast 2024-2029 ($ million)
- Exhibits119: Chart on Canada - Year-over-year growth 2024-2029 (%)
- Exhibits120: Data Table on Canada - Year-over-year growth 2024-2029 (%)
- Exhibits121: Chart on UK - Market size and forecast 2024-2029 ($ million)
- Exhibits122: Data Table on UK - Market size and forecast 2024-2029 ($ million)
- Exhibits123: Chart on UK - Year-over-year growth 2024-2029 (%)
- Exhibits124: Data Table on UK - Year-over-year growth 2024-2029 (%)
- Exhibits125: Chart on Japan - Market size and forecast 2024-2029 ($ million)
- Exhibits126: Data Table on Japan - Market size and forecast 2024-2029 ($ million)
- Exhibits127: Chart on Japan - Year-over-year growth 2024-2029 (%)
- Exhibits128: Data Table on Japan - Year-over-year growth 2024-2029 (%)
- Exhibits129: Chart on France - Market size and forecast 2024-2029 ($ million)
- Exhibits130: Data Table on France - Market size and forecast 2024-2029 ($ million)
- Exhibits131: Chart on France - Year-over-year growth 2024-2029 (%)
- Exhibits132: Data Table on France - Year-over-year growth 2024-2029 (%)
- Exhibits133: Chart on India - Market size and forecast 2024-2029 ($ million)
- Exhibits134: Data Table on India - Market size and forecast 2024-2029 ($ million)
- Exhibits135: Chart on India - Year-over-year growth 2024-2029 (%)
- Exhibits136: Data Table on India - Year-over-year growth 2024-2029 (%)
- Exhibits137: Chart on Brazil - Market size and forecast 2024-2029 ($ million)
- Exhibits138: Data Table on Brazil - Market size and forecast 2024-2029 ($ million)
- Exhibits139: Chart on Brazil - Year-over-year growth 2024-2029 (%)
- Exhibits140: Data Table on Brazil - Year-over-year growth 2024-2029 (%)
- Exhibits141: Chart on Italy - Market size and forecast 2024-2029 ($ million)
- Exhibits142: Data Table on Italy - Market size and forecast 2024-2029 ($ million)
- Exhibits143: Chart on Italy - Year-over-year growth 2024-2029 (%)
- Exhibits144: Data Table on Italy - Year-over-year growth 2024-2029 (%)
- Exhibits145: Market opportunity By Geographical Landscape ($ million)
- Exhibits146: Data Tables on Market opportunity By Geographical Landscape ($ million)
- Exhibits147: Impact of drivers and challenges in 2024 and 2029
- Exhibits148: Overview on criticality of inputs and factors of differentiation
- Exhibits149: Overview on factors of disruption
- Exhibits150: Impact of key risks on business
- Exhibits151: Companies covered
- Exhibits152: Company ranking index
- Exhibits153: Matrix on companies position and classification
- Exhibits154: API FOILMAKERS LTD. - Overview
- Exhibits155: API FOILMAKERS LTD. - Product / Service
- Exhibits156: API FOILMAKERS LTD. - Key offerings
- Exhibits157: SWOT
- Exhibits158: Crown Roll Leaf Inc. - Overview
- Exhibits159: Crown Roll Leaf Inc. - Product / Service
- Exhibits160: Crown Roll Leaf Inc. - Key offerings
- Exhibits161: SWOT
- Exhibits162: FOLICO LTD. - Overview
- Exhibits163: FOLICO LTD. - Product / Service
- Exhibits164: FOLICO LTD. - Key offerings
- Exhibits165: SWOT
- Exhibits166: Henan Foils - Overview
- Exhibits167: Henan Foils - Product / Service
- Exhibits168: Henan Foils - Key offerings
- Exhibits169: SWOT
- Exhibits170: ITW Specialty Films - Overview
- Exhibits171: ITW Specialty Films - Product / Service
- Exhibits172: ITW Specialty Films - Key offerings
- Exhibits173: SWOT
- Exhibits174: K LASER TECHNOLOGY (HK) Co. Ltd. - Overview
- Exhibits175: K LASER TECHNOLOGY (HK) Co. Ltd. - Product / Service
- Exhibits176: K LASER TECHNOLOGY (HK) Co. Ltd. - Key offerings
- Exhibits177: SWOT
- Exhibits178: Katani Co. Ltd. - Overview
- Exhibits179: Katani Co. Ltd. - Product / Service
- Exhibits180: Katani Co. Ltd. - Key offerings
- Exhibits181: SWOT
- Exhibits182: Kolon Industries Inc. - Overview
- Exhibits183: Kolon Industries Inc. - Business segments
- Exhibits184: Kolon Industries Inc. - Key offerings
- Exhibits185: Kolon Industries Inc. - Segment focus
- Exhibits186: SWOT
- Exhibits187: LEONHARD KURZ Stiftung and Co. KG - Overview
- Exhibits188: LEONHARD KURZ Stiftung and Co. KG - Product / Service
- Exhibits189: LEONHARD KURZ Stiftung and Co. KG - Key offerings
- Exhibits190: SWOT
- Exhibits191: MURATA KIMPAKU Co. Ltd. - Overview
- Exhibits192: MURATA KIMPAKU Co. Ltd. - Product / Service
- Exhibits193: MURATA KIMPAKU Co. Ltd. - Key offerings
- Exhibits194: SWOT
- Exhibits195: NAKAJIMA METAL LEAF, POWDER Co. Ltd. - Overview
- Exhibits196: NAKAJIMA METAL LEAF, POWDER Co. Ltd. - Product / Service
- Exhibits197: NAKAJIMA METAL LEAF, POWDER Co. Ltd. - Key offerings
- Exhibits198: SWOT
- Exhibits199: Nova Polymers Inc. - Overview
- Exhibits200: Nova Polymers Inc. - Product / Service
- Exhibits201: Nova Polymers Inc. - Key offerings
- Exhibits202: SWOT
- Exhibits203: Oike Kogyo Co. Ltd. - Overview
- Exhibits204: Oike Kogyo Co. Ltd. - Product / Service
- Exhibits205: Oike Kogyo Co. Ltd. - Key offerings
- Exhibits206: SWOT
- Exhibits207: Spartanics - Overview
- Exhibits208: Spartanics - Product / Service
- Exhibits209: Spartanics - Key offerings
- Exhibits210: SWOT
- Exhibits211: UNIVACCO Technology Inc. - Overview
- Exhibits212: UNIVACCO Technology Inc. - Product / Service
- Exhibits213: UNIVACCO Technology Inc. - Key offerings
- Exhibits214: SWOT
- Exhibits215: Inclusions checklist
- Exhibits216: Exclusions checklist
- Exhibits217: Currency conversion rates for US$
- Exhibits218: Research methodology
- Exhibits219: Information sources
- Exhibits220: Data validation
- Exhibits221: Validation techniques employed for market sizing
- Exhibits222: Data synthesis
- Exhibits223: 360 degree market analysis
- Exhibits224: List of abbreviations
The hot stamping foils market is forecasted to grow by $ 185.2 mn during 2024-2029, accelerating at a CAGR of 3% during the forecast period. The report on the hot stamping foils market provides a holistic analysis, market size and forecast, trends, growth drivers, and challenges, as well as vendor analysis covering around 25 vendors.
The report offers an up-to-date analysis regarding the current market scenario, the latest trends and drivers, and the overall market environment. The market is driven by use of hot foil stamping to improve package aesthetics and attract customers, growing demand for fmcg/cpg products in emerging countries, and demand for anti-counterfeit packaging.
| Market Scope | |
|---|---|
| Base Year | 2025 |
| End Year | 2029 |
| Series Year | 2025-2029 |
| Growth Momentum | Accelerate |
| YOY 2025 | 2.9% |
| CAGR | 3% |
| Incremental Value | $185.2 mn |
Technavio's hot stamping foils market is segmented as below:
By Product
- Metallic
- Pigment
- Holographic
By End-user
- Cigarettes and beverages
- Cosmetics
- Consumer electronics
- Textile and apparel
- Others
By Geographical Landscape
- Europe
- North America
- APAC
- South America
- Middle East and Africa
This study identifies the growing e-retail industry boosting hot stamping foil demand as one of the prime reasons driving the hot stamping foils market growth during the next few years. Also, innovation in global hot stamping foils market and development of biodegradable packaging will lead to sizable demand in the market.
The report on the hot stamping foils market covers the following areas:
- Hot Stamping Foils Market sizing
- Hot Stamping Foils Market forecast
- Hot Stamping Foils Market industry analysis
The robust vendor analysis is designed to help clients improve their market position, and in line with this, this report provides a detailed analysis of several leading hot stamping foils market vendors that include API FOILMAKERS LTD., Crown Roll Leaf Inc., Foil Stamp Solutions, FOLICO LTD., Henan Foils, ITW Specialty Films, K LASER TECHNOLOGY (HK) Co. Ltd., Katani Co. Ltd., Kolon Industries Inc., LEONHARD KURZ Stiftung and Co. KG, MURATA KIMPAKU Co. Ltd., NAKAJIMA METAL LEAF, POWDER Co. Ltd., Nova Polymers Inc., Oike Kogyo Co. Ltd., Peyer Graphic AG, Point Scandinavia AB, Rasik Products Pvt. Ltd., Spartanics, UNIVACCO Technology Inc., and Washin Chemical Industry Co. Ltd.. Also, the hot stamping foils market analysis report includes information on upcoming trends and challenges that will influence market growth. This is to help companies strategize and leverage all forthcoming growth opportunities.
The study was conducted using an objective combination of primary and secondary information including inputs from key participants in the industry. The report contains a comprehensive market and vendor landscape in addition to an analysis of the key vendors.
The publisher presents a detailed picture of the market by the way of study, synthesis, and summation of data from multiple sources by an analysis of key parameters such as profit, pricing, competition, and promotions. It presents various market facets by identifying the key industry influencers. The data presented is comprehensive, reliable, and a result of extensive primary and secondary research. The market research reports provide a complete competitive landscape and an in-depth vendor selection methodology and analysis using qualitative and quantitative research to forecast accurate market growth.
Table of Contents
1 Executive Summary
- 1.1 Market overview
- Executive Summary - Chart on Market Overview
- Executive Summary - Data Table on Market Overview
- Executive Summary - Chart on Global Market Characteristics
- Executive Summary - Chart on Market By Geographical Landscape
- Executive Summary - Chart on Market Segmentation by Product
- Executive Summary - Chart on Market Segmentation by End-user
- Executive Summary - Chart on Incremental Growth
- Executive Summary - Data Table on Incremental Growth
- Executive Summary - Chart on Company Market Positioning
2 Technavio Analysis
- 2.1 Analysis of price sensitivity, lifecycle, customer purchase basket, adoption rates, and purchase criteria
- Analysis of price sensitivity, lifecycle, customer purchase basket, adoption rates, and purchase criteria
- 2.2 Criticality of inputs and Factors of differentiation
- Overview on criticality of inputs and factors of differentiation
- 2.3 Factors of disruption
- Overview on factors of disruption
- 2.4 Impact of drivers and challenges
- Impact of drivers and challenges in 2024 and 2029
3 Market Landscape
- 3.1 Market ecosystem
- Parent Market
- Data Table on - Parent Market
- 3.2 Market characteristics
- Market characteristics analysis
- 3.3 Value chain analysis
- Value chain analysis
4 Market Sizing
- 4.1 Market definition
- Offerings of companies included in the market definition
- 4.2 Market segment analysis
- Market segments
- 4.3 Market size 2024
- 4.4 Market outlook: Forecast for 2024-2029
- Chart on Global - Market size and forecast 2024-2029 ($ million)
- Data Table on Global - Market size and forecast 2024-2029 ($ million)
- Chart on Global Market: Year-over-year growth 2024-2029 (%)
- Data Table on Global Market: Year-over-year growth 2024-2029 (%)
5 Historic Market Size
- 5.1 Global Hot Stamping Foils Market 2019 - 2023
- Historic Market Size - Data Table on Global Hot Stamping Foils Market 2019 - 2023 ($ million)
- 5.2 Product segment analysis 2019 - 2023
- Historic Market Size - Product Segment 2019 - 2023 ($ million)
- 5.3 End-user segment analysis 2019 - 2023
- Historic Market Size - End-user Segment 2019 - 2023 ($ million)
- 5.4 Geography segment analysis 2019 - 2023
- Historic Market Size - Geography Segment 2019 - 2023 ($ million)
- 5.5 Country segment analysis 2019 - 2023
- Historic Market Size - Country Segment 2019 - 2023 ($ million)
6 Qualitative Analysis
- 6.1 Impact of AI on the Global Hot Stamping Foils Market
7 Five Forces Analysis
- 7.1 Five forces summary
- Five forces analysis - Comparison between 2024 and 2029
- 7.2 Bargaining power of buyers
- Bargaining power of buyers - Impact of key factors 2024 and 2029
- 7.3 Bargaining power of suppliers
- Bargaining power of suppliers - Impact of key factors in 2024 and 2029
- 7.4 Threat of new entrants
- Threat of new entrants - Impact of key factors in 2024 and 2029
- 7.5 Threat of substitutes
- Threat of substitutes - Impact of key factors in 2024 and 2029
- 7.6 Threat of rivalry
- Threat of rivalry - Impact of key factors in 2024 and 2029
- 7.7 Market condition
- Chart on Market condition - Five forces 2024 and 2029
8 Market Segmentation by Product
- 8.1 Market segments
- Chart on Product - Market share 2024-2029 (%)
- Data Table on Product - Market share 2024-2029 (%)
- 8.2 Comparison by Product
- Chart on Comparison by Product
- Data Table on Comparison by Product
- 8.3 Metallic - Market size and forecast 2024-2029
- Chart on Metallic - Market size and forecast 2024-2029 ($ million)
- Data Table on Metallic - Market size and forecast 2024-2029 ($ million)
- Chart on Metallic - Year-over-year growth 2024-2029 (%)
- Data Table on Metallic - Year-over-year growth 2024-2029 (%)
- 8.4 Pigment - Market size and forecast 2024-2029
- Chart on Pigment - Market size and forecast 2024-2029 ($ million)
- Data Table on Pigment - Market size and forecast 2024-2029 ($ million)
- Chart on Pigment - Year-over-year growth 2024-2029 (%)
- Data Table on Pigment - Year-over-year growth 2024-2029 (%)
- 8.5 Holographic - Market size and forecast 2024-2029
- Chart on Holographic - Market size and forecast 2024-2029 ($ million)
- Data Table on Holographic - Market size and forecast 2024-2029 ($ million)
- Chart on Holographic - Year-over-year growth 2024-2029 (%)
- Data Table on Holographic - Year-over-year growth 2024-2029 (%)
- 8.6 Market opportunity by Product
- Market opportunity by Product ($ million)
- Data Table on Market opportunity by Product ($ million)
9 Market Segmentation by End-user
- 9.1 Market segments
- Chart on End-user - Market share 2024-2029 (%)
- Data Table on End-user - Market share 2024-2029 (%)
- 9.2 Comparison by End-user
- Chart on Comparison by End-user
- Data Table on Comparison by End-user
- 9.3 Cigarettes and beverages - Market size and forecast 2024-2029
- Chart on Cigarettes and beverages - Market size and forecast 2024-2029 ($ million)
- Data Table on Cigarettes and beverages - Market size and forecast 2024-2029 ($ million)
- Chart on Cigarettes and beverages - Year-over-year growth 2024-2029 (%)
- Data Table on Cigarettes and beverages - Year-over-year growth 2024-2029 (%)
- 9.4 Cosmetics - Market size and forecast 2024-2029
- Chart on Cosmetics - Market size and forecast 2024-2029 ($ million)
- Data Table on Cosmetics - Market size and forecast 2024-2029 ($ million)
- Chart on Cosmetics - Year-over-year growth 2024-2029 (%)
- Data Table on Cosmetics - Year-over-year growth 2024-2029 (%)
- 9.5 Consumer electronics - Market size and forecast 2024-2029
- Chart on Consumer electronics - Market size and forecast 2024-2029 ($ million)
- Data Table on Consumer electronics - Market size and forecast 2024-2029 ($ million)
- Chart on Consumer electronics - Year-over-year growth 2024-2029 (%)
- Data Table on Consumer electronics - Year-over-year growth 2024-2029 (%)
- 9.6 Textile and apparel - Market size and forecast 2024-2029
- Chart on Textile and apparel - Market size and forecast 2024-2029 ($ million)
- Data Table on Textile and apparel - Market size and forecast 2024-2029 ($ million)
- Chart on Textile and apparel - Year-over-year growth 2024-2029 (%)
- Data Table on Textile and apparel - Year-over-year growth 2024-2029 (%)
- 9.7 Others - Market size and forecast 2024-2029
- Chart on Others - Market size and forecast 2024-2029 ($ million)
- Data Table on Others - Market size and forecast 2024-2029 ($ million)
- Chart on Others - Year-over-year growth 2024-2029 (%)
- Data Table on Others - Year-over-year growth 2024-2029 (%)
- 9.8 Market opportunity by End-user
- Market opportunity by End-user ($ million)
- Data Table on Market opportunity by End-user ($ million)
10 Customer Landscape
- 10.1 Customer landscape overview
- Analysis of price sensitivity, lifecycle, customer purchase basket, adoption rates, and purchase criteria
11 Geographic Landscape
- 11.1 Geographic segmentation
- Chart on Market share By Geographical Landscape 2024-2029 (%)
- Data Table on Market share By Geographical Landscape 2024-2029 (%)
- 11.2 Geographic comparison
- Chart on Geographic comparison
- Data Table on Geographic comparison
- 11.3 Europe - Market size and forecast 2024-2029
- Chart on Europe - Market size and forecast 2024-2029 ($ million)
- Data Table on Europe - Market size and forecast 2024-2029 ($ million)
- Chart on Europe - Year-over-year growth 2024-2029 (%)
- Data Table on Europe - Year-over-year growth 2024-2029 (%)
- 11.4 North America - Market size and forecast 2024-2029
- Chart on North America - Market size and forecast 2024-2029 ($ million)
- Data Table on North America - Market size and forecast 2024-2029 ($ million)
- Chart on North America - Year-over-year growth 2024-2029 (%)
- Data Table on North America - Year-over-year growth 2024-2029 (%)
- 11.5 APAC - Market size and forecast 2024-2029
- Chart on APAC - Market size and forecast 2024-2029 ($ million)
- Data Table on APAC - Market size and forecast 2024-2029 ($ million)
- Chart on APAC - Year-over-year growth 2024-2029 (%)
- Data Table on APAC - Year-over-year growth 2024-2029 (%)
- 11.6 South America - Market size and forecast 2024-2029
- Chart on South America - Market size and forecast 2024-2029 ($ million)
- Data Table on South America - Market size and forecast 2024-2029 ($ million)
- Chart on South America - Year-over-year growth 2024-2029 (%)
- Data Table on South America - Year-over-year growth 2024-2029 (%)
- 11.7 Middle East and Africa - Market size and forecast 2024-2029
- Chart on Middle East and Africa - Market size and forecast 2024-2029 ($ million)
- Data Table on Middle East and Africa - Market size and forecast 2024-2029 ($ million)
- Chart on Middle East and Africa - Year-over-year growth 2024-2029 (%)
- Data Table on Middle East and Africa - Year-over-year growth 2024-2029 (%)
- 11.8 US - Market size and forecast 2024-2029
- Chart on US - Market size and forecast 2024-2029 ($ million)
- Data Table on US - Market size and forecast 2024-2029 ($ million)
- Chart on US - Year-over-year growth 2024-2029 (%)
- Data Table on US - Year-over-year growth 2024-2029 (%)
- 11.9 Germany - Market size and forecast 2024-2029
- Chart on Germany - Market size and forecast 2024-2029 ($ million)
- Data Table on Germany - Market size and forecast 2024-2029 ($ million)
- Chart on Germany - Year-over-year growth 2024-2029 (%)
- Data Table on Germany - Year-over-year growth 2024-2029 (%)
- 11.10 China - Market size and forecast 2024-2029
- Chart on China - Market size and forecast 2024-2029 ($ million)
- Data Table on China - Market size and forecast 2024-2029 ($ million)
- Chart on China - Year-over-year growth 2024-2029 (%)
- Data Table on China - Year-over-year growth 2024-2029 (%)
- 11.11 Canada - Market size and forecast 2024-2029
- Chart on Canada - Market size and forecast 2024-2029 ($ million)
- Data Table on Canada - Market size and forecast 2024-2029 ($ million)
- Chart on Canada - Year-over-year growth 2024-2029 (%)
- Data Table on Canada - Year-over-year growth 2024-2029 (%)
- 11.12 UK - Market size and forecast 2024-2029
- Chart on UK - Market size and forecast 2024-2029 ($ million)
- Data Table on UK - Market size and forecast 2024-2029 ($ million)
- Chart on UK - Year-over-year growth 2024-2029 (%)
- Data Table on UK - Year-over-year growth 2024-2029 (%)
- 11.13 Japan - Market size and forecast 2024-2029
- Chart on Japan - Market size and forecast 2024-2029 ($ million)
- Data Table on Japan - Market size and forecast 2024-2029 ($ million)
- Chart on Japan - Year-over-year growth 2024-2029 (%)
- Data Table on Japan - Year-over-year growth 2024-2029 (%)
- 11.14 France - Market size and forecast 2024-2029
- Chart on France - Market size and forecast 2024-2029 ($ million)
- Data Table on France - Market size and forecast 2024-2029 ($ million)
- Chart on France - Year-over-year growth 2024-2029 (%)
- Data Table on France - Year-over-year growth 2024-2029 (%)
- 11.15 India - Market size and forecast 2024-2029
- Chart on India - Market size and forecast 2024-2029 ($ million)
- Data Table on India - Market size and forecast 2024-2029 ($ million)
- Chart on India - Year-over-year growth 2024-2029 (%)
- Data Table on India - Year-over-year growth 2024-2029 (%)
- 11.16 Brazil - Market size and forecast 2024-2029
- Chart on Brazil - Market size and forecast 2024-2029 ($ million)
- Data Table on Brazil - Market size and forecast 2024-2029 ($ million)
- Chart on Brazil - Year-over-year growth 2024-2029 (%)
- Data Table on Brazil - Year-over-year growth 2024-2029 (%)
- 11.17 Italy - Market size and forecast 2024-2029
- Chart on Italy - Market size and forecast 2024-2029 ($ million)
- Data Table on Italy - Market size and forecast 2024-2029 ($ million)
- Chart on Italy - Year-over-year growth 2024-2029 (%)
- Data Table on Italy - Year-over-year growth 2024-2029 (%)
- 11.18 Market opportunity By Geographical Landscape
- Market opportunity By Geographical Landscape ($ million)
- Data Tables on Market opportunity By Geographical Landscape ($ million)
12 Drivers, Challenges, and Opportunity/Restraints
- 12.1 Market drivers
- 12.2 Market challenges
- 12.3 Impact of drivers and challenges
- Impact of drivers and challenges in 2024 and 2029
- 12.4 Market opportunities/restraints
13 Competitive Landscape
- 13.1 Overview
- 13.2 Competitive Landscape
- Overview on criticality of inputs and factors of differentiation
- 13.3 Landscape disruption
- Overview on factors of disruption
- 13.4 Industry risks
- Impact of key risks on business
14 Competitive Analysis
- 14.1 Companies profiled
- Companies covered
- 14.2 Company ranking index
- Company ranking index
- 14.3 Market positioning of companies
- Matrix on companies position and classification
- 14.4 API FOILMAKERS LTD.
- API FOILMAKERS LTD. - Overview
- API FOILMAKERS LTD. - Product / Service
- API FOILMAKERS LTD. - Key offerings
- SWOT
- 14.5 Crown Roll Leaf Inc.
- Crown Roll Leaf Inc. - Overview
- Crown Roll Leaf Inc. - Product / Service
- Crown Roll Leaf Inc. - Key offerings
- SWOT
- 14.6 FOLICO LTD.
- FOLICO LTD. - Overview
- FOLICO LTD. - Product / Service
- FOLICO LTD. - Key offerings
- SWOT
- 14.7 Henan Foils
- Henan Foils - Overview
- Henan Foils - Product / Service
- Henan Foils - Key offerings
- SWOT
- 14.8 ITW Specialty Films
- ITW Specialty Films - Overview
- ITW Specialty Films - Product / Service
- ITW Specialty Films - Key offerings
- SWOT
- 14.9 K LASER TECHNOLOGY (HK) Co. Ltd.
- K LASER TECHNOLOGY (HK) Co. Ltd. - Overview
- K LASER TECHNOLOGY (HK) Co. Ltd. - Product / Service
- K LASER TECHNOLOGY (HK) Co. Ltd. - Key offerings
- SWOT
- 14.10 Katani Co. Ltd.
- Katani Co. Ltd. - Overview
- Katani Co. Ltd. - Product / Service
- Katani Co. Ltd. - Key offerings
- SWOT
- 14.11 Kolon Industries Inc.
- Kolon Industries Inc. - Overview
- Kolon Industries Inc. - Business segments
- Kolon Industries Inc. - Key offerings
- Kolon Industries Inc. - Segment focus
- SWOT
- 14.12 LEONHARD KURZ Stiftung and Co. KG
- LEONHARD KURZ Stiftung and Co. KG - Overview
- LEONHARD KURZ Stiftung and Co. KG - Product / Service
- LEONHARD KURZ Stiftung and Co. KG - Key offerings
- SWOT
- 14.13 MURATA KIMPAKU Co. Ltd.
- MURATA KIMPAKU Co. Ltd. - Overview
- MURATA KIMPAKU Co. Ltd. - Product / Service
- MURATA KIMPAKU Co. Ltd. - Key offerings
- SWOT
- 14.14 NAKAJIMA METAL LEAF, POWDER Co. Ltd.
- NAKAJIMA METAL LEAF, POWDER Co. Ltd. - Overview
- NAKAJIMA METAL LEAF, POWDER Co. Ltd. - Product / Service
- NAKAJIMA METAL LEAF, POWDER Co. Ltd. - Key offerings
- SWOT
- 14.15 Nova Polymers Inc.
- Nova Polymers Inc. - Overview
- Nova Polymers Inc. - Product / Service
- Nova Polymers Inc. - Key offerings
- SWOT
- 14.16 Oike Kogyo Co. Ltd.
- Oike Kogyo Co. Ltd. - Overview
- Oike Kogyo Co. Ltd. - Product / Service
- Oike Kogyo Co. Ltd. - Key offerings
- SWOT
- 14.17 Spartanics
- Spartanics - Overview
- Spartanics - Product / Service
- Spartanics - Key offerings
- SWOT
- 14.18 UNIVACCO Technology Inc.
- UNIVACCO Technology Inc. - Overview
- UNIVACCO Technology Inc. - Product / Service
- UNIVACCO Technology Inc. - Key offerings
- SWOT
15 Appendix
- 15.1 Scope of the report
- 15.2 Inclusions and exclusions checklist
- Inclusions checklist
- Exclusions checklist
- 15.3 Currency conversion rates for US$
- Currency conversion rates for US$
- 15.4 Research methodology
- Research methodology
- 15.5 Data procurement
- Information sources
- 15.6 Data validation
- Data validation
- 15.7 Validation techniques employed for market sizing
- Validation techniques employed for market sizing
- 15.8 Data synthesis
- Data synthesis
- 15.9 360 degree market analysis
- 360 degree market analysis
- 15.10 List of abbreviations
- List of abbreviations

