|
|
市場調査レポート
商品コード
1714136
グリーンルーフの世界市場 2025-2029Global Green-roofs Market 2025-2029 |
||||||

|
|||||||
カスタマイズ可能
|
|||||||


| グリーンルーフの世界市場 2025-2029 |
|
出版日: 2025年04月16日
発行: TechNavio
ページ情報: 英文 213 Pages
納期: 即納可能
|

全表示
- 概要
- 図表
- 目次
グリーンルーフ市場は2024-2029年に85億7,290万米ドル、予測期間中のCAGRは11.1%で成長すると予測されます。
当レポートでは、グリーンルーフ市場の全体的な分析、市場規模・予測、動向、成長促進要因、課題、約25のベンダーを網羅したベンダー分析などを掲載しています。
現在の市場シナリオ、最新動向と促進要因、市場環境全体に関する最新分析を提供しています。屋上緑化による地球温暖化防止、雨水流出管理の改善、政策支援などが市場を牽引しています。
| 市場範囲 | |
|---|---|
| 基準年 | 2025 |
| 終了年 | 2029 |
| 予測期間 | 2025-2029 |
| 成長モメンタム | 加速 |
| 前年比2025年 | 9.7% |
| CAGR | 11.1% |
| 増分額 | 85億7,290万米ドル |
本調査は、業界の主要参加者からのインプットを含め、一次情報と二次情報を客観的に組み合わせて実施しました。レポートには、主要企業の分析に加え、包括的な市場規模データ、地域分析によるセグメント、ベンダー情勢が含まれています。レポートには過去データと予測データがあります。
本調査では、グリーンルーフと太陽光発電システムの統合が、今後数年間のグリーンルーフ市場の成長を促進する主要な理由の1つであると特定しています。また、ミツバチの生息地となるグリーンルーフへの注目の高まりや、グリーンルーフの性能を評価するための評価スキームの採用は、市場の大きな需要につながります。
目次
第1章 エグゼクティブサマリー
- 市場概要
第2章 Technavio分析
- 価格・ライフサイクル・顧客購入バスケット・採用率・購入基準の分析
- インプットの重要性と差別化の要因
- 混乱の要因
- 促進要因と課題の影響
第3章 市場情勢
- 市場エコシステム
- 市場の特徴
- バリューチェーン分析
第4章 市場規模
- 市場の定義
- 市場セグメント分析
- 市場規模 2024
- 市場の見通し 2024-2029
第5章 市場規模実績
- グリーンルーフの世界市場 2019-2023
- 用途別セグメント分析 2019-2023
- 製品セグメント分析 2019-2023
- タイプセグメント分析 2019-2023
- 地域別セグメント分析 2019-2023
- 国別セグメント分析 2019-2023
第6章 定性分析
- AIの影響:グリーンルーフの世界市場
第7章 ファイブフォース分析
- ファイブフォースの要約
- 買い手の交渉力
- 供給企業の交渉力
- 新規参入業者の脅威
- 代替品の脅威
- 競争の脅威
- 市況
第8章 市場セグメンテーション:用途別
- 市場セグメント
- 比較:用途別
- 住宅用:市場規模と予測 2024-2029
- 商業用:市場規模と予測 2024-2029
- 産業:市場規模と予測 2024-2029
- 市場機会:用途別
第9章 市場セグメンテーション:製品別
- 市場セグメント
- 比較:製品別
- 広範囲にわたる:市場規模と予測 2024-2029
- 集中的な:市場規模と予測 2024-2029
- 市場機会:製品別
第10章 市場セグメンテーション:タイプ別
- 市場セグメント
- 比較:タイプ別
- セダムと多肉植物:市場規模と予測 2024-2029
- 在来種の草や野生の花:市場規模と予測 2024-2029
- 野菜とハーブの庭:市場規模と予測 2024-2029
- 市場機会:タイプ別
第11章 顧客情勢
- 顧客情勢の概要
第12章 地域別情勢
- 地域別セグメンテーション
- 地域別比較
- 北米:市場規模と予測 2024-2029
- 欧州:市場規模と予測 2024-2029
- アジア太平洋:市場規模と予測 2024-2029
- 南米:市場規模と予測 2024-2029
- 中東・アフリカ:市場規模と予測 2024-2029
- 米国:市場規模と予測 2024-2029
- ドイツ:市場規模と予測 2024-2029
- カナダ:市場規模と予測 2024-2029
- 日本:市場規模と予測 2024-2029
- シンガポール:市場規模と予測 2024-2029
- 英国:市場規模と予測 2024-2029
- 中国:市場規模と予測 2024-2029
- フランス:市場規模と予測 2024-2029
- メキシコ:市場規模と予測 2024-2029
- インド:市場規模と予測 2024-2029
- 市場機会:地域情勢別
第13章 促進要因・課題・機会・抑制要因
- 市場促進要因
- 市場の課題
- 促進要因と課題の影響
- 市場の機会・抑制要因
第14章 競合情勢
- 概要
- 競合情勢
- 混乱の状況
- 業界のリスク
第15章 競合分析
- 企業プロファイル
- 企業ランキング指数
- 企業の市場ポジショニング
- Apex Green Roofs Inc.
- Axter Ltd.
- Bauder Ltd.
- Columbia Green Technologies
- ecospaces LLC
- Intrinsic Landscaping
- LiveRoof Global LLC
- Onduline Group SAS
- Optigrun international AG
- RENOLIT SE
- Sempergreen
- Sika AG
- SkyGarden
- Skyland USA
- TOPGREEN Grundachsysteme
第16章 付録
Exhibits:
- Exhibits1: Executive Summary - Chart on Market Overview
- Exhibits2: Executive Summary - Data Table on Market Overview
- Exhibits3: Executive Summary - Chart on Global Market Characteristics
- Exhibits4: Executive Summary - Chart on Market By Geographical Landscape
- Exhibits5: Executive Summary - Chart on Market Segmentation by Application
- Exhibits6: Executive Summary - Chart on Market Segmentation by Product
- Exhibits7: Executive Summary - Chart on Market Segmentation by Type
- Exhibits8: Executive Summary - Chart on Incremental Growth
- Exhibits9: Executive Summary - Data Table on Incremental Growth
- Exhibits10: Executive Summary - Chart on Company Market Positioning
- Exhibits11: Analysis of price sensitivity, lifecycle, customer purchase basket, adoption rates, and purchase criteria
- Exhibits12: Overview on criticality of inputs and factors of differentiation
- Exhibits13: Overview on factors of disruption
- Exhibits14: Impact of drivers and challenges in 2024 and 2029
- Exhibits15: Parent Market
- Exhibits16: Data Table on - Parent Market
- Exhibits17: Market characteristics analysis
- Exhibits18: Value chain analysis
- Exhibits19: Offerings of companies included in the market definition
- Exhibits20: Market segments
- Exhibits21: Chart on Global - Market size and forecast 2024-2029 ($ million)
- Exhibits22: Data Table on Global - Market size and forecast 2024-2029 ($ million)
- Exhibits23: Chart on Global Market: Year-over-year growth 2024-2029 (%)
- Exhibits24: Data Table on Global Market: Year-over-year growth 2024-2029 (%)
- Exhibits25: Historic Market Size - Data Table on Global Green-Roofs Market 2019 - 2023 ($ million)
- Exhibits26: Historic Market Size - Application Segment 2019 - 2023 ($ million)
- Exhibits27: Historic Market Size - Product Segment 2019 - 2023 ($ million)
- Exhibits28: Historic Market Size - Type Segment 2019 - 2023 ($ million)
- Exhibits29: Historic Market Size - Geography Segment 2019 - 2023 ($ million)
- Exhibits30: Historic Market Size - Country Segment 2019 - 2023 ($ million)
- Exhibits31: Five forces analysis - Comparison between 2024 and 2029
- Exhibits32: Bargaining power of buyers - Impact of key factors 2024 and 2029
- Exhibits33: Bargaining power of suppliers - Impact of key factors in 2024 and 2029
- Exhibits34: Threat of new entrants - Impact of key factors in 2024 and 2029
- Exhibits35: Threat of substitutes - Impact of key factors in 2024 and 2029
- Exhibits36: Threat of rivalry - Impact of key factors in 2024 and 2029
- Exhibits37: Chart on Market condition - Five forces 2024 and 2029
- Exhibits38: Chart on Application - Market share 2024-2029 (%)
- Exhibits39: Data Table on Application - Market share 2024-2029 (%)
- Exhibits40: Chart on Comparison by Application
- Exhibits41: Data Table on Comparison by Application
- Exhibits42: Chart on Residential - Market size and forecast 2024-2029 ($ million)
- Exhibits43: Data Table on Residential - Market size and forecast 2024-2029 ($ million)
- Exhibits44: Chart on Residential - Year-over-year growth 2024-2029 (%)
- Exhibits45: Data Table on Residential - Year-over-year growth 2024-2029 (%)
- Exhibits46: Chart on Commercial - Market size and forecast 2024-2029 ($ million)
- Exhibits47: Data Table on Commercial - Market size and forecast 2024-2029 ($ million)
- Exhibits48: Chart on Commercial - Year-over-year growth 2024-2029 (%)
- Exhibits49: Data Table on Commercial - Year-over-year growth 2024-2029 (%)
- Exhibits50: Chart on Industrial - Market size and forecast 2024-2029 ($ million)
- Exhibits51: Data Table on Industrial - Market size and forecast 2024-2029 ($ million)
- Exhibits52: Chart on Industrial - Year-over-year growth 2024-2029 (%)
- Exhibits53: Data Table on Industrial - Year-over-year growth 2024-2029 (%)
- Exhibits54: Market opportunity by Application ($ million)
- Exhibits55: Data Table on Market opportunity by Application ($ million)
- Exhibits56: Chart on Product - Market share 2024-2029 (%)
- Exhibits57: Data Table on Product - Market share 2024-2029 (%)
- Exhibits58: Chart on Comparison by Product
- Exhibits59: Data Table on Comparison by Product
- Exhibits60: Chart on Extensive - Market size and forecast 2024-2029 ($ million)
- Exhibits61: Data Table on Extensive - Market size and forecast 2024-2029 ($ million)
- Exhibits62: Chart on Extensive - Year-over-year growth 2024-2029 (%)
- Exhibits63: Data Table on Extensive - Year-over-year growth 2024-2029 (%)
- Exhibits64: Chart on Intensive - Market size and forecast 2024-2029 ($ million)
- Exhibits65: Data Table on Intensive - Market size and forecast 2024-2029 ($ million)
- Exhibits66: Chart on Intensive - Year-over-year growth 2024-2029 (%)
- Exhibits67: Data Table on Intensive - Year-over-year growth 2024-2029 (%)
- Exhibits68: Market opportunity by Product ($ million)
- Exhibits69: Data Table on Market opportunity by Product ($ million)
- Exhibits70: Chart on Type - Market share 2024-2029 (%)
- Exhibits71: Data Table on Type - Market share 2024-2029 (%)
- Exhibits72: Chart on Comparison by Type
- Exhibits73: Data Table on Comparison by Type
- Exhibits74: Chart on Sedum and succulents - Market size and forecast 2024-2029 ($ million)
- Exhibits75: Data Table on Sedum and succulents - Market size and forecast 2024-2029 ($ million)
- Exhibits76: Chart on Sedum and succulents - Year-over-year growth 2024-2029 (%)
- Exhibits77: Data Table on Sedum and succulents - Year-over-year growth 2024-2029 (%)
- Exhibits78: Chart on Native grasses and wildflowers - Market size and forecast 2024-2029 ($ million)
- Exhibits79: Data Table on Native grasses and wildflowers - Market size and forecast 2024-2029 ($ million)
- Exhibits80: Chart on Native grasses and wildflowers - Year-over-year growth 2024-2029 (%)
- Exhibits81: Data Table on Native grasses and wildflowers - Year-over-year growth 2024-2029 (%)
- Exhibits82: Chart on Vegetable and herb gardens - Market size and forecast 2024-2029 ($ million)
- Exhibits83: Data Table on Vegetable and herb gardens - Market size and forecast 2024-2029 ($ million)
- Exhibits84: Chart on Vegetable and herb gardens - Year-over-year growth 2024-2029 (%)
- Exhibits85: Data Table on Vegetable and herb gardens - Year-over-year growth 2024-2029 (%)
- Exhibits86: Market opportunity by Type ($ million)
- Exhibits87: Data Table on Market opportunity by Type ($ million)
- Exhibits88: Analysis of price sensitivity, lifecycle, customer purchase basket, adoption rates, and purchase criteria
- Exhibits89: Chart on Market share By Geographical Landscape 2024-2029 (%)
- Exhibits90: Data Table on Market share By Geographical Landscape 2024-2029 (%)
- Exhibits91: Chart on Geographic comparison
- Exhibits92: Data Table on Geographic comparison
- Exhibits93: Chart on North America - Market size and forecast 2024-2029 ($ million)
- Exhibits94: Data Table on North America - Market size and forecast 2024-2029 ($ million)
- Exhibits95: Chart on North America - Year-over-year growth 2024-2029 (%)
- Exhibits96: Data Table on North America - Year-over-year growth 2024-2029 (%)
- Exhibits97: Chart on Europe - Market size and forecast 2024-2029 ($ million)
- Exhibits98: Data Table on Europe - Market size and forecast 2024-2029 ($ million)
- Exhibits99: Chart on Europe - Year-over-year growth 2024-2029 (%)
- Exhibits100: Data Table on Europe - Year-over-year growth 2024-2029 (%)
- Exhibits101: Chart on APAC - Market size and forecast 2024-2029 ($ million)
- Exhibits102: Data Table on APAC - Market size and forecast 2024-2029 ($ million)
- Exhibits103: Chart on APAC - Year-over-year growth 2024-2029 (%)
- Exhibits104: Data Table on APAC - Year-over-year growth 2024-2029 (%)
- Exhibits105: Chart on South America - Market size and forecast 2024-2029 ($ million)
- Exhibits106: Data Table on South America - Market size and forecast 2024-2029 ($ million)
- Exhibits107: Chart on South America - Year-over-year growth 2024-2029 (%)
- Exhibits108: Data Table on South America - Year-over-year growth 2024-2029 (%)
- Exhibits109: Chart on Middle East and Africa - Market size and forecast 2024-2029 ($ million)
- Exhibits110: Data Table on Middle East and Africa - Market size and forecast 2024-2029 ($ million)
- Exhibits111: Chart on Middle East and Africa - Year-over-year growth 2024-2029 (%)
- Exhibits112: Data Table on Middle East and Africa - Year-over-year growth 2024-2029 (%)
- Exhibits113: Chart on US - Market size and forecast 2024-2029 ($ million)
- Exhibits114: Data Table on US - Market size and forecast 2024-2029 ($ million)
- Exhibits115: Chart on US - Year-over-year growth 2024-2029 (%)
- Exhibits116: Data Table on US - Year-over-year growth 2024-2029 (%)
- Exhibits117: Chart on Germany - Market size and forecast 2024-2029 ($ million)
- Exhibits118: Data Table on Germany - Market size and forecast 2024-2029 ($ million)
- Exhibits119: Chart on Germany - Year-over-year growth 2024-2029 (%)
- Exhibits120: Data Table on Germany - Year-over-year growth 2024-2029 (%)
- Exhibits121: Chart on Canada - Market size and forecast 2024-2029 ($ million)
- Exhibits122: Data Table on Canada - Market size and forecast 2024-2029 ($ million)
- Exhibits123: Chart on Canada - Year-over-year growth 2024-2029 (%)
- Exhibits124: Data Table on Canada - Year-over-year growth 2024-2029 (%)
- Exhibits125: Chart on Japan - Market size and forecast 2024-2029 ($ million)
- Exhibits126: Data Table on Japan - Market size and forecast 2024-2029 ($ million)
- Exhibits127: Chart on Japan - Year-over-year growth 2024-2029 (%)
- Exhibits128: Data Table on Japan - Year-over-year growth 2024-2029 (%)
- Exhibits129: Chart on Singapore - Market size and forecast 2024-2029 ($ million)
- Exhibits130: Data Table on Singapore - Market size and forecast 2024-2029 ($ million)
- Exhibits131: Chart on Singapore - Year-over-year growth 2024-2029 (%)
- Exhibits132: Data Table on Singapore - Year-over-year growth 2024-2029 (%)
- Exhibits133: Chart on UK - Market size and forecast 2024-2029 ($ million)
- Exhibits134: Data Table on UK - Market size and forecast 2024-2029 ($ million)
- Exhibits135: Chart on UK - Year-over-year growth 2024-2029 (%)
- Exhibits136: Data Table on UK - Year-over-year growth 2024-2029 (%)
- Exhibits137: Chart on China - Market size and forecast 2024-2029 ($ million)
- Exhibits138: Data Table on China - Market size and forecast 2024-2029 ($ million)
- Exhibits139: Chart on China - Year-over-year growth 2024-2029 (%)
- Exhibits140: Data Table on China - Year-over-year growth 2024-2029 (%)
- Exhibits141: Chart on France - Market size and forecast 2024-2029 ($ million)
- Exhibits142: Data Table on France - Market size and forecast 2024-2029 ($ million)
- Exhibits143: Chart on France - Year-over-year growth 2024-2029 (%)
- Exhibits144: Data Table on France - Year-over-year growth 2024-2029 (%)
- Exhibits145: Chart on Mexico - Market size and forecast 2024-2029 ($ million)
- Exhibits146: Data Table on Mexico - Market size and forecast 2024-2029 ($ million)
- Exhibits147: Chart on Mexico - Year-over-year growth 2024-2029 (%)
- Exhibits148: Data Table on Mexico - Year-over-year growth 2024-2029 (%)
- Exhibits149: Chart on India - Market size and forecast 2024-2029 ($ million)
- Exhibits150: Data Table on India - Market size and forecast 2024-2029 ($ million)
- Exhibits151: Chart on India - Year-over-year growth 2024-2029 (%)
- Exhibits152: Data Table on India - Year-over-year growth 2024-2029 (%)
- Exhibits153: Market opportunity By Geographical Landscape ($ million)
- Exhibits154: Data Tables on Market opportunity By Geographical Landscape ($ million)
- Exhibits155: Impact of drivers and challenges in 2024 and 2029
- Exhibits156: Overview on criticality of inputs and factors of differentiation
- Exhibits157: Overview on factors of disruption
- Exhibits158: Impact of key risks on business
- Exhibits159: Companies covered
- Exhibits160: Company ranking index
- Exhibits161: Matrix on companies position and classification
- Exhibits162: Apex Green Roofs Inc. - Overview
- Exhibits163: Apex Green Roofs Inc. - Product / Service
- Exhibits164: Apex Green Roofs Inc. - Key offerings
- Exhibits165: SWOT
- Exhibits166: Axter Ltd. - Overview
- Exhibits167: Axter Ltd. - Product / Service
- Exhibits168: Axter Ltd. - Key offerings
- Exhibits169: SWOT
- Exhibits170: Bauder Ltd. - Overview
- Exhibits171: Bauder Ltd. - Product / Service
- Exhibits172: Bauder Ltd. - Key offerings
- Exhibits173: SWOT
- Exhibits174: Columbia Green Technologies - Overview
- Exhibits175: Columbia Green Technologies - Product / Service
- Exhibits176: Columbia Green Technologies - Key offerings
- Exhibits177: SWOT
- Exhibits178: ecospaces LLC - Overview
- Exhibits179: ecospaces LLC - Product / Service
- Exhibits180: ecospaces LLC - Key offerings
- Exhibits181: SWOT
- Exhibits182: Intrinsic Landscaping - Overview
- Exhibits183: Intrinsic Landscaping - Product / Service
- Exhibits184: Intrinsic Landscaping - Key offerings
- Exhibits185: SWOT
- Exhibits186: LiveRoof Global LLC - Overview
- Exhibits187: LiveRoof Global LLC - Product / Service
- Exhibits188: LiveRoof Global LLC - Key offerings
- Exhibits189: SWOT
- Exhibits190: Onduline Group SAS - Overview
- Exhibits191: Onduline Group SAS - Product / Service
- Exhibits192: Onduline Group SAS - Key offerings
- Exhibits193: SWOT
- Exhibits194: Optigrun international AG - Overview
- Exhibits195: Optigrun international AG - Product / Service
- Exhibits196: Optigrun international AG - Key offerings
- Exhibits197: SWOT
- Exhibits198: RENOLIT SE - Overview
- Exhibits199: RENOLIT SE - Product / Service
- Exhibits200: RENOLIT SE - Key offerings
- Exhibits201: SWOT
- Exhibits202: Sempergreen - Overview
- Exhibits203: Sempergreen - Product / Service
- Exhibits204: Sempergreen - Key offerings
- Exhibits205: SWOT
- Exhibits206: Sika AG - Overview
- Exhibits207: Sika AG - Business segments
- Exhibits208: Sika AG - Key news
- Exhibits209: Sika AG - Key offerings
- Exhibits210: Sika AG - Segment focus
- Exhibits211: SWOT
- Exhibits212: SkyGarden - Overview
- Exhibits213: SkyGarden - Product / Service
- Exhibits214: SkyGarden - Key offerings
- Exhibits215: SWOT
- Exhibits216: Skyland USA - Overview
- Exhibits217: Skyland USA - Product / Service
- Exhibits218: Skyland USA - Key offerings
- Exhibits219: SWOT
- Exhibits220: TOPGREEN Grundachsysteme - Overview
- Exhibits221: TOPGREEN Grundachsysteme - Product / Service
- Exhibits222: TOPGREEN Grundachsysteme - Key offerings
- Exhibits223: SWOT
- Exhibits224: Inclusions checklist
- Exhibits225: Exclusions checklist
- Exhibits226: Currency conversion rates for US$
- Exhibits227: Research methodology
- Exhibits228: Information sources
- Exhibits229: Data validation
- Exhibits230: Validation techniques employed for market sizing
- Exhibits231: Data synthesis
- Exhibits232: 360 degree market analysis
- Exhibits233: List of abbreviations
The green-roofs market is forecasted to grow by USD 8572.9 mn during 2024-2029, accelerating at a CAGR of 11.1% during the forecast period. The report on the green-roofs market provides a holistic analysis, market size and forecast, trends, growth drivers, and challenges, as well as vendor analysis covering around 25 vendors.
The report offers an up-to-date analysis regarding the current market scenario, the latest trends and drivers, and the overall market environment. The market is driven by reduction in global warming due to green roofs, better management of rainwater runoff flow, and supporting policies.
| Market Scope | |
|---|---|
| Base Year | 2025 |
| End Year | 2029 |
| Series Year | 2025-2029 |
| Growth Momentum | Accelerate |
| YOY 2025 | 9.7% |
| CAGR | 11.1% |
| Incremental Value | $8572.9 mn |
The study was conducted using an objective combination of primary and secondary information including inputs from key participants in the industry. The report contains a comprehensive market size data, segment with regional analysis and vendor landscape in addition to an analysis of the key companies. Reports have historic and forecast data.
Technavio's green-roofs market is segmented as below:
By Application
- Residential
- Commercial
- Industrial
By Product
- Extensive
- Intensive
By Type
- Sedum and succulents
- Native grasses and wildflowers
- Vegetable and herb gardens
By Geographical Landscape
- North America
- Europe
- APAC
- South America
- Middle East and Africa
This study identifies the integration of green-roof and solar photovoltaic systems as one of the prime reasons driving the green-roofs market growth during the next few years. Also, increasing focus on green roofs becoming bee habitats and adoption of rating schemes for evaluating green-roof performance will lead to sizable demand in the market.
The report on the green-roofs market covers the following areas:
- Green-Roofs Market sizing
- Green-Roofs Market forecast
- Green-Roofs Market industry analysis
The robust vendor analysis is designed to help clients improve their market position, and in line with this, this report provides a detailed analysis of several leading green-roofs market vendors that include Apex Green Roofs Inc., Axter Ltd., Bauder Ltd., Columbia Green Technologies, ecospaces LLC, Intrinsic Landscaping, LiveRoof Global LLC, Onduline Group SAS, Optigrun international AG, RENOLIT SE, Sempergreen, Sika AG, SkyGarden, Skyland USA, SKYSPACE Green Roofs, SOPREMA SAS, TOPGREEN Grundachsysteme, Vegetal i.D. Inc., Vitaroofs International Inc., and ZinCo GmbH. Also, the green-roofs market analysis report includes information on upcoming trends and challenges that will influence market growth. This is to help companies strategize and leverage all forthcoming growth opportunities.
The publisher presents a detailed picture of the market by the way of study, synthesis, and summation of data from multiple sources by an analysis of key parameters such as profit, pricing, competition, and promotions. It presents various market facets by identifying the key industry influencers. The data presented is comprehensive, reliable, and a result of extensive primary and secondary research. The market research reports provide a complete competitive landscape and an in-depth vendor selection methodology and analysis using qualitative and quantitative research to forecast accurate market growth.
Table of Contents
1 Executive Summary
- 1.1 Market overview
- Executive Summary - Chart on Market Overview
- Executive Summary - Data Table on Market Overview
- Executive Summary - Chart on Global Market Characteristics
- Executive Summary - Chart on Market By Geographical Landscape
- Executive Summary - Chart on Market Segmentation by Application
- Executive Summary - Chart on Market Segmentation by Product
- Executive Summary - Chart on Market Segmentation by Type
- Executive Summary - Chart on Incremental Growth
- Executive Summary - Data Table on Incremental Growth
- Executive Summary - Chart on Company Market Positioning
2 Technavio Analysis
- 2.1 Analysis of price sensitivity, lifecycle, customer purchase basket, adoption rates, and purchase criteria
- Analysis of price sensitivity, lifecycle, customer purchase basket, adoption rates, and purchase criteria
- 2.2 Criticality of inputs and Factors of differentiation
- Overview on criticality of inputs and factors of differentiation
- 2.3 Factors of disruption
- Overview on factors of disruption
- 2.4 Impact of drivers and challenges
- Impact of drivers and challenges in 2024 and 2029
3 Market Landscape
- 3.1 Market ecosystem
- Parent Market
- Data Table on - Parent Market
- 3.2 Market characteristics
- Market characteristics analysis
- 3.3 Value chain analysis
- Value chain analysis
4 Market Sizing
- 4.1 Market definition
- Offerings of companies included in the market definition
- 4.2 Market segment analysis
- Market segments
- 4.3 Market size 2024
- 4.4 Market outlook: Forecast for 2024-2029
- Chart on Global - Market size and forecast 2024-2029 ($ million)
- Data Table on Global - Market size and forecast 2024-2029 ($ million)
- Chart on Global Market: Year-over-year growth 2024-2029 (%)
- Data Table on Global Market: Year-over-year growth 2024-2029 (%)
5 Historic Market Size
- 5.1 Global Green-Roofs Market 2019 - 2023
- Historic Market Size - Data Table on Global Green-Roofs Market 2019 - 2023 ($ million)
- 5.2 Application segment analysis 2019 - 2023
- Historic Market Size - Application Segment 2019 - 2023 ($ million)
- 5.3 Product segment analysis 2019 - 2023
- Historic Market Size - Product Segment 2019 - 2023 ($ million)
- 5.4 Type segment analysis 2019 - 2023
- Historic Market Size - Type Segment 2019 - 2023 ($ million)
- 5.5 Geography segment analysis 2019 - 2023
- Historic Market Size - Geography Segment 2019 - 2023 ($ million)
- 5.6 Country segment analysis 2019 - 2023
- Historic Market Size - Country Segment 2019 - 2023 ($ million)
6 Qualitative Analysis
- 6.1 Impact of AI on global green-roofs market
7 Five Forces Analysis
- 7.1 Five forces summary
- Five forces analysis - Comparison between 2024 and 2029
- 7.2 Bargaining power of buyers
- Bargaining power of buyers - Impact of key factors 2024 and 2029
- 7.3 Bargaining power of suppliers
- Bargaining power of suppliers - Impact of key factors in 2024 and 2029
- 7.4 Threat of new entrants
- Threat of new entrants - Impact of key factors in 2024 and 2029
- 7.5 Threat of substitutes
- Threat of substitutes - Impact of key factors in 2024 and 2029
- 7.6 Threat of rivalry
- Threat of rivalry - Impact of key factors in 2024 and 2029
- 7.7 Market condition
- Chart on Market condition - Five forces 2024 and 2029
8 Market Segmentation by Application
- 8.1 Market segments
- Chart on Application - Market share 2024-2029 (%)
- Data Table on Application - Market share 2024-2029 (%)
- 8.2 Comparison by Application
- Chart on Comparison by Application
- Data Table on Comparison by Application
- 8.3 Residential - Market size and forecast 2024-2029
- Chart on Residential - Market size and forecast 2024-2029 ($ million)
- Data Table on Residential - Market size and forecast 2024-2029 ($ million)
- Chart on Residential - Year-over-year growth 2024-2029 (%)
- Data Table on Residential - Year-over-year growth 2024-2029 (%)
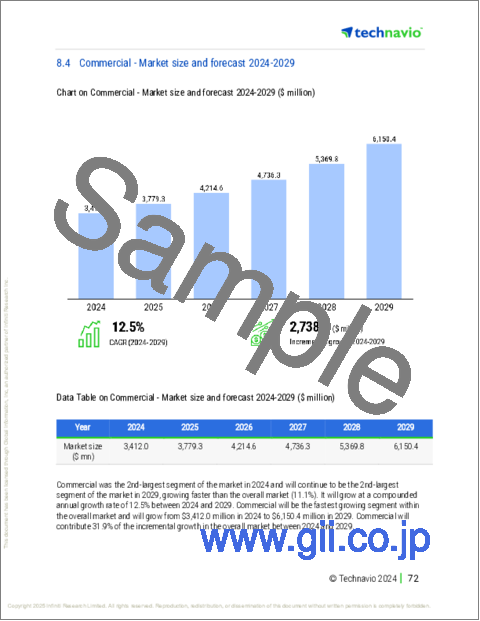
- 8.4 Commercial - Market size and forecast 2024-2029
- Chart on Commercial - Market size and forecast 2024-2029 ($ million)
- Data Table on Commercial - Market size and forecast 2024-2029 ($ million)
- Chart on Commercial - Year-over-year growth 2024-2029 (%)
- Data Table on Commercial - Year-over-year growth 2024-2029 (%)
- 8.5 Industrial - Market size and forecast 2024-2029
- Chart on Industrial - Market size and forecast 2024-2029 ($ million)
- Data Table on Industrial - Market size and forecast 2024-2029 ($ million)
- Chart on Industrial - Year-over-year growth 2024-2029 (%)
- Data Table on Industrial - Year-over-year growth 2024-2029 (%)
- 8.6 Market opportunity by Application
- Market opportunity by Application ($ million)
- Data Table on Market opportunity by Application ($ million)
9 Market Segmentation by Product
- 9.1 Market segments
- Chart on Product - Market share 2024-2029 (%)
- Data Table on Product - Market share 2024-2029 (%)
- 9.2 Comparison by Product
- Chart on Comparison by Product
- Data Table on Comparison by Product
- 9.3 Extensive - Market size and forecast 2024-2029
- Chart on Extensive - Market size and forecast 2024-2029 ($ million)
- Data Table on Extensive - Market size and forecast 2024-2029 ($ million)
- Chart on Extensive - Year-over-year growth 2024-2029 (%)
- Data Table on Extensive - Year-over-year growth 2024-2029 (%)
- 9.4 Intensive - Market size and forecast 2024-2029
- Chart on Intensive - Market size and forecast 2024-2029 ($ million)
- Data Table on Intensive - Market size and forecast 2024-2029 ($ million)
- Chart on Intensive - Year-over-year growth 2024-2029 (%)
- Data Table on Intensive - Year-over-year growth 2024-2029 (%)
- 9.5 Market opportunity by Product
- Market opportunity by Product ($ million)
- Data Table on Market opportunity by Product ($ million)
10 Market Segmentation by Type
- 10.1 Market segments
- Chart on Type - Market share 2024-2029 (%)
- Data Table on Type - Market share 2024-2029 (%)
- 10.2 Comparison by Type
- Chart on Comparison by Type
- Data Table on Comparison by Type
- 10.3 Sedum and succulents - Market size and forecast 2024-2029
- Chart on Sedum and succulents - Market size and forecast 2024-2029 ($ million)
- Data Table on Sedum and succulents - Market size and forecast 2024-2029 ($ million)
- Chart on Sedum and succulents - Year-over-year growth 2024-2029 (%)
- Data Table on Sedum and succulents - Year-over-year growth 2024-2029 (%)
- 10.4 Native grasses and wildflowers - Market size and forecast 2024-2029
- Chart on Native grasses and wildflowers - Market size and forecast 2024-2029 ($ million)
- Data Table on Native grasses and wildflowers - Market size and forecast 2024-2029 ($ million)
- Chart on Native grasses and wildflowers - Year-over-year growth 2024-2029 (%)
- Data Table on Native grasses and wildflowers - Year-over-year growth 2024-2029 (%)
- 10.5 Vegetable and herb gardens - Market size and forecast 2024-2029
- Chart on Vegetable and herb gardens - Market size and forecast 2024-2029 ($ million)
- Data Table on Vegetable and herb gardens - Market size and forecast 2024-2029 ($ million)
- Chart on Vegetable and herb gardens - Year-over-year growth 2024-2029 (%)
- Data Table on Vegetable and herb gardens - Year-over-year growth 2024-2029 (%)
- 10.6 Market opportunity by Type
- Market opportunity by Type ($ million)
- Data Table on Market opportunity by Type ($ million)
11 Customer Landscape
- 11.1 Customer landscape overview
- Analysis of price sensitivity, lifecycle, customer purchase basket, adoption rates, and purchase criteria
12 Geographic Landscape
- 12.1 Geographic segmentation
- Chart on Market share By Geographical Landscape 2024-2029 (%)
- Data Table on Market share By Geographical Landscape 2024-2029 (%)
- 12.2 Geographic comparison
- Chart on Geographic comparison
- Data Table on Geographic comparison
- 12.3 North America - Market size and forecast 2024-2029
- Chart on North America - Market size and forecast 2024-2029 ($ million)
- Data Table on North America - Market size and forecast 2024-2029 ($ million)
- Chart on North America - Year-over-year growth 2024-2029 (%)
- Data Table on North America - Year-over-year growth 2024-2029 (%)
- 12.4 Europe - Market size and forecast 2024-2029
- Chart on Europe - Market size and forecast 2024-2029 ($ million)
- Data Table on Europe - Market size and forecast 2024-2029 ($ million)
- Chart on Europe - Year-over-year growth 2024-2029 (%)
- Data Table on Europe - Year-over-year growth 2024-2029 (%)
- 12.5 APAC - Market size and forecast 2024-2029
- Chart on APAC - Market size and forecast 2024-2029 ($ million)
- Data Table on APAC - Market size and forecast 2024-2029 ($ million)
- Chart on APAC - Year-over-year growth 2024-2029 (%)
- Data Table on APAC - Year-over-year growth 2024-2029 (%)
- 12.6 South America - Market size and forecast 2024-2029
- Chart on South America - Market size and forecast 2024-2029 ($ million)
- Data Table on South America - Market size and forecast 2024-2029 ($ million)
- Chart on South America - Year-over-year growth 2024-2029 (%)
- Data Table on South America - Year-over-year growth 2024-2029 (%)
- 12.7 Middle East and Africa - Market size and forecast 2024-2029
- Chart on Middle East and Africa - Market size and forecast 2024-2029 ($ million)
- Data Table on Middle East and Africa - Market size and forecast 2024-2029 ($ million)
- Chart on Middle East and Africa - Year-over-year growth 2024-2029 (%)
- Data Table on Middle East and Africa - Year-over-year growth 2024-2029 (%)
- 12.8 US - Market size and forecast 2024-2029
- Chart on US - Market size and forecast 2024-2029 ($ million)
- Data Table on US - Market size and forecast 2024-2029 ($ million)
- Chart on US - Year-over-year growth 2024-2029 (%)
- Data Table on US - Year-over-year growth 2024-2029 (%)
- 12.9 Germany - Market size and forecast 2024-2029
- Chart on Germany - Market size and forecast 2024-2029 ($ million)
- Data Table on Germany - Market size and forecast 2024-2029 ($ million)
- Chart on Germany - Year-over-year growth 2024-2029 (%)
- Data Table on Germany - Year-over-year growth 2024-2029 (%)
- 12.10 Canada - Market size and forecast 2024-2029
- Chart on Canada - Market size and forecast 2024-2029 ($ million)
- Data Table on Canada - Market size and forecast 2024-2029 ($ million)
- Chart on Canada - Year-over-year growth 2024-2029 (%)
- Data Table on Canada - Year-over-year growth 2024-2029 (%)
- 12.11 Japan - Market size and forecast 2024-2029
- Chart on Japan - Market size and forecast 2024-2029 ($ million)
- Data Table on Japan - Market size and forecast 2024-2029 ($ million)
- Chart on Japan - Year-over-year growth 2024-2029 (%)
- Data Table on Japan - Year-over-year growth 2024-2029 (%)
- 12.12 Singapore - Market size and forecast 2024-2029
- Chart on Singapore - Market size and forecast 2024-2029 ($ million)
- Data Table on Singapore - Market size and forecast 2024-2029 ($ million)
- Chart on Singapore - Year-over-year growth 2024-2029 (%)
- Data Table on Singapore - Year-over-year growth 2024-2029 (%)
- 12.13 UK - Market size and forecast 2024-2029
- Chart on UK - Market size and forecast 2024-2029 ($ million)
- Data Table on UK - Market size and forecast 2024-2029 ($ million)
- Chart on UK - Year-over-year growth 2024-2029 (%)
- Data Table on UK - Year-over-year growth 2024-2029 (%)
- 12.14 China - Market size and forecast 2024-2029
- Chart on China - Market size and forecast 2024-2029 ($ million)
- Data Table on China - Market size and forecast 2024-2029 ($ million)
- Chart on China - Year-over-year growth 2024-2029 (%)
- Data Table on China - Year-over-year growth 2024-2029 (%)
- 12.15 France - Market size and forecast 2024-2029
- Chart on France - Market size and forecast 2024-2029 ($ million)
- Data Table on France - Market size and forecast 2024-2029 ($ million)
- Chart on France - Year-over-year growth 2024-2029 (%)
- Data Table on France - Year-over-year growth 2024-2029 (%)
- 12.16 Mexico - Market size and forecast 2024-2029
- Chart on Mexico - Market size and forecast 2024-2029 ($ million)
- Data Table on Mexico - Market size and forecast 2024-2029 ($ million)
- Chart on Mexico - Year-over-year growth 2024-2029 (%)
- Data Table on Mexico - Year-over-year growth 2024-2029 (%)
- 12.17 India - Market size and forecast 2024-2029
- Chart on India - Market size and forecast 2024-2029 ($ million)
- Data Table on India - Market size and forecast 2024-2029 ($ million)
- Chart on India - Year-over-year growth 2024-2029 (%)
- Data Table on India - Year-over-year growth 2024-2029 (%)
- 12.18 Market opportunity By Geographical Landscape
- Market opportunity By Geographical Landscape ($ million)
- Data Tables on Market opportunity By Geographical Landscape ($ million)
13 Drivers, Challenges, and Opportunity/Restraints
- 13.1 Market drivers
- 13.2 Market challenges
- 13.3 Impact of drivers and challenges
- Impact of drivers and challenges in 2024 and 2029
- 13.4 Market opportunities/restraints
14 Competitive Landscape
- 14.1 Overview
- 14.2 Competitive Landscape
- Overview on criticality of inputs and factors of differentiation
- 14.3 Landscape disruption
- Overview on factors of disruption
- 14.4 Industry risks
- Impact of key risks on business
15 Competitive Analysis
- 15.1 Companies profiled
- Companies covered
- 15.2 Company ranking index
- Company ranking index
- 15.3 Market positioning of companies
- Matrix on companies position and classification
- 15.4 Apex Green Roofs Inc.
- Apex Green Roofs Inc. - Overview
- Apex Green Roofs Inc. - Product / Service
- Apex Green Roofs Inc. - Key offerings
- SWOT
- 15.5 Axter Ltd.
- Axter Ltd. - Overview
- Axter Ltd. - Product / Service
- Axter Ltd. - Key offerings
- SWOT
- 15.6 Bauder Ltd.
- Bauder Ltd. - Overview
- Bauder Ltd. - Product / Service
- Bauder Ltd. - Key offerings
- SWOT
- 15.7 Columbia Green Technologies
- Columbia Green Technologies - Overview
- Columbia Green Technologies - Product / Service
- Columbia Green Technologies - Key offerings
- SWOT
- 15.8 ecospaces LLC
- ecospaces LLC - Overview
- ecospaces LLC - Product / Service
- ecospaces LLC - Key offerings
- SWOT
- 15.9 Intrinsic Landscaping
- Intrinsic Landscaping - Overview
- Intrinsic Landscaping - Product / Service
- Intrinsic Landscaping - Key offerings
- SWOT
- 15.10 LiveRoof Global LLC
- LiveRoof Global LLC - Overview
- LiveRoof Global LLC - Product / Service
- LiveRoof Global LLC - Key offerings
- SWOT
- 15.11 Onduline Group SAS
- Onduline Group SAS - Overview
- Onduline Group SAS - Product / Service
- Onduline Group SAS - Key offerings
- SWOT
- 15.12 Optigrun international AG
- Optigrun international AG - Overview
- Optigrun international AG - Product / Service
- Optigrun international AG - Key offerings
- SWOT
- 15.13 RENOLIT SE
- RENOLIT SE - Overview
- RENOLIT SE - Product / Service
- RENOLIT SE - Key offerings
- SWOT
- 15.14 Sempergreen
- Sempergreen - Overview
- Sempergreen - Product / Service
- Sempergreen - Key offerings
- SWOT
- 15.15 Sika AG
- Sika AG - Overview
- Sika AG - Business segments
- Sika AG - Key news
- Sika AG - Key offerings
- Sika AG - Segment focus
- SWOT
- 15.16 SkyGarden
- SkyGarden - Overview
- SkyGarden - Product / Service
- SkyGarden - Key offerings
- SWOT
- 15.17 Skyland USA
- Skyland USA - Overview
- Skyland USA - Product / Service
- Skyland USA - Key offerings
- SWOT
- 15.18 TOPGREEN Grundachsysteme
- TOPGREEN Grundachsysteme - Overview
- TOPGREEN Grundachsysteme - Product / Service
- TOPGREEN Grundachsysteme - Key offerings
- SWOT
16 Appendix
- 16.1 Scope of the report
- 16.2 Inclusions and exclusions checklist
- Inclusions checklist
- Exclusions checklist
- 16.3 Currency conversion rates for US$
- Currency conversion rates for US$
- 16.4 Research methodology
- Research methodology
- 16.5 Data procurement
- Information sources
- 16.6 Data validation
- Data validation
- 16.7 Validation techniques employed for market sizing
- Validation techniques employed for market sizing
- 16.8 Data synthesis
- Data synthesis
- 16.9 360 degree market analysis
- 360 degree market analysis
- 16.10 List of abbreviations
- List of abbreviations

