|
|
市場調査レポート
商品コード
1583968
自動車用トレーラーの世界市場 (2024~2028年)Global Automotive Trailer Market 2024-2028 |
||||||

|
|||||||
カスタマイズ可能
|
|||||||

| 自動車用トレーラーの世界市場 (2024~2028年) |
|
出版日: 2024年08月12日
発行: TechNavio
ページ情報: 英文 178 Pages
納期: 即納可能
|

全表示
- 概要
- 図表
- 目次
自動車用トレーラー市場は2023年から2028年に75億米ドル分拡大し、予測期間中に4.46%のCAGRで成長すると予測されます。
当レポートでは、自動車用トレーラー市場の全体的な分析、市場規模・予測、動向、成長促進要因、課題、約25社のベンダーを網羅したベンダー分析などを掲載しています。
当レポートでは、現在の市場シナリオ、最新動向と促進要因、市場環境全体に関する最新分析を提供しています。当市場は運輸・ロジスティクス業界の急成長や、欧州のロジスティクス部門からの需要増加、排出ガスや燃料消費に関する厳しい規制などが牽引しています。
| 市場範囲 | |
|---|---|
| 基準年 | 2024年 |
| 終了年 | 2028年 |
| 予測期間 | 2024~2028年 |
| 成長モメンタム | 加速 |
| 前年比 (2024年) | 4.22% |
| CAGR | 4.46% |
| 増分額 | 75億米ドル |
当レポートでは、製品技術の進歩が今後数年間の自動車用トレーラー市場の成長を促進する主な要因の1つであるとしています。また、電動化トレーラー技術やトラック隊列走行(プラトゥーニング)の概念がセミトレーラーの需要に拍車をかけ、市場の大きな需要につながると思われます。
目次
第1章 エグゼクティブサマリー
- 市場概要
第2章 市場情勢
- 市場エコシステム
- 市場の特徴
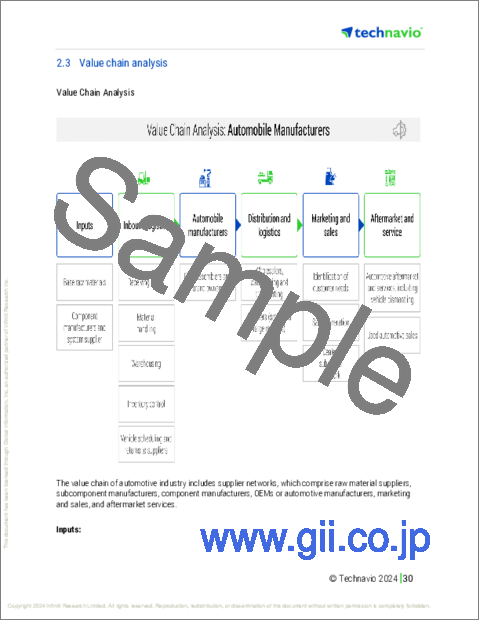
- バリューチェーン分析
第3章 市場規模の評価
- 市場の定義
- 市場セグメント分析
- 市場規模 (2023年)
- 市場の見通し (2023~2028年)
第4章 市場規模実績
- 自動車用トレーラーの世界市場 (2018~2022年)
- 種類別分析 (2018~2022年)
- 車両別分析 (2018~2022年)
- 地域別分析 (2018~2022年)
- 国別分析 (2018~2022年)
第5章 ファイブフォース分析
- ファイブフォースの要約
- 買い手の交渉力
- 供給企業の交渉力
- 新規参入業者の脅威
- 代替品の脅威
- 競争の脅威
- 市況
第6章 種類別市場セグメンテーション
- 市場セグメンテーション
- 比較:種類別
- ドライトレーラー:市場規模と予測 (2023~2028年)
- 冷蔵トレーラー:市場規模と予測 (2023~2028年)
- タンクトレーラー:市場規模と予測 (2023~2028年)
- 平台トレーラー:市場規模と予測 (2023~2028年)
- その他:市場規模と予測 (2023~2028年)
- 種類別の市場機会
第7章 車種別の市場セグメンテーション
- 市場セグメンテーション
- 比較:車種別
- 商用車:市場規模と予測 (2023~2028年)
- 乗用車:市場規模と予測 (2023~2028年)
- 二輪車・自転車:市場規模と予測 (2023~2028年)
- 車種別の市場機会
第8章 顧客情勢
- 顧客情勢の概要
第9章 地域別情勢
- 地域別セグメンテーション
- 地域別比較
- アジア太平洋:市場規模と予測 (2023~2028年)
- 欧州:市場規模と予測 (2023~2028年)
- 北米:市場規模と予測 (2023~2028年)
- 南米:市場規模と予測 (2023~2028年)
- 中東・アフリカ:市場規模と予測 (2023~2028年)
- 中国:市場規模と予測 (2023~2028年)
- 米国:市場規模と予測 (2023~2028年)
- ドイツ:市場規模と予測 (2023~2028年)
- インド:市場規模と予測 (2023~2028年)
- 英国:市場規模と予測 (2023~2028年)
- 地域別の市場機会
第10章 促進要因・課題・機会・抑制要因
- 市場促進要因
- 市場の課題
- 促進要因と課題の影響
- 市場の機会・抑制要因
第11章 競合情勢
- 概要
- 競合情勢
- 混乱の状況
- 業界のリスク
第12章 競合分析
- 企業プロファイル
- 企業の市場ポジショニング
- ACPS Automotive GmbH
- Big Tex Trailer Manufacturing LLC
- Bockmann Fahrzeugwerke GmbH
- Brian James Trailers Ltd.
- China International Marine Containers Group Ltd.
- Dennison Trailers Ltd.
- Europe Trailers Pty Ltd.
- Great Dane LLC
- Heil Trailer International
- Humbaur GmbH
- Hyundai Motor Group
- Ifor Williams Trailers Ltd.
- MCR Safety
- Schmitz Cargobull AG
- Wabash National Corp.
第13章 付録
Exhibits:
- Exhibits1: Executive Summary - Chart on Market Overview
- Exhibits2: Executive Summary - Data Table on Market Overview
- Exhibits3: Executive Summary - Chart on Global Market Characteristics
- Exhibits4: Executive Summary - Chart on Market By Geographical Landscape
- Exhibits5: Executive Summary - Chart on Market Segmentation by Type
- Exhibits6: Executive Summary - Chart on Market Segmentation by Vehicle Type
- Exhibits7: Executive Summary - Chart on Incremental Growth
- Exhibits8: Executive Summary - Data Table on Incremental Growth
- Exhibits9: Executive Summary - Chart on Company Market Positioning
- Exhibits10: Parent Market
- Exhibits11: Data Table on - Parent Market
- Exhibits12: Market characteristics analysis
- Exhibits13: Value Chain Analysis
- Exhibits14: Offerings of companies included in the market definition
- Exhibits15: Market segments
- Exhibits16: Chart on Global - Market size and forecast 2023-2028 ($ billion)
- Exhibits17: Data Table on Global - Market size and forecast 2023-2028 ($ billion)
- Exhibits18: Chart on Global Market: Year-over-year growth 2023-2028 (%)
- Exhibits19: Data Table on Global Market: Year-over-year growth 2023-2028 (%)
- Exhibits20: Historic Market Size - Data Table on Global Automotive Trailer Market 2018 - 2022 ($ billion)
- Exhibits21: Historic Market Size - Type Segment 2018 - 2022 ($ billion)
- Exhibits22: Historic Market Size - Vehicle Type Segment 2018 - 2022 ($ billion)
- Exhibits23: Historic Market Size - Geography Segment 2018 - 2022 ($ billion)
- Exhibits24: Historic Market Size - Country Segment 2018 - 2022 ($ billion)
- Exhibits25: Five forces analysis - Comparison between 2023 and 2028
- Exhibits26: Bargaining power of buyers - Impact of key factors 2023 and 2028
- Exhibits27: Bargaining power of suppliers - Impact of key factors in 2023 and 2028
- Exhibits28: Threat of new entrants - Impact of key factors in 2023 and 2028
- Exhibits29: Threat of substitutes - Impact of key factors in 2023 and 2028
- Exhibits30: Threat of rivalry - Impact of key factors in 2023 and 2028
- Exhibits31: Chart on Market condition - Five forces 2023 and 2028
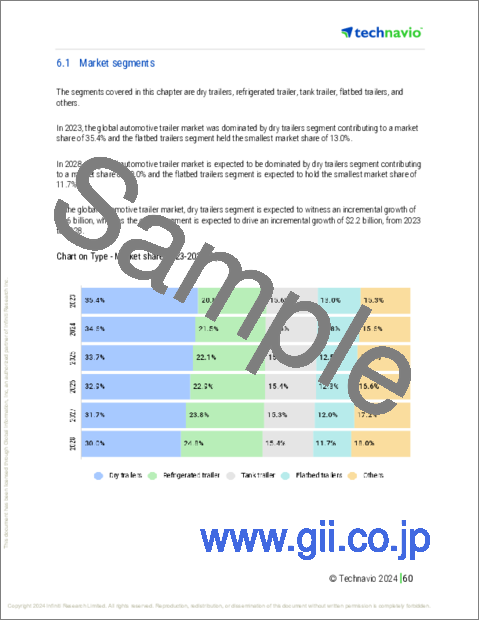
- Exhibits32: Chart on Type - Market share 2023-2028 (%)
- Exhibits33: Data Table on Type - Market share 2023-2028 (%)
- Exhibits34: Chart on Comparison by Type
- Exhibits35: Data Table on Comparison by Type
- Exhibits36: Chart on Dry trailers - Market size and forecast 2023-2028 ($ billion)
- Exhibits37: Data Table on Dry trailers - Market size and forecast 2023-2028 ($ billion)
- Exhibits38: Chart on Dry trailers - Year-over-year growth 2023-2028 (%)
- Exhibits39: Data Table on Dry trailers - Year-over-year growth 2023-2028 (%)
- Exhibits40: Chart on Refrigerated trailer - Market size and forecast 2023-2028 ($ billion)
- Exhibits41: Data Table on Refrigerated trailer - Market size and forecast 2023-2028 ($ billion)
- Exhibits42: Chart on Refrigerated trailer - Year-over-year growth 2023-2028 (%)
- Exhibits43: Data Table on Refrigerated trailer - Year-over-year growth 2023-2028 (%)
- Exhibits44: Chart on Tank trailer - Market size and forecast 2023-2028 ($ billion)
- Exhibits45: Data Table on Tank trailer - Market size and forecast 2023-2028 ($ billion)
- Exhibits46: Chart on Tank trailer - Year-over-year growth 2023-2028 (%)
- Exhibits47: Data Table on Tank trailer - Year-over-year growth 2023-2028 (%)
- Exhibits48: Chart on Flatbed trailers - Market size and forecast 2023-2028 ($ billion)
- Exhibits49: Data Table on Flatbed trailers - Market size and forecast 2023-2028 ($ billion)
- Exhibits50: Chart on Flatbed trailers - Year-over-year growth 2023-2028 (%)
- Exhibits51: Data Table on Flatbed trailers - Year-over-year growth 2023-2028 (%)
- Exhibits52: Chart on Others - Market size and forecast 2023-2028 ($ billion)
- Exhibits53: Data Table on Others - Market size and forecast 2023-2028 ($ billion)
- Exhibits54: Chart on Others - Year-over-year growth 2023-2028 (%)
- Exhibits55: Data Table on Others - Year-over-year growth 2023-2028 (%)
- Exhibits56: Market opportunity by Type ($ billion)
- Exhibits57: Data Table on Market opportunity by Type ($ billion)
- Exhibits58: Chart on Vehicle Type - Market share 2023-2028 (%)
- Exhibits59: Data Table on Vehicle Type - Market share 2023-2028 (%)
- Exhibits60: Chart on Comparison by Vehicle Type
- Exhibits61: Data Table on Comparison by Vehicle Type
- Exhibits62: Chart on Commercial vehicle - Market size and forecast 2023-2028 ($ billion)
- Exhibits63: Data Table on Commercial vehicle - Market size and forecast 2023-2028 ($ billion)
- Exhibits64: Chart on Commercial vehicle - Year-over-year growth 2023-2028 (%)
- Exhibits65: Data Table on Commercial vehicle - Year-over-year growth 2023-2028 (%)
- Exhibits66: Chart on Passenger car - Market size and forecast 2023-2028 ($ billion)
- Exhibits67: Data Table on Passenger car - Market size and forecast 2023-2028 ($ billion)
- Exhibits68: Chart on Passenger car - Year-over-year growth 2023-2028 (%)
- Exhibits69: Data Table on Passenger car - Year-over-year growth 2023-2028 (%)
- Exhibits70: Chart on Two-wheeler and bicycle - Market size and forecast 2023-2028 ($ billion)
- Exhibits71: Data Table on Two-wheeler and bicycle - Market size and forecast 2023-2028 ($ billion)
- Exhibits72: Chart on Two-wheeler and bicycle - Year-over-year growth 2023-2028 (%)
- Exhibits73: Data Table on Two-wheeler and bicycle - Year-over-year growth 2023-2028 (%)
- Exhibits74: Market opportunity by Vehicle Type ($ billion)
- Exhibits75: Data Table on Market opportunity by Vehicle Type ($ billion)
- Exhibits76: Analysis of price sensitivity, lifecycle, customer purchase basket, adoption rates, and purchase criteria
- Exhibits77: Chart on Market share By Geographical Landscape 2023-2028 (%)
- Exhibits78: Data Table on Market share By Geographical Landscape 2023-2028 (%)
- Exhibits79: Chart on Geographic comparison
- Exhibits80: Data Table on Geographic comparison
- Exhibits81: Chart on APAC - Market size and forecast 2023-2028 ($ billion)
- Exhibits82: Data Table on APAC - Market size and forecast 2023-2028 ($ billion)
- Exhibits83: Chart on APAC - Year-over-year growth 2023-2028 (%)
- Exhibits84: Data Table on APAC - Year-over-year growth 2023-2028 (%)
- Exhibits85: Chart on Europe - Market size and forecast 2023-2028 ($ billion)
- Exhibits86: Data Table on Europe - Market size and forecast 2023-2028 ($ billion)
- Exhibits87: Chart on Europe - Year-over-year growth 2023-2028 (%)
- Exhibits88: Data Table on Europe - Year-over-year growth 2023-2028 (%)
- Exhibits89: Chart on North America - Market size and forecast 2023-2028 ($ billion)
- Exhibits90: Data Table on North America - Market size and forecast 2023-2028 ($ billion)
- Exhibits91: Chart on North America - Year-over-year growth 2023-2028 (%)
- Exhibits92: Data Table on North America - Year-over-year growth 2023-2028 (%)
- Exhibits93: Chart on South America - Market size and forecast 2023-2028 ($ billion)
- Exhibits94: Data Table on South America - Market size and forecast 2023-2028 ($ billion)
- Exhibits95: Chart on South America - Year-over-year growth 2023-2028 (%)
- Exhibits96: Data Table on South America - Year-over-year growth 2023-2028 (%)
- Exhibits97: Chart on Middle East and Africa - Market size and forecast 2023-2028 ($ billion)
- Exhibits98: Data Table on Middle East and Africa - Market size and forecast 2023-2028 ($ billion)
- Exhibits99: Chart on Middle East and Africa - Year-over-year growth 2023-2028 (%)
- Exhibits100: Data Table on Middle East and Africa - Year-over-year growth 2023-2028 (%)
- Exhibits101: Chart on China - Market size and forecast 2023-2028 ($ billion)
- Exhibits102: Data Table on China - Market size and forecast 2023-2028 ($ billion)
- Exhibits103: Chart on China - Year-over-year growth 2023-2028 (%)
- Exhibits104: Data Table on China - Year-over-year growth 2023-2028 (%)
- Exhibits105: Chart on US - Market size and forecast 2023-2028 ($ billion)
- Exhibits106: Data Table on US - Market size and forecast 2023-2028 ($ billion)
- Exhibits107: Chart on US - Year-over-year growth 2023-2028 (%)
- Exhibits108: Data Table on US - Year-over-year growth 2023-2028 (%)
- Exhibits109: Chart on Germany - Market size and forecast 2023-2028 ($ billion)
- Exhibits110: Data Table on Germany - Market size and forecast 2023-2028 ($ billion)
- Exhibits111: Chart on Germany - Year-over-year growth 2023-2028 (%)
- Exhibits112: Data Table on Germany - Year-over-year growth 2023-2028 (%)
- Exhibits113: Chart on India - Market size and forecast 2023-2028 ($ billion)
- Exhibits114: Data Table on India - Market size and forecast 2023-2028 ($ billion)
- Exhibits115: Chart on India - Year-over-year growth 2023-2028 (%)
- Exhibits116: Data Table on India - Year-over-year growth 2023-2028 (%)
- Exhibits117: Chart on UK - Market size and forecast 2023-2028 ($ billion)
- Exhibits118: Data Table on UK - Market size and forecast 2023-2028 ($ billion)
- Exhibits119: Chart on UK - Year-over-year growth 2023-2028 (%)
- Exhibits120: Data Table on UK - Year-over-year growth 2023-2028 (%)
- Exhibits121: Market opportunity By Geographical Landscape ($ billion)
- Exhibits122: Data Tables on Market opportunity By Geographical Landscape ($ billion)
- Exhibits123: Impact of drivers and challenges in 2023 and 2028
- Exhibits124: Overview on criticality of inputs and factors of differentiation
- Exhibits125: Overview on factors of disruption
- Exhibits126: Impact of key risks on business
- Exhibits127: Companies covered
- Exhibits128: Matrix on companies position and classification
- Exhibits129: ACPS Automotive GmbH - Overview
- Exhibits130: ACPS Automotive GmbH - Product / Service
- Exhibits131: ACPS Automotive GmbH - Key offerings
- Exhibits132: Big Tex Trailer Manufacturing LLC - Overview
- Exhibits133: Big Tex Trailer Manufacturing LLC - Product / Service
- Exhibits134: Big Tex Trailer Manufacturing LLC - Key offerings
- Exhibits135: Bockmann Fahrzeugwerke GmbH - Overview
- Exhibits136: Bockmann Fahrzeugwerke GmbH - Product / Service
- Exhibits137: Bockmann Fahrzeugwerke GmbH - Key offerings
- Exhibits138: Brian James Trailers Ltd. - Overview
- Exhibits139: Brian James Trailers Ltd. - Product / Service
- Exhibits140: Brian James Trailers Ltd. - Key offerings
- Exhibits141: China International Marine Containers Group Ltd. - Overview
- Exhibits142: China International Marine Containers Group Ltd. - Business segments
- Exhibits143: China International Marine Containers Group Ltd. - Key offerings
- Exhibits144: China International Marine Containers Group Ltd. - Segment focus
- Exhibits145: Dennison Trailers Ltd. - Overview
- Exhibits146: Dennison Trailers Ltd. - Product / Service
- Exhibits147: Dennison Trailers Ltd. - Key offerings
- Exhibits148: Europe Trailers Pty Ltd. - Overview
- Exhibits149: Europe Trailers Pty Ltd. - Product / Service
- Exhibits150: Europe Trailers Pty Ltd. - Key offerings
- Exhibits151: Great Dane LLC - Overview
- Exhibits152: Great Dane LLC - Product / Service
- Exhibits153: Great Dane LLC - Key offerings
- Exhibits154: Heil Trailer International - Overview
- Exhibits155: Heil Trailer International - Product / Service
- Exhibits156: Heil Trailer International - Key offerings
- Exhibits157: Humbaur GmbH - Overview
- Exhibits158: Humbaur GmbH - Product / Service
- Exhibits159: Humbaur GmbH - Key offerings
- Exhibits160: Hyundai Motor Group - Overview
- Exhibits161: Hyundai Motor Group - Business segments
- Exhibits162: Hyundai Motor Group - Key news
- Exhibits163: Hyundai Motor Group - Key offerings
- Exhibits164: Hyundai Motor Group - Segment focus
- Exhibits165: Ifor Williams Trailers Ltd. - Overview
- Exhibits166: Ifor Williams Trailers Ltd. - Product / Service
- Exhibits167: Ifor Williams Trailers Ltd. - Key offerings
- Exhibits168: MCR Safety - Overview
- Exhibits169: MCR Safety - Product / Service
- Exhibits170: MCR Safety - Key offerings
- Exhibits171: Schmitz Cargobull AG - Overview
- Exhibits172: Schmitz Cargobull AG - Product / Service
- Exhibits173: Schmitz Cargobull AG - Key offerings
- Exhibits174: Wabash National Corp. - Overview
- Exhibits175: Wabash National Corp. - Business segments
- Exhibits176: Wabash National Corp. - Key offerings
- Exhibits177: Wabash National Corp. - Segment focus
- Exhibits178: Inclusions checklist
- Exhibits179: Exclusions checklist
- Exhibits180: Currency conversion rates for US$
- Exhibits181: Research methodology
- Exhibits182: Information sources
- Exhibits183: Data validation
- Exhibits184: Validation techniques employed for market sizing
- Exhibits185: Data synthesis
- Exhibits186: 360 degree market analysis
- Exhibits187: List of abbreviations
The automotive trailer market is forecasted to grow by USD 7.5 bn during 2023-2028, accelerating at a CAGR of 4.46% during the forecast period. The report on the automotive trailer market provides a holistic analysis, market size and forecast, trends, growth drivers, and challenges, as well as vendor analysis covering around 25 vendors.
The report offers an up-to-date analysis regarding the current market scenario, the latest trends and drivers, and the overall market environment. The market is driven by rapidly growing transportation and logistics industry, increasing demand from european logistics sector, and stringent regulations on emissions and fuel consumption.
Technavio's automotive trailer market is segmented as below:
| Market Scope | |
|---|---|
| Base Year | 2024 |
| End Year | 2028 |
| Series Year | 2024-2028 |
| Growth Momentum | Accelerate |
| YOY 2024 | 4.22% |
| CAGR | 4.46% |
| Incremental Value | $7.5 bn |
By Type
- Dry trailers
- Refrigerated trailer
- Tank trailer
- Flatbed trailers
- Others
By Vehicle Type
- Commercial vehicle
- Passenger car
- Two-wheeler and bicycle
By Geographical Landscape
- APAC
- Europe
- North America
- South America
- Middle East and Africa
This study identifies the advancements in product technologies as one of the prime reasons driving the automotive trailer market growth during the next few years. Also, electrified trailer technologies and truck platooning concept spurring demand for semi-trailers will lead to sizable demand in the market.
The report on the automotive trailer market covers the following areas:
- Automotive trailer market sizing
- Automotive trailer market forecast
- Automotive trailer market industry analysis
The robust vendor analysis is designed to help clients improve their market position, and in line with this, this report provides a detailed analysis of several leading automotive trailer market vendors that include ACPS Automotive GmbH, Big Tex Trailer Manufacturing LLC, Bockmann Fahrzeugwerke GmbH, Brian James Trailers Ltd., China International Marine Containers Group Ltd., Dennison Trailers Ltd., Europe Trailers Pty Ltd., Great Dane LLC, Heil Trailer International, Humbaur GmbH, Hyundai Motor Group, Ifor Williams Trailers Ltd., Kentucky Trailer, MAXX-D Trailers, MCR Safety, Miller Industries Inc, Pace American Trailers, Premier Trailer Mfg. Inc., Schmitz Cargobull AG, and Wabash National Corp.. Also, the automotive trailer market analysis report includes information on upcoming trends and challenges that will influence market growth. This is to help companies strategize and leverage all forthcoming growth opportunities.
The study was conducted using an objective combination of primary and secondary information including inputs from key participants in the industry. The report contains a comprehensive market and vendor landscape in addition to an analysis of the key vendors.
The publisher presents a detailed picture of the market by the way of study, synthesis, and summation of data from multiple sources by an analysis of key parameters such as profit, pricing, competition, and promotions. It presents various market facets by identifying the key industry influencers. The data presented is comprehensive, reliable, and a result of extensive research - both primary and secondary. The market research reports provide a complete competitive landscape and an in-depth vendor selection methodology and analysis using qualitative and quantitative research to forecast the accurate market growth.
Table of Contents
1 Executive Summary
- 1.1 Market overview
- Executive Summary - Chart on Market Overview
- Executive Summary - Data Table on Market Overview
- Executive Summary - Chart on Global Market Characteristics
- Executive Summary - Chart on Market By Geographical Landscape
- Executive Summary - Chart on Market Segmentation by Type
- Executive Summary - Chart on Market Segmentation by Vehicle Type
- Executive Summary - Chart on Incremental Growth
- Executive Summary - Data Table on Incremental Growth
- Executive Summary - Chart on Company Market Positioning
2 Market Landscape
- 2.1 Market ecosystem
- Parent Market
- Data Table on - Parent Market
- 2.2 Market characteristics
- Market characteristics analysis
- 2.3 Value chain analysis
- Value Chain Analysis
3 Market Sizing
- 3.1 Market definition
- Offerings of companies included in the market definition
- 3.2 Market segment analysis
- Market segments
- 3.3 Market size 2023
- 3.4 Market outlook: Forecast for 2023-2028
- Chart on Global - Market size and forecast 2023-2028 ($ billion)
- Data Table on Global - Market size and forecast 2023-2028 ($ billion)
- Chart on Global Market: Year-over-year growth 2023-2028 (%)
- Data Table on Global Market: Year-over-year growth 2023-2028 (%)
4 Historic Market Size
- 4.1 Global Automotive Trailer Market 2018 - 2022
- Historic Market Size - Data Table on Global Automotive Trailer Market 2018 - 2022 ($ billion)
- 4.2 Type segment analysis 2018 - 2022
- Historic Market Size - Type Segment 2018 - 2022 ($ billion)
- 4.3 Vehicle Type segment analysis 2018 - 2022
- Historic Market Size - Vehicle Type Segment 2018 - 2022 ($ billion)
- 4.4 Geography segment analysis 2018 - 2022
- Historic Market Size - Geography Segment 2018 - 2022 ($ billion)
- 4.5 Country segment analysis 2018 - 2022
- Historic Market Size - Country Segment 2018 - 2022 ($ billion)
5 Five Forces Analysis
- 5.1 Five forces summary
- Five forces analysis - Comparison between 2023 and 2028
- 5.2 Bargaining power of buyers
- Bargaining power of buyers - Impact of key factors 2023 and 2028
- 5.3 Bargaining power of suppliers
- Bargaining power of suppliers - Impact of key factors in 2023 and 2028
- 5.4 Threat of new entrants
- Threat of new entrants - Impact of key factors in 2023 and 2028
- 5.5 Threat of substitutes
- Threat of substitutes - Impact of key factors in 2023 and 2028
- 5.6 Threat of rivalry
- Threat of rivalry - Impact of key factors in 2023 and 2028
- 5.7 Market condition
- Chart on Market condition - Five forces 2023 and 2028
6 Market Segmentation by Type
- 6.1 Market segments
- Chart on Type - Market share 2023-2028 (%)
- Data Table on Type - Market share 2023-2028 (%)
- 6.2 Comparison by Type
- Chart on Comparison by Type
- Data Table on Comparison by Type
- 6.3 Dry trailers - Market size and forecast 2023-2028
- Chart on Dry trailers - Market size and forecast 2023-2028 ($ billion)
- Data Table on Dry trailers - Market size and forecast 2023-2028 ($ billion)
- Chart on Dry trailers - Year-over-year growth 2023-2028 (%)
- Data Table on Dry trailers - Year-over-year growth 2023-2028 (%)
- 6.4 Refrigerated trailer - Market size and forecast 2023-2028
- Chart on Refrigerated trailer - Market size and forecast 2023-2028 ($ billion)
- Data Table on Refrigerated trailer - Market size and forecast 2023-2028 ($ billion)
- Chart on Refrigerated trailer - Year-over-year growth 2023-2028 (%)
- Data Table on Refrigerated trailer - Year-over-year growth 2023-2028 (%)
- 6.5 Tank trailer - Market size and forecast 2023-2028
- Chart on Tank trailer - Market size and forecast 2023-2028 ($ billion)
- Data Table on Tank trailer - Market size and forecast 2023-2028 ($ billion)
- Chart on Tank trailer - Year-over-year growth 2023-2028 (%)
- Data Table on Tank trailer - Year-over-year growth 2023-2028 (%)
- 6.6 Flatbed trailers - Market size and forecast 2023-2028
- Chart on Flatbed trailers - Market size and forecast 2023-2028 ($ billion)
- Data Table on Flatbed trailers - Market size and forecast 2023-2028 ($ billion)
- Chart on Flatbed trailers - Year-over-year growth 2023-2028 (%)
- Data Table on Flatbed trailers - Year-over-year growth 2023-2028 (%)
- 6.7 Others - Market size and forecast 2023-2028
- Chart on Others - Market size and forecast 2023-2028 ($ billion)
- Data Table on Others - Market size and forecast 2023-2028 ($ billion)
- Chart on Others - Year-over-year growth 2023-2028 (%)
- Data Table on Others - Year-over-year growth 2023-2028 (%)
- 6.8 Market opportunity by Type
- Market opportunity by Type ($ billion)
- Data Table on Market opportunity by Type ($ billion)
7 Market Segmentation by Vehicle Type
- 7.1 Market segments
- Chart on Vehicle Type - Market share 2023-2028 (%)
- Data Table on Vehicle Type - Market share 2023-2028 (%)
- 7.2 Comparison by Vehicle Type
- Chart on Comparison by Vehicle Type
- Data Table on Comparison by Vehicle Type
- 7.3 Commercial vehicle - Market size and forecast 2023-2028
- Chart on Commercial vehicle - Market size and forecast 2023-2028 ($ billion)
- Data Table on Commercial vehicle - Market size and forecast 2023-2028 ($ billion)
- Chart on Commercial vehicle - Year-over-year growth 2023-2028 (%)
- Data Table on Commercial vehicle - Year-over-year growth 2023-2028 (%)
- 7.4 Passenger car - Market size and forecast 2023-2028
- Chart on Passenger car - Market size and forecast 2023-2028 ($ billion)
- Data Table on Passenger car - Market size and forecast 2023-2028 ($ billion)
- Chart on Passenger car - Year-over-year growth 2023-2028 (%)
- Data Table on Passenger car - Year-over-year growth 2023-2028 (%)
- 7.5 Two-wheeler and bicycle - Market size and forecast 2023-2028
- Chart on Two-wheeler and bicycle - Market size and forecast 2023-2028 ($ billion)
- Data Table on Two-wheeler and bicycle - Market size and forecast 2023-2028 ($ billion)
- Chart on Two-wheeler and bicycle - Year-over-year growth 2023-2028 (%)
- Data Table on Two-wheeler and bicycle - Year-over-year growth 2023-2028 (%)
- 7.6 Market opportunity by Vehicle Type
- Market opportunity by Vehicle Type ($ billion)
- Data Table on Market opportunity by Vehicle Type ($ billion)
8 Customer Landscape
- 8.1 Customer landscape overview
- Analysis of price sensitivity, lifecycle, customer purchase basket, adoption rates, and purchase criteria
9 Geographic Landscape
- 9.1 Geographic segmentation
- Chart on Market share By Geographical Landscape 2023-2028 (%)
- Data Table on Market share By Geographical Landscape 2023-2028 (%)
- 9.2 Geographic comparison
- Chart on Geographic comparison
- Data Table on Geographic comparison
- 9.3 APAC - Market size and forecast 2023-2028
- Chart on APAC - Market size and forecast 2023-2028 ($ billion)
- Data Table on APAC - Market size and forecast 2023-2028 ($ billion)
- Chart on APAC - Year-over-year growth 2023-2028 (%)
- Data Table on APAC - Year-over-year growth 2023-2028 (%)
- 9.4 Europe - Market size and forecast 2023-2028
- Chart on Europe - Market size and forecast 2023-2028 ($ billion)
- Data Table on Europe - Market size and forecast 2023-2028 ($ billion)
- Chart on Europe - Year-over-year growth 2023-2028 (%)
- Data Table on Europe - Year-over-year growth 2023-2028 (%)
- 9.5 North America - Market size and forecast 2023-2028
- Chart on North America - Market size and forecast 2023-2028 ($ billion)
- Data Table on North America - Market size and forecast 2023-2028 ($ billion)
- Chart on North America - Year-over-year growth 2023-2028 (%)
- Data Table on North America - Year-over-year growth 2023-2028 (%)
- 9.6 South America - Market size and forecast 2023-2028
- Chart on South America - Market size and forecast 2023-2028 ($ billion)
- Data Table on South America - Market size and forecast 2023-2028 ($ billion)
- Chart on South America - Year-over-year growth 2023-2028 (%)
- Data Table on South America - Year-over-year growth 2023-2028 (%)
- 9.7 Middle East and Africa - Market size and forecast 2023-2028
- Chart on Middle East and Africa - Market size and forecast 2023-2028 ($ billion)
- Data Table on Middle East and Africa - Market size and forecast 2023-2028 ($ billion)
- Chart on Middle East and Africa - Year-over-year growth 2023-2028 (%)
- Data Table on Middle East and Africa - Year-over-year growth 2023-2028 (%)
- 9.8 China - Market size and forecast 2023-2028
- Chart on China - Market size and forecast 2023-2028 ($ billion)
- Data Table on China - Market size and forecast 2023-2028 ($ billion)
- Chart on China - Year-over-year growth 2023-2028 (%)
- Data Table on China - Year-over-year growth 2023-2028 (%)
- 9.9 US - Market size and forecast 2023-2028
- Chart on US - Market size and forecast 2023-2028 ($ billion)
- Data Table on US - Market size and forecast 2023-2028 ($ billion)
- Chart on US - Year-over-year growth 2023-2028 (%)
- Data Table on US - Year-over-year growth 2023-2028 (%)
- 9.10 Germany - Market size and forecast 2023-2028
- Chart on Germany - Market size and forecast 2023-2028 ($ billion)
- Data Table on Germany - Market size and forecast 2023-2028 ($ billion)
- Chart on Germany - Year-over-year growth 2023-2028 (%)
- Data Table on Germany - Year-over-year growth 2023-2028 (%)
- 9.11 India - Market size and forecast 2023-2028
- Chart on India - Market size and forecast 2023-2028 ($ billion)
- Data Table on India - Market size and forecast 2023-2028 ($ billion)
- Chart on India - Year-over-year growth 2023-2028 (%)
- Data Table on India - Year-over-year growth 2023-2028 (%)
- 9.12 UK - Market size and forecast 2023-2028
- Chart on UK - Market size and forecast 2023-2028 ($ billion)
- Data Table on UK - Market size and forecast 2023-2028 ($ billion)
- Chart on UK - Year-over-year growth 2023-2028 (%)
- Data Table on UK - Year-over-year growth 2023-2028 (%)
- 9.13 Market opportunity By Geographical Landscape
- Market opportunity By Geographical Landscape ($ billion)
- Data Tables on Market opportunity By Geographical Landscape ($ billion)
10 Drivers, Challenges, and Opportunity/Restraints
- 10.1 Market drivers
- 10.2 Market challenges
- 10.3 Impact of drivers and challenges
- Impact of drivers and challenges in 2023 and 2028
- 10.4 Market opportunities/restraints
11 Competitive Landscape
- 11.1 Overview
- 11.2 Competitive Landscape
- Overview on criticality of inputs and factors of differentiation
- 11.3 Landscape disruption
- Overview on factors of disruption
- 11.4 Industry risks
- Impact of key risks on business
12 Competitive Analysis
- 12.1 Companies profiled
- Companies covered
- 12.2 Market positioning of companies
- Matrix on companies position and classification
- 12.3 ACPS Automotive GmbH
- ACPS Automotive GmbH - Overview
- ACPS Automotive GmbH - Product / Service
- ACPS Automotive GmbH - Key offerings
- 12.4 Big Tex Trailer Manufacturing LLC
- Big Tex Trailer Manufacturing LLC - Overview
- Big Tex Trailer Manufacturing LLC - Product / Service
- Big Tex Trailer Manufacturing LLC - Key offerings
- 12.5 Bockmann Fahrzeugwerke GmbH
- Bockmann Fahrzeugwerke GmbH - Overview
- Bockmann Fahrzeugwerke GmbH - Product / Service
- Bockmann Fahrzeugwerke GmbH - Key offerings
- 12.6 Brian James Trailers Ltd.
- Brian James Trailers Ltd. - Overview
- Brian James Trailers Ltd. - Product / Service
- Brian James Trailers Ltd. - Key offerings
- 12.7 China International Marine Containers Group Ltd.
- China International Marine Containers Group Ltd. - Overview
- China International Marine Containers Group Ltd. - Business segments
- China International Marine Containers Group Ltd. - Key offerings
- China International Marine Containers Group Ltd. - Segment focus
- 12.8 Dennison Trailers Ltd.
- Dennison Trailers Ltd. - Overview
- Dennison Trailers Ltd. - Product / Service
- Dennison Trailers Ltd. - Key offerings
- 12.9 Europe Trailers Pty Ltd.
- Europe Trailers Pty Ltd. - Overview
- Europe Trailers Pty Ltd. - Product / Service
- Europe Trailers Pty Ltd. - Key offerings
- 12.10 Great Dane LLC
- Great Dane LLC - Overview
- Great Dane LLC - Product / Service
- Great Dane LLC - Key offerings
- 12.11 Heil Trailer International
- Heil Trailer International - Overview
- Heil Trailer International - Product / Service
- Heil Trailer International - Key offerings
- 12.12 Humbaur GmbH
- Humbaur GmbH - Overview
- Humbaur GmbH - Product / Service
- Humbaur GmbH - Key offerings
- 12.13 Hyundai Motor Group
- Hyundai Motor Group - Overview
- Hyundai Motor Group - Business segments
- Hyundai Motor Group - Key news
- Hyundai Motor Group - Key offerings
- Hyundai Motor Group - Segment focus
- 12.14 Ifor Williams Trailers Ltd.
- Ifor Williams Trailers Ltd. - Overview
- Ifor Williams Trailers Ltd. - Product / Service
- Ifor Williams Trailers Ltd. - Key offerings
- 12.15 MCR Safety
- MCR Safety - Overview
- MCR Safety - Product / Service
- MCR Safety - Key offerings
- 12.16 Schmitz Cargobull AG
- Schmitz Cargobull AG - Overview
- Schmitz Cargobull AG - Product / Service
- Schmitz Cargobull AG - Key offerings
- 12.17 Wabash National Corp.
- Wabash National Corp. - Overview
- Wabash National Corp. - Business segments
- Wabash National Corp. - Key offerings
- Wabash National Corp. - Segment focus
13 Appendix
- 13.1 Scope of the report
- 13.2 Inclusions and exclusions checklist
- Inclusions checklist
- Exclusions checklist
- 13.3 Currency conversion rates for US$
- Currency conversion rates for US$
- 13.4 Research methodology
- Research methodology
- 13.5 Data procurement
- Information sources
- 13.6 Data validation
- Data validation
- 13.7 Validation techniques employed for market sizing
- Validation techniques employed for market sizing
- 13.8 Data synthesis
- Data synthesis
- 13.9 360 degree market analysis
- 360 degree market analysis
- 13.10 List of abbreviations
- List of abbreviations

