|
|
市場調査レポート
商品コード
1502321
ホスピスの世界市場 2024-2028Global Hospice Market 2024-2028 |
||||||

|
|||||||
カスタマイズ可能
|
|||||||


| ホスピスの世界市場 2024-2028 |
|
出版日: 2024年05月22日
発行: TechNavio
ページ情報: 英文 171 Pages
納期: 即納可能
|

全表示
- 概要
- 図表
- 目次
Technavio社は、ホスピス市場をモニターしており、2023年から2028年にかけて1,111億米ドル、予測期間中のCAGRは4.88%で成長すると予測しています。
当レポートでは、ホスピス市場の全体的な分析、市場規模・予測、動向、成長促進要因、課題、約25のベンダーを網羅したベンダー分析などを掲載しています。
現在の市場シナリオ、最新動向と促進要因、市場環境全体に関する最新分析を提供しています。高齢者人口の増加、各国政府によるヘルスケア予算の増加、感染予防と患者の安全確保に対する需要の高まりが市場を牽引しています。
| 市場範囲 | |
|---|---|
| 基準年 | 2024 |
| 終了年 | 2028 |
| 予測期間 | 2024-2028 |
| 成長モメンタム | 加速 |
| 前年比2024年 | 3.86% |
| CAGR | 4.88% |
| 増分額 | 1,111億米ドル |
本調査では、今後数年間のホスピス市場成長を牽引する主な要因の1つとして、ホスピス環境における個人中心のケア重視の高まりを挙げています。また、いくつかのヘルスケア領域の拡大と成長、ホスピス分野の技術的進歩は、市場の大きな需要につながります。
目次
第1章 エグゼクティブサマリー
- 市場概要
第2章 市場情勢
- 市場エコシステム
第3章 市場規模の評価
- 市場の定義
- 市場セグメント分析
- 市場規模 2023
- 市場の見通し 2023-2028
第4章 市場規模実績
- ホスピスの世界市場 2018-2022
- エンドユーザー別セグメント分析 2018-2022
- タイプ別セグメント分析 2018-2022
- 地域別セグメント分析 2018-2022
- 国別セグメント分析 2018-2022
第5章 ファイブフォース分析
- ファイブフォースの要約
- 買い手の交渉力
- 供給企業の交渉力
- 新規参入業者の脅威
- 代替品の脅威
- 競争の脅威
- 市況
第6章 市場セグメンテーション:エンドユーザー別
- 市場セグメンテーション
- 比較:エンドユーザー別
- 在宅設定:市場規模と予測 2023-2028
- 病院:市場規模と予測 2023-2028
- 専門介護施設:市場規模と予測 2023-2028
- ホスピスケアセンター:市場規模と予測 2023-2028
- 市場機会:エンドユーザー別
第7章 市場セグメンテーション:タイプ別
- 市場セグメンテーション
- 比較:タイプ別
- 看護サービス:市場規模と予測 2023-2028
- 医療用品サービス:市場規模と予測 2023-2028
- 医師サービス:市場規模と予測 2023-2028
- 他のサービス:市場規模と予測 2023-2028
- 市場機会:タイプ別
第8章 顧客情勢
- 顧客情勢の概要
第9章 地域別情勢
- 地域別セグメンテーション
- 地域別比較
- 北米:市場規模と予測 2023-2028
- 欧州:市場規模と予測 2023-2028
- アジア太平洋:市場規模と予測 2023-2028
- 中東・アフリカ:市場規模と予測 2023-2028
- 南米:市場規模と予測 2023-2028
- 米国:市場規模と予測 2023-2028
- 英国:市場規模と予測 2023-2028
- ドイツ:市場規模と予測 2023-2028
- カナダ:市場規模と予測 2023-2028
- 中国:市場規模と予測 2023-2028
- 市場機会:地域別
第10章 促進要因、課題、および動向
- 市場促進要因
- 市場の課題
- 促進要因と課題の影響
- 市場動向
第11章 ベンダー情勢
- 概要
- ベンダー情勢
- 混乱の状況
- 業界のリスク
第12章 ベンダー分析
- 対象ベンダー
- ベンダーの市場ポジショニング
- AccentCare Inc.
- Amedisys Inc.
- BRISTOL HOSPICE LLC
- Brookdale Senior Living Inc.
- Caring Hospice Services
- Chemed Corp.
- Compassus
- Covenant Care
- Crossroads Hospice
- Four Seasons
- Hospice of the Valley
- LifePoint Health Inc.
- Providence
- Seasons Hospice
- UnitedHealth Group Inc.
第13章 付録
Exhibits:
- Exhibits1: Executive Summary - Chart on Market Overview
- Exhibits2: Executive Summary - Data Table on Market Overview
- Exhibits3: Executive Summary - Chart on Global Market Characteristics
- Exhibits4: Executive Summary - Chart on Market by Geography
- Exhibits5: Executive Summary - Chart on Market Segmentation by End-user
- Exhibits6: Executive Summary - Chart on Market Segmentation by Type
- Exhibits7: Executive Summary - Chart on Incremental Growth
- Exhibits8: Executive Summary - Data Table on Incremental Growth
- Exhibits9: Executive Summary - Chart on Vendor Market Positioning
- Exhibits10: Parent market
- Exhibits11: Market Characteristics
- Exhibits12: Offerings of vendors included in the market definition
- Exhibits13: Market segments
- Exhibits14: Chart on Global - Market size and forecast 2023-2028 ($ billion)
- Exhibits15: Data Table on Global - Market size and forecast 2023-2028 ($ billion)
- Exhibits16: Chart on Global Market: Year-over-year growth 2023-2028 (%)
- Exhibits17: Data Table on Global Market: Year-over-year growth 2023-2028 (%)
- Exhibits18: Historic Market Size - Data Table on global hospice market 2018 - 2022 ($ billion)
- Exhibits19: Historic Market Size - End-user Segment 2018 - 2022 ($ billion)
- Exhibits20: Historic Market Size - Type Segment 2018 - 2022 ($ billion)
- Exhibits21: Historic Market Size - Geography Segment 2018 - 2022 ($ billion)
- Exhibits22: Historic Market Size - Country Segment 2018 - 2022 ($ billion)
- Exhibits23: Five forces analysis - Comparison between 2023 and 2028
- Exhibits24: Chart on Bargaining power of buyers - Impact of key factors 2023 and 2028
- Exhibits25: Bargaining power of suppliers - Impact of key factors in 2023 and 2028
- Exhibits26: Threat of new entrants - Impact of key factors in 2023 and 2028
- Exhibits27: Threat of substitutes - Impact of key factors in 2023 and 2028
- Exhibits28: Threat of rivalry - Impact of key factors in 2023 and 2028
- Exhibits29: Chart on Market condition - Five forces 2023 and 2028
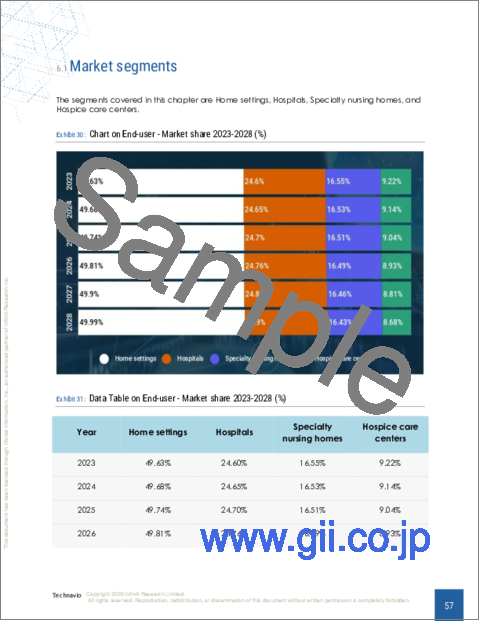
- Exhibits30: Chart on End-user - Market share 2023-2028 (%)
- Exhibits31: Data Table on End-user - Market share 2023-2028 (%)
- Exhibits32: Chart on Comparison by End-user
- Exhibits33: Data Table on Comparison by End-user
- Exhibits34: Chart on Home settings - Market size and forecast 2023-2028 ($ billion)
- Exhibits35: Data Table on Home settings - Market size and forecast 2023-2028 ($ billion)
- Exhibits36: Chart on Home settings - Year-over-year growth 2023-2028 (%)
- Exhibits37: Data Table on Home settings - Year-over-year growth 2023-2028 (%)
- Exhibits38: Chart on Hospitals - Market size and forecast 2023-2028 ($ billion)
- Exhibits39: Data Table on Hospitals - Market size and forecast 2023-2028 ($ billion)
- Exhibits40: Chart on Hospitals - Year-over-year growth 2023-2028 (%)
- Exhibits41: Data Table on Hospitals - Year-over-year growth 2023-2028 (%)
- Exhibits42: Chart on Specialty nursing homes - Market size and forecast 2023-2028 ($ billion)
- Exhibits43: Data Table on Specialty nursing homes - Market size and forecast 2023-2028 ($ billion)
- Exhibits44: Chart on Specialty nursing homes - Year-over-year growth 2023-2028 (%)
- Exhibits45: Data Table on Specialty nursing homes - Year-over-year growth 2023-2028 (%)
- Exhibits46: Chart on Hospice care centers - Market size and forecast 2023-2028 ($ billion)
- Exhibits47: Data Table on Hospice care centers - Market size and forecast 2023-2028 ($ billion)
- Exhibits48: Chart on Hospice care centers - Year-over-year growth 2023-2028 (%)
- Exhibits49: Data Table on Hospice care centers - Year-over-year growth 2023-2028 (%)
- Exhibits50: Market opportunity by End-user ($ billion)
- Exhibits51: Data Table on Market opportunity by End-user ($ billion)
- Exhibits52: Chart on Type - Market share 2023-2028 (%)
- Exhibits53: Data Table on Type - Market share 2023-2028 (%)
- Exhibits54: Chart on Comparison by Type
- Exhibits55: Data Table on Comparison by Type
- Exhibits56: Chart on Nursing services - Market size and forecast 2023-2028 ($ billion)
- Exhibits57: Data Table on Nursing services - Market size and forecast 2023-2028 ($ billion)
- Exhibits58: Chart on Nursing services - Year-over-year growth 2023-2028 (%)
- Exhibits59: Data Table on Nursing services - Year-over-year growth 2023-2028 (%)
- Exhibits60: Chart on Medical supply services - Market size and forecast 2023-2028 ($ billion)
- Exhibits61: Data Table on Medical supply services - Market size and forecast 2023-2028 ($ billion)
- Exhibits62: Chart on Medical supply services - Year-over-year growth 2023-2028 (%)
- Exhibits63: Data Table on Medical supply services - Year-over-year growth 2023-2028 (%)
- Exhibits64: Chart on Physician services - Market size and forecast 2023-2028 ($ billion)
- Exhibits65: Data Table on Physician services - Market size and forecast 2023-2028 ($ billion)
- Exhibits66: Chart on Physician services - Year-over-year growth 2023-2028 (%)
- Exhibits67: Data Table on Physician services - Year-over-year growth 2023-2028 (%)
- Exhibits68: Chart on Other services - Market size and forecast 2023-2028 ($ billion)
- Exhibits69: Data Table on Other services - Market size and forecast 2023-2028 ($ billion)
- Exhibits70: Chart on Other services - Year-over-year growth 2023-2028 (%)
- Exhibits71: Data Table on Other services - Year-over-year growth 2023-2028 (%)
- Exhibits72: Market opportunity by Type ($ billion)
- Exhibits73: Data Table on Market opportunity by Type ($ billion)
- Exhibits74: Analysis of price sensitivity, lifecycle, customer purchase basket, adoption rates, and purchase criteria
- Exhibits75: Chart on Market share by geography 2023-2028 (%)
- Exhibits76: Data Table on Market share by geography 2023-2028 (%)
- Exhibits77: Chart on Geographic comparison
- Exhibits78: Data Table on Geographic comparison
- Exhibits79: Chart on North America - Market size and forecast 2023-2028 ($ billion)
- Exhibits80: Data Table on North America - Market size and forecast 2023-2028 ($ billion)
- Exhibits81: Chart on North America - Year-over-year growth 2023-2028 (%)
- Exhibits82: Data Table on North America - Year-over-year growth 2023-2028 (%)
- Exhibits83: Chart on Europe - Market size and forecast 2023-2028 ($ billion)
- Exhibits84: Data Table on Europe - Market size and forecast 2023-2028 ($ billion)
- Exhibits85: Chart on Europe - Year-over-year growth 2023-2028 (%)
- Exhibits86: Data Table on Europe - Year-over-year growth 2023-2028 (%)
- Exhibits87: Chart on APAC - Market size and forecast 2023-2028 ($ billion)
- Exhibits88: Data Table on APAC - Market size and forecast 2023-2028 ($ billion)
- Exhibits89: Chart on APAC - Year-over-year growth 2023-2028 (%)
- Exhibits90: Data Table on APAC - Year-over-year growth 2023-2028 (%)
- Exhibits91: Chart on Middle East and Africa - Market size and forecast 2023-2028 ($ billion)
- Exhibits92: Data Table on Middle East and Africa - Market size and forecast 2023-2028 ($ billion)
- Exhibits93: Chart on Middle East and Africa - Year-over-year growth 2023-2028 (%)
- Exhibits94: Data Table on Middle East and Africa - Year-over-year growth 2023-2028 (%)
- Exhibits95: Chart on South America - Market size and forecast 2023-2028 ($ billion)
- Exhibits96: Data Table on South America - Market size and forecast 2023-2028 ($ billion)
- Exhibits97: Chart on South America - Year-over-year growth 2023-2028 (%)
- Exhibits98: Data Table on South America - Year-over-year growth 2023-2028 (%)
- Exhibits99: Chart on US - Market size and forecast 2023-2028 ($ billion)
- Exhibits100: Data Table on US - Market size and forecast 2023-2028 ($ billion)
- Exhibits101: Chart on US - Year-over-year growth 2023-2028 (%)
- Exhibits102: Data Table on US - Year-over-year growth 2023-2028 (%)
- Exhibits103: Chart on UK - Market size and forecast 2023-2028 ($ billion)
- Exhibits104: Data Table on UK - Market size and forecast 2023-2028 ($ billion)
- Exhibits105: Chart on UK - Year-over-year growth 2023-2028 (%)
- Exhibits106: Data Table on UK - Year-over-year growth 2023-2028 (%)
- Exhibits107: Chart on Germany - Market size and forecast 2023-2028 ($ billion)
- Exhibits108: Data Table on Germany - Market size and forecast 2023-2028 ($ billion)
- Exhibits109: Chart on Germany - Year-over-year growth 2023-2028 (%)
- Exhibits110: Data Table on Germany - Year-over-year growth 2023-2028 (%)
- Exhibits111: Chart on Canada - Market size and forecast 2023-2028 ($ billion)
- Exhibits112: Data Table on Canada - Market size and forecast 2023-2028 ($ billion)
- Exhibits113: Chart on Canada - Year-over-year growth 2023-2028 (%)
- Exhibits114: Data Table on Canada - Year-over-year growth 2023-2028 (%)
- Exhibits115: Chart on China - Market size and forecast 2023-2028 ($ billion)
- Exhibits116: Data Table on China - Market size and forecast 2023-2028 ($ billion)
- Exhibits117: Chart on China - Year-over-year growth 2023-2028 (%)
- Exhibits118: Data Table on China - Year-over-year growth 2023-2028 (%)
- Exhibits119: Market opportunity by geography ($ billion)
- Exhibits120: Data Tables on Market opportunity by geography ($ billion)
- Exhibits121: Impact of drivers and challenges in 2023 and 2028
- Exhibits122: Overview on Criticality of inputs and Factors of differentiation
- Exhibits123: Overview on factors of disruption
- Exhibits124: Impact of key risks on business
- Exhibits125: Vendors covered
- Exhibits126: Matrix on vendor position and classification
- Exhibits127: AccentCare Inc. - Overview
- Exhibits128: AccentCare Inc. - Product / Service
- Exhibits129: AccentCare Inc. - Key offerings
- Exhibits130: Amedisys Inc. - Overview
- Exhibits131: Amedisys Inc. - Business segments
- Exhibits132: Amedisys Inc. - Key offerings
- Exhibits133: Amedisys Inc. - Segment focus
- Exhibits134: BRISTOL HOSPICE LLC - Overview
- Exhibits135: BRISTOL HOSPICE LLC - Product / Service
- Exhibits136: BRISTOL HOSPICE LLC - Key offerings
- Exhibits137: Brookdale Senior Living Inc. - Overview
- Exhibits138: Brookdale Senior Living Inc. - Business segments
- Exhibits139: Brookdale Senior Living Inc. - Key news
- Exhibits140: Brookdale Senior Living Inc. - Key offerings
- Exhibits141: Brookdale Senior Living Inc. - Segment focus
- Exhibits142: Caring Hospice Services - Overview
- Exhibits143: Caring Hospice Services - Product / Service
- Exhibits144: Caring Hospice Services - Key offerings
- Exhibits145: Chemed Corp. - Overview
- Exhibits146: Chemed Corp. - Business segments
- Exhibits147: Chemed Corp. - Key offerings
- Exhibits148: Chemed Corp. - Segment focus
- Exhibits149: Compassus - Overview
- Exhibits150: Compassus - Product / Service
- Exhibits151: Compassus - Key offerings
- Exhibits152: Covenant Care - Overview
- Exhibits153: Covenant Care - Product / Service
- Exhibits154: Covenant Care - Key offerings
- Exhibits155: Crossroads Hospice - Overview
- Exhibits156: Crossroads Hospice - Product / Service
- Exhibits157: Crossroads Hospice - Key offerings
- Exhibits158: Four Seasons - Overview
- Exhibits159: Four Seasons - Product / Service
- Exhibits160: Four Seasons - Key offerings
- Exhibits161: Hospice of the Valley - Overview
- Exhibits162: Hospice of the Valley - Product / Service
- Exhibits163: Hospice of the Valley - Key offerings
- Exhibits164: LifePoint Health Inc. - Overview
- Exhibits165: LifePoint Health Inc. - Product / Service
- Exhibits166: LifePoint Health Inc. - Key offerings
- Exhibits167: Providence - Overview
- Exhibits168: Providence - Product / Service
- Exhibits169: Providence - Key offerings
- Exhibits170: Seasons Hospice - Overview
- Exhibits171: Seasons Hospice - Product / Service
- Exhibits172: Seasons Hospice - Key offerings
- Exhibits173: UnitedHealth Group Inc. - Overview
- Exhibits174: UnitedHealth Group Inc. - Business segments
- Exhibits175: UnitedHealth Group Inc. - Key offerings
- Exhibits176: UnitedHealth Group Inc. - Segment focus
- Exhibits177: Inclusions checklist
- Exhibits178: Exclusions checklist
- Exhibits179: Currency conversion rates for US$
- Exhibits180: Research methodology
- Exhibits181: Validation techniques employed for market sizing
- Exhibits182: Information sources
- Exhibits183: List of abbreviations
Technavio has been monitoring the hospice market and is forecast to grow by USD 111.1 bn during 2023-2028, accelerating at a CAGR of 4.88% during the forecast period. Our report on the hospice market provides a holistic analysis, market size and forecast, trends, growth drivers, and challenges, as well as vendor analysis covering around 25 vendors.
The report offers an up-to-date analysis regarding the current market scenario, the latest trends and drivers, and the overall market environment. The market is driven by increasing geriatric population, increase in healthcare budgets by governments, and growing demand to prevent infections and ensure patient safety.
Technavio's hospice market is segmented as below:
| Market Scope | |
|---|---|
| Base Year | 2024 |
| End Year | 2028 |
| Series Year | 2024-2028 |
| Growth Momentum | Accelerate |
| YOY 2024 | 3.86% |
| CAGR | 4.88% |
| Incremental Value | $111.1bn |
By End-user
- Home settings
- Hospitals
- Specialty nursing homes
- Hospice care centers
By Type
- Nursing services
- Medical supply services
- Physician services
- Other services
By Geography
- North America
- Europe
- APAC
- Middle East and Africa
- South America
This study identifies the increasing emphasis on person-centered care in hospice settings as one of the prime reasons driving the hospice market growth during the next few years. Also, expansion and growth of several healthcare domains and technological advancements in hospice sector will lead to sizable demand in the market.
Technavio presents a detailed picture of the market by the way of study, synthesis, and summation of data from multiple sources by an analysis of key parameters. Our report on the hospice market covers the following areas:
- Hospice market sizing
- Hospice market forecast
- Hospice market industry analysis
Technavio's robust vendor analysis is designed to help clients improve their market position, and in line with this, this report provides a detailed analysis of several leading hospice market vendors that include Abode Hospice and Home Health, AccentCare Inc., Amedisys Inc., BRISTOL HOSPICE LLC, Brookdale Senior Living Inc., Caring Hospice Services, Chemed Corp., Compassus, Covenant Care, Crossroads Hospice, Four Seasons, Hospice of the Valley, Liberty HomeCare and Hospice Services , LifePoint Health Inc., PeaceHealth, Providence, Seasons Hospice, Silverado, Suncrest Hospice, and UnitedHealth Group Inc.. Also, the hospice market analysis report includes information on upcoming trends and challenges that will influence market growth. This is to help companies strategize and leverage all forthcoming growth opportunities.
The study was conducted using an objective combination of primary and secondary information including inputs from key participants in the industry. The report contains a comprehensive market and vendor landscape in addition to an analysis of the key vendors.
Technavio presents a detailed picture of the market by the way of study, synthesis, and summation of data from multiple sources by an analysis of key parameters such as profit, pricing, competition, and promotions. It presents various market facets by identifying the key industry influencers. The data presented is comprehensive, reliable, and a result of extensive research - both primary and secondary. Technavio's market research reports provide a complete competitive landscape and an in-depth vendor selection methodology and analysis using qualitative and quantitative research to forecast accurate market growth.
Table of Contents
1 Executive Summary
- 1.1 Market overview
2 Market Landscape
- 2.1 Market ecosystem
3 Market Sizing
- 3.1 Market definition
- 3.2 Market segment analysis
- 3.3 Market size 2023
- 3.4 Market outlook: Forecast for 2023-2028
4 Historic Market Size
- 4.1 Global hospice market 2018 - 2022
- 4.2 End-user Segment Analysis 2018 - 2022
- 4.3 Type Segment Analysis 2018 - 2022
- 4.4 Geography Segment Analysis 2018 - 2022
- 4.5 Country Segment Analysis 2018 - 2022
5 Five Forces Analysis
- 5.1 Five forces summary
- 5.2 Bargaining power of buyers
- 5.3 Bargaining power of suppliers
- 5.4 Threat of new entrants
- 5.5 Threat of substitutes
- 5.6 Threat of rivalry
- 5.7 Market condition
6 Market Segmentation by End-user
- 6.1 Market segments
- 6.2 Comparison by End-user
- 6.3 Home settings - Market size and forecast 2023-2028
- 6.4 Hospitals - Market size and forecast 2023-2028
- 6.5 Specialty nursing homes - Market size and forecast 2023-2028
- 6.6 Hospice care centers - Market size and forecast 2023-2028
- 6.7 Market opportunity by End-user
7 Market Segmentation by Type
- 7.1 Market segments
- 7.2 Comparison by Type
- 7.3 Nursing services - Market size and forecast 2023-2028
- 7.4 Medical supply services - Market size and forecast 2023-2028
- 7.5 Physician services - Market size and forecast 2023-2028
- 7.6 Other services - Market size and forecast 2023-2028
- 7.7 Market opportunity by Type
8 Customer Landscape
- 8.1 Customer landscape overview
9 Geographic Landscape
- 9.1 Geographic segmentation
- 9.2 Geographic comparison
- 9.3 North America - Market size and forecast 2023-2028
- 9.4 Europe - Market size and forecast 2023-2028
- 9.5 APAC - Market size and forecast 2023-2028
- 9.6 Middle East and Africa - Market size and forecast 2023-2028
- 9.7 South America - Market size and forecast 2023-2028
- 9.8 US - Market size and forecast 2023-2028
- 9.9 UK - Market size and forecast 2023-2028
- 9.10 Germany - Market size and forecast 2023-2028
- 9.11 Canada - Market size and forecast 2023-2028
- 9.12 China - Market size and forecast 2023-2028
- 9.13 Market opportunity by geography
10 Drivers, Challenges, and Trends
- 10.1 Market drivers
- 10.2 Market challenges
- 10.3 Impact of drivers and challenges
- 10.4 Market trends
11 Vendor Landscape
- 11.1 Overview
- 11.2 Vendor landscape
- 11.3 Landscape disruption
- 11.4 Industry risks
12 Vendor Analysis
- 12.1 Vendors covered
- 12.2 Market positioning of vendors
- 12.3 AccentCare Inc.
- 12.4 Amedisys Inc.
- 12.5 BRISTOL HOSPICE LLC
- 12.6 Brookdale Senior Living Inc.
- 12.7 Caring Hospice Services
- 12.8 Chemed Corp.
- 12.9 Compassus
- 12.10 Covenant Care
- 12.11 Crossroads Hospice
- 12.12 Four Seasons
- 12.13 Hospice of the Valley
- 12.14 LifePoint Health Inc.
- 12.15 Providence
- 12.16 Seasons Hospice
- 12.17 UnitedHealth Group Inc.
13 Appendix
- 13.1 Scope of the report
- 13.2 Inclusions and exclusions checklist
- 13.3 Currency conversion rates for US$
- 13.4 Research methodology
- 13.5 List of abbreviations

