|
|
市場調査レポート
商品コード
1502518
フェイスシールドの世界市場 2024-2028Global face shield market 2024-2028 |
||||||
|
|||||||
カスタマイズ可能
|
|||||||


| フェイスシールドの世界市場 2024-2028 |
|
出版日: 2024年05月20日
発行: TechNavio
ページ情報: 英文 170 Pages
納期: 即納可能
|

全表示
- 概要
- 図表
- 目次
Technavio社は、フェイスシールド市場を調査し、2023年から2028年にかけて11億6,710万米ドル、予測期間中のCAGRは9.84%で成長すると予測しています。
当レポートでは、フェイスシールド市場の全体的な分析、市場規模・予測、動向、成長促進要因、課題、約25のベンダーを網羅したベンダー分析などを掲載しています。
現在の市場シナリオ、最新動向と促進要因、市場環境全体に関する最新分析を提供しています。市場は、伝染病や感染症の発生の増加、厳しい規制の枠組み、労働者の健康と安全を維持するためのさまざまなエンドユーザー産業での採用の増加によって牽引されています。
| 市場範囲 | |
|---|---|
| 基準年 | 2024 |
| 終了年 | 2028 |
| 予測期間 | 2024-2028 |
| 成長モメンタム | 加速 |
| 前年比2024年 | 8.73% |
| CAGR | 9.84% |
| 増分額 | 11億6,710万米ドル |
本調査では、今後数年間のフェイスシールド市場成長を牽引する主な要因の1つとして、フェイスシールドの機能性向上に対する需要の高まりを挙げています。また、フェイスシールドベンダーによるeコマースの利用や、持続可能で環境に優しいフェイスシールド素材への注目が高まっていることも、市場の大きな需要につながると思われます。
目次
第1章 エグゼクティブサマリー
- 市場概要
第2章 市場情勢
- 市場エコシステム
- 市場の特徴
- バリューチェーン分析
第3章 市場規模の評価
- 市場の定義
- 市場セグメント分析
- 市場規模 2023
- 市場の見通し 2023-2028
第4章 市場規模実績
- 世界フェイスシールド市場 2018-2022
- エンドユーザー別セグメント分析 2018-2022
- タイプ別セグメント分析 2018-2022
- 地域別セグメント分析 2018-2022
- 国別セグメント分析 2018-2022
第5章 ファイブフォース分析
- ファイブフォースの要約
- 買い手の交渉力
- 供給企業の交渉力
- 新規参入業者の脅威
- 代替品の脅威
- 競争の脅威
- 市況
第6章 市場セグメンテーション:エンドユーザー別
- 市場セグメンテーション
- 比較:エンドユーザー別
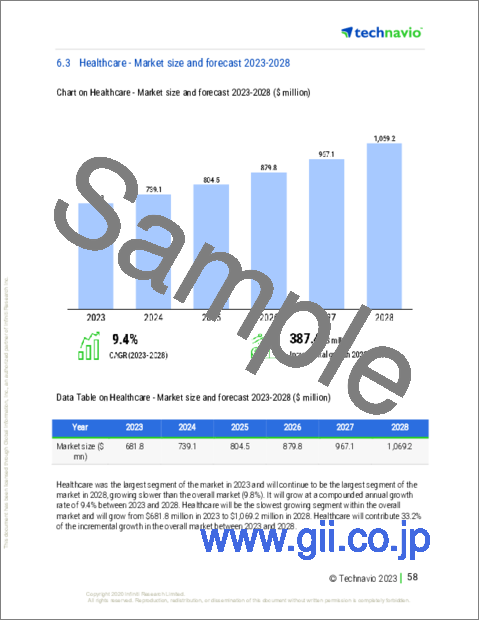
- ヘルスケア:市場規模と予測 2023-2028
- 工業製造業:市場規模と予測 2023-2028
- 建設現場:市場規模と予測 2023-2028
- その他:市場規模と予測 2023-2028
- 市場機会:エンドユーザー別
第7章 市場セグメンテーション:タイプ別
- 市場セグメンテーション
- 比較:タイプ別
- フルフェイスシールド:市場規模と予測 2023-2028
- ハーフフェイスシールド:市場規模と予測 2023-2028
- 市場機会:タイプ別
第8章 顧客情勢
- 顧客情勢の概要
第9章 地域別情勢
- 地域別セグメンテーション
- 地域別比較
- 北米:市場規模と予測 2023-2028
- 欧州:市場規模と予測 2023-2028
- アジア太平洋:市場規模と予測 2023-2028
- 中東・アフリカ:市場規模と予測 2023-2028
- 南米:市場規模と予測 2023-2028
- 米国:市場規模と予測 2023-2028
- 中国:市場規模と予測 2023-2028
- ドイツ:市場規模と予測 2023-2028
- 日本:市場規模と予測 2023-2028
- 英国:市場規模と予測 2023-2028
- 市場機会:地域情勢別
第10章 促進要因・課題・機会・抑制要因
- 市場促進要因
- 市場の課題
- 促進要因と課題の影響
- 市場の機会・抑制要因
第11章 競合情勢
- 概要
- 競合情勢
- 混乱の状況
- 業界のリスク
第12章 競合分析
- 企業プロファイル
- 企業の市場ポジショニング
- Alpha Pro Tech Ltd.
- Bei BeI Safety Co. Ltd.
- CIGWELD Pty Ltd.
- Dou Yee Enterprises S Pte Ltd.
- Honeywell International Inc.
- JSP Ltd.
- Merck KGaA
- MSA Safety Inc.
- PETZL Distribution
- Productos Climax SA
- PROTECT Laserschutz GmbH
- Radians Inc.
- STERIS plc
- Univet Srl
第13章 付録
Exhibits:
- Exhibits1: Executive Summary - Chart on Market Overview
- Exhibits2: Executive Summary - Data Table on Market Overview
- Exhibits3: Executive Summary - Chart on Global Market Characteristics
- Exhibits4: Executive Summary - Chart on Market By Geographical Landscape
- Exhibits5: Executive Summary - Chart on Market Segmentation by End-user
- Exhibits6: Executive Summary - Chart on Market Segmentation by Type
- Exhibits7: Executive Summary - Chart on Incremental Growth
- Exhibits8: Executive Summary - Data Table on Incremental Growth
- Exhibits9: Executive Summary - Chart on Company Market Positioning
- Exhibits10: Parent Market
- Exhibits11: Data Table on - Parent Market
- Exhibits12: Market characteristics analysis
- Exhibits13: Value Chain Analysis
- Exhibits14: Offerings of companies included in the market definition
- Exhibits15: Market segments
- Exhibits16: Chart on Global - Market size and forecast 2023-2028 ($ million)
- Exhibits17: Data Table on Global - Market size and forecast 2023-2028 ($ million)
- Exhibits18: Chart on Global Market: Year-over-year growth 2023-2028 (%)
- Exhibits19: Data Table on Global Market: Year-over-year growth 2023-2028 (%)
- Exhibits20: Historic Market Size - Data Table on Global Face Shield Market 2018 - 2022 ($ million)
- Exhibits21: Historic Market Size - End-user Segment 2018 - 2022 ($ million)
- Exhibits22: Historic Market Size - Type Segment 2018 - 2022 ($ million)
- Exhibits23: Historic Market Size - Geography Segment 2018 - 2022 ($ million)
- Exhibits24: Historic Market Size - Country Segment 2018 - 2022 ($ million)
- Exhibits25: Five forces analysis - Comparison between 2023 and 2028
- Exhibits26: Bargaining power of buyers - Impact of key factors 2023 and 2028
- Exhibits27: Bargaining power of suppliers - Impact of key factors in 2023 and 2028
- Exhibits28: Threat of new entrants - Impact of key factors in 2023 and 2028
- Exhibits29: Threat of substitutes - Impact of key factors in 2023 and 2028
- Exhibits30: Threat of rivalry - Impact of key factors in 2023 and 2028
- Exhibits31: Chart on Market condition - Five forces 2023 and 2028
- Exhibits32: Chart on End-user - Market share 2023-2028 (%)
- Exhibits33: Data Table on End-user - Market share 2023-2028 (%)
- Exhibits34: Chart on Comparison by End-user
- Exhibits35: Data Table on Comparison by End-user
- Exhibits36: Chart on Healthcare - Market size and forecast 2023-2028 ($ million)
- Exhibits37: Data Table on Healthcare - Market size and forecast 2023-2028 ($ million)
- Exhibits38: Chart on Healthcare - Year-over-year growth 2023-2028 (%)
- Exhibits39: Data Table on Healthcare - Year-over-year growth 2023-2028 (%)
- Exhibits40: Chart on Industrial manufacturing - Market size and forecast 2023-2028 ($ million)
- Exhibits41: Data Table on Industrial manufacturing - Market size and forecast 2023-2028 ($ million)
- Exhibits42: Chart on Industrial manufacturing - Year-over-year growth 2023-2028 (%)
- Exhibits43: Data Table on Industrial manufacturing - Year-over-year growth 2023-2028 (%)
- Exhibits44: Chart on Construction - Market size and forecast 2023-2028 ($ million)
- Exhibits45: Data Table on Construction - Market size and forecast 2023-2028 ($ million)
- Exhibits46: Chart on Construction - Year-over-year growth 2023-2028 (%)
- Exhibits47: Data Table on Construction - Year-over-year growth 2023-2028 (%)
- Exhibits48: Chart on Others - Market size and forecast 2023-2028 ($ million)
- Exhibits49: Data Table on Others - Market size and forecast 2023-2028 ($ million)
- Exhibits50: Chart on Others - Year-over-year growth 2023-2028 (%)
- Exhibits51: Data Table on Others - Year-over-year growth 2023-2028 (%)
- Exhibits52: Market opportunity by End-user ($ million)
- Exhibits53: Data Table on Market opportunity by End-user ($ million)
- Exhibits54: Chart on Type - Market share 2023-2028 (%)
- Exhibits55: Data Table on Type - Market share 2023-2028 (%)
- Exhibits56: Chart on Comparison by Type
- Exhibits57: Data Table on Comparison by Type
- Exhibits58: Chart on Full-face shield - Market size and forecast 2023-2028 ($ million)
- Exhibits59: Data Table on Full-face shield - Market size and forecast 2023-2028 ($ million)
- Exhibits60: Chart on Full-face shield - Year-over-year growth 2023-2028 (%)
- Exhibits61: Data Table on Full-face shield - Year-over-year growth 2023-2028 (%)
- Exhibits62: Chart on Half-face shield - Market size and forecast 2023-2028 ($ million)
- Exhibits63: Data Table on Half-face shield - Market size and forecast 2023-2028 ($ million)
- Exhibits64: Chart on Half-face shield - Year-over-year growth 2023-2028 (%)
- Exhibits65: Data Table on Half-face shield - Year-over-year growth 2023-2028 (%)
- Exhibits66: Market opportunity by Type ($ million)
- Exhibits67: Data Table on Market opportunity by Type ($ million)
- Exhibits68: Analysis of price sensitivity, lifecycle, customer purchase basket, adoption rates, and purchase criteria
- Exhibits69: Chart on Market share By Geographical Landscape 2023-2028 (%)
- Exhibits70: Data Table on Market share By Geographical Landscape 2023-2028 (%)
- Exhibits71: Chart on Geographic comparison
- Exhibits72: Data Table on Geographic comparison
- Exhibits73: Chart on North America - Market size and forecast 2023-2028 ($ million)
- Exhibits74: Data Table on North America - Market size and forecast 2023-2028 ($ million)
- Exhibits75: Chart on North America - Year-over-year growth 2023-2028 (%)
- Exhibits76: Data Table on North America - Year-over-year growth 2023-2028 (%)
- Exhibits77: Chart on Europe - Market size and forecast 2023-2028 ($ million)
- Exhibits78: Data Table on Europe - Market size and forecast 2023-2028 ($ million)
- Exhibits79: Chart on Europe - Year-over-year growth 2023-2028 (%)
- Exhibits80: Data Table on Europe - Year-over-year growth 2023-2028 (%)
- Exhibits81: Chart on APAC - Market size and forecast 2023-2028 ($ million)
- Exhibits82: Data Table on APAC - Market size and forecast 2023-2028 ($ million)
- Exhibits83: Chart on APAC - Year-over-year growth 2023-2028 (%)
- Exhibits84: Data Table on APAC - Year-over-year growth 2023-2028 (%)
- Exhibits85: Chart on Middle East and Africa - Market size and forecast 2023-2028 ($ million)
- Exhibits86: Data Table on Middle East and Africa - Market size and forecast 2023-2028 ($ million)
- Exhibits87: Chart on Middle East and Africa - Year-over-year growth 2023-2028 (%)
- Exhibits88: Data Table on Middle East and Africa - Year-over-year growth 2023-2028 (%)
- Exhibits89: Chart on South America - Market size and forecast 2023-2028 ($ million)
- Exhibits90: Data Table on South America - Market size and forecast 2023-2028 ($ million)
- Exhibits91: Chart on South America - Year-over-year growth 2023-2028 (%)
- Exhibits92: Data Table on South America - Year-over-year growth 2023-2028 (%)
- Exhibits93: Chart on US - Market size and forecast 2023-2028 ($ million)
- Exhibits94: Data Table on US - Market size and forecast 2023-2028 ($ million)
- Exhibits95: Chart on US - Year-over-year growth 2023-2028 (%)
- Exhibits96: Data Table on US - Year-over-year growth 2023-2028 (%)
- Exhibits97: Chart on China - Market size and forecast 2023-2028 ($ million)
- Exhibits98: Data Table on China - Market size and forecast 2023-2028 ($ million)
- Exhibits99: Chart on China - Year-over-year growth 2023-2028 (%)
- Exhibits100: Data Table on China - Year-over-year growth 2023-2028 (%)
- Exhibits101: Chart on Germany - Market size and forecast 2023-2028 ($ million)
- Exhibits102: Data Table on Germany - Market size and forecast 2023-2028 ($ million)
- Exhibits103: Chart on Germany - Year-over-year growth 2023-2028 (%)
- Exhibits104: Data Table on Germany - Year-over-year growth 2023-2028 (%)
- Exhibits105: Chart on Japan - Market size and forecast 2023-2028 ($ million)
- Exhibits106: Data Table on Japan - Market size and forecast 2023-2028 ($ million)
- Exhibits107: Chart on Japan - Year-over-year growth 2023-2028 (%)
- Exhibits108: Data Table on Japan - Year-over-year growth 2023-2028 (%)
- Exhibits109: Chart on UK - Market size and forecast 2023-2028 ($ million)
- Exhibits110: Data Table on UK - Market size and forecast 2023-2028 ($ million)
- Exhibits111: Chart on UK - Year-over-year growth 2023-2028 (%)
- Exhibits112: Data Table on UK - Year-over-year growth 2023-2028 (%)
- Exhibits113: Market opportunity By Geographical Landscape ($ million)
- Exhibits114: Data Tables on Market opportunity By Geographical Landscape ($ million)
- Exhibits115: Impact of drivers and challenges in 2023 and 2028
- Exhibits116: Overview on criticality of inputs and factors of differentiation
- Exhibits117: Overview on factors of disruption
- Exhibits118: Impact of key risks on business
- Exhibits119: Companies covered
- Exhibits120: Matrix on companies position and classification
- Exhibits121: 3M Co. - Overview
- Exhibits122: 3M Co. - Business segments
- Exhibits123: 3M Co. - Key news
- Exhibits124: 3M Co. - Key offerings
- Exhibits125: 3M Co. - Segment focus
- Exhibits126: Alpha Pro Tech Ltd. - Overview
- Exhibits127: Alpha Pro Tech Ltd. - Business segments
- Exhibits128: Alpha Pro Tech Ltd. - Key offerings
- Exhibits129: Alpha Pro Tech Ltd. - Segment focus
- Exhibits130: Bei BeI Safety Co. Ltd. - Overview
- Exhibits131: Bei BeI Safety Co. Ltd. - Product / Service
- Exhibits132: Bei BeI Safety Co. Ltd. - Key offerings
- Exhibits133: CIGWELD Pty Ltd. - Overview
- Exhibits134: CIGWELD Pty Ltd. - Product / Service
- Exhibits135: CIGWELD Pty Ltd. - Key offerings
- Exhibits136: Dou Yee Enterprises S Pte Ltd. - Overview
- Exhibits137: Dou Yee Enterprises S Pte Ltd. - Product / Service
- Exhibits138: Dou Yee Enterprises S Pte Ltd. - Key offerings
- Exhibits139: Honeywell International Inc. - Overview
- Exhibits140: Honeywell International Inc. - Business segments
- Exhibits141: Honeywell International Inc. - Key news
- Exhibits142: Honeywell International Inc. - Key offerings
- Exhibits143: Honeywell International Inc. - Segment focus
- Exhibits144: JSP Ltd. - Overview
- Exhibits145: JSP Ltd. - Product / Service
- Exhibits146: JSP Ltd. - Key offerings
- Exhibits147: Merck KGaA - Overview
- Exhibits148: Merck KGaA - Business segments
- Exhibits149: Merck KGaA - Key news
- Exhibits150: Merck KGaA - Key offerings
- Exhibits151: Merck KGaA - Segment focus
- Exhibits152: MSA Safety Inc. - Overview
- Exhibits153: MSA Safety Inc. - Business segments
- Exhibits154: MSA Safety Inc. - Key news
- Exhibits155: MSA Safety Inc. - Key offerings
- Exhibits156: MSA Safety Inc. - Segment focus
- Exhibits157: PETZL Distribution - Overview
- Exhibits158: PETZL Distribution - Product / Service
- Exhibits159: PETZL Distribution - Key offerings
- Exhibits160: Productos Climax SA - Overview
- Exhibits161: Productos Climax SA - Product / Service
- Exhibits162: Productos Climax SA - Key offerings
- Exhibits163: PROTECT Laserschutz GmbH - Overview
- Exhibits164: PROTECT Laserschutz GmbH - Product / Service
- Exhibits165: PROTECT Laserschutz GmbH - Key offerings
- Exhibits166: Radians Inc. - Overview
- Exhibits167: Radians Inc. - Product / Service
- Exhibits168: Radians Inc. - Key offerings
- Exhibits169: STERIS plc - Overview
- Exhibits170: STERIS plc - Business segments
- Exhibits171: STERIS plc - Key offerings
- Exhibits172: STERIS plc - Segment focus
- Exhibits173: Univet Srl - Overview
- Exhibits174: Univet Srl - Product / Service
- Exhibits175: Univet Srl - Key offerings
- Exhibits176: Inclusions checklist
- Exhibits177: Exclusions checklist
- Exhibits178: Currency conversion rates for US$
- Exhibits179: Research methodology
- Exhibits180: Information sources
- Exhibits181: Data validation
- Exhibits182: Validation techniques employed for market sizing
- Exhibits183: Data synthesis
- Exhibits184: 360 degree market analysis
- Exhibits185: List of abbreviations
Technavio has been monitoring the face shield market and is forecast to grow by USD 1167.1 mn during 2023-2028, accelerating at a CAGR of 9.84% during the forecast period. Our report on the face shield market provides a holistic analysis, market size and forecast, trends, growth drivers, and challenges, as well as vendor analysis covering around 25 vendors.
The report offers an up-to-date analysis regarding the current market scenario, the latest trends and drivers, and the overall market environment. The market is driven by growing occurrence of contagious and infectious diseases, stringent regulatory framework, and growing adoption among different end-user industries to maintain worker health and safety.
Technavio's face shield market is segmented as below:
| Market Scope | |
|---|---|
| Base Year | 2024 |
| End Year | 2028 |
| Series Year | 2024-2028 |
| Growth Momentum | Accelerate |
| YOY 2024 | 8.73% |
| CAGR | 9.84% |
| Incremental Value | $1167.1mn |
By End-user
- Healthcare
- Industrial manufacturing
- Construction
- Others
By Type
- Full-face shield
- Half-face shield
By Geographical Landscape
- North America
- Europe
- APAC
- Middle East and Africa
- South America
This study identifies the growing demand for greater functionality and features in face shields as one of the prime reasons driving the face shield market growth during the next few years. Also, use of e-commerce by face shield vendors and growing emphasis on sustainable and eco-friendly face shield materials will lead to sizable demand in the market.
Technavio presents a detailed picture of the market by the way of study, synthesis, and summation of data from multiple sources by an analysis of key parameters. Our report on the face shield market covers the following areas:
- Face shield market sizing
- Face shield market forecast
- Face shield market industry analysis
Technavio's robust vendor analysis is designed to help clients improve their market position, and in line with this, this report provides a detailed analysis of several leading face shield market vendors that include 3M Co., Alpha Pro Tech Ltd., Bei BeI Safety Co. Ltd., Bunzl Plc, CIGWELD Pty Ltd., Dou Yee Enterprises S Pte Ltd., Ho Cheng Safety Enterprise Co. Ltd., Hobart Welding Products, Honeywell International Inc., JSP Ltd., Lakeland Industries Inc., Merck KGaA, MSA Safety Inc., PETZL Distribution, Productos Climax SA, PROTECT Laserschutz GmbH, Pyramex Safety, Radians Inc., STERIS plc, and Univet Srl. Also, the face shield market analysis report includes information on upcoming trends and challenges that will influence market growth. This is to help companies strategize and leverage all forthcoming growth opportunities.
The study was conducted using an objective combination of primary and secondary information including inputs from key participants in the industry. The report contains a comprehensive market and vendor landscape in addition to an analysis of the key vendors.
Technavio presents a detailed picture of the market by the way of study, synthesis, and summation of data from multiple sources by an analysis of key parameters such as profit, pricing, competition, and promotions. It presents various market facets by identifying the key industry influencers. The data presented is comprehensive, reliable, and a result of extensive research - both primary and secondary. Technavio's market research reports provide a complete competitive landscape and an in-depth vendor selection methodology and analysis using qualitative and quantitative research to forecast accurate market growth.
Table of Contents
1 Executive Summary
- 1.1 Market overview
- Executive Summary - Chart on Market Overview
- Executive Summary - Data Table on Market Overview
- Executive Summary - Chart on Global Market Characteristics
- Executive Summary - Chart on Market By Geographical Landscape
- Executive Summary - Chart on Market Segmentation by End-user
- Executive Summary - Chart on Market Segmentation by Type
- Executive Summary - Chart on Incremental Growth
- Executive Summary - Data Table on Incremental Growth
- Executive Summary - Chart on Company Market Positioning
2 Market Landscape
- 2.1 Market ecosystem
- Parent Market
- Data Table on - Parent Market
- 2.2 Market characteristics
- Market characteristics analysis
- 2.3 Value chain analysis
- Value Chain Analysis
3 Market Sizing
- 3.1 Market definition
- Offerings of companies included in the market definition
- 3.2 Market segment analysis
- Market segments
- 3.3 Market size 2023
- 3.4 Market outlook: Forecast for 2023-2028
- Chart on Global - Market size and forecast 2023-2028 ($ million)
- Data Table on Global - Market size and forecast 2023-2028 ($ million)
- Chart on Global Market: Year-over-year growth 2023-2028 (%)
- Data Table on Global Market: Year-over-year growth 2023-2028 (%)
4 Historic Market Size
- 4.1 Global Face Shield Market 2018 - 2022
- Historic Market Size - Data Table on Global Face Shield Market 2018 - 2022 ($ million)
- 4.2 End-user segment analysis 2018 - 2022
- Historic Market Size - End-user Segment 2018 - 2022 ($ million)
- 4.3 Type segment analysis 2018 - 2022
- Historic Market Size - Type Segment 2018 - 2022 ($ million)
- 4.4 Geography segment analysis 2018 - 2022
- Historic Market Size - Geography Segment 2018 - 2022 ($ million)
- 4.5 Country segment analysis 2018 - 2022
- Historic Market Size - Country Segment 2018 - 2022 ($ million)
5 Five Forces Analysis
- 5.1 Five forces summary
- Five forces analysis - Comparison between 2023 and 2028
- 5.2 Bargaining power of buyers
- Bargaining power of buyers - Impact of key factors 2023 and 2028
- 5.3 Bargaining power of suppliers
- Bargaining power of suppliers - Impact of key factors in 2023 and 2028
- 5.4 Threat of new entrants
- Threat of new entrants - Impact of key factors in 2023 and 2028
- 5.5 Threat of substitutes
- Threat of substitutes - Impact of key factors in 2023 and 2028
- 5.6 Threat of rivalry
- Threat of rivalry - Impact of key factors in 2023 and 2028
- 5.7 Market condition
- Chart on Market condition - Five forces 2023 and 2028
6 Market Segmentation by End-user
- 6.1 Market segments
- Chart on End-user - Market share 2023-2028 (%)
- Data Table on End-user - Market share 2023-2028 (%)
- 6.2 Comparison by End-user
- Chart on Comparison by End-user
- Data Table on Comparison by End-user
- 6.3 Healthcare - Market size and forecast 2023-2028
- Chart on Healthcare - Market size and forecast 2023-2028 ($ million)
- Data Table on Healthcare - Market size and forecast 2023-2028 ($ million)
- Chart on Healthcare - Year-over-year growth 2023-2028 (%)
- Data Table on Healthcare - Year-over-year growth 2023-2028 (%)
- 6.4 Industrial manufacturing - Market size and forecast 2023-2028
- Chart on Industrial manufacturing - Market size and forecast 2023-2028 ($ million)
- Data Table on Industrial manufacturing - Market size and forecast 2023-2028 ($ million)
- Chart on Industrial manufacturing - Year-over-year growth 2023-2028 (%)
- Data Table on Industrial manufacturing - Year-over-year growth 2023-2028 (%)
- 6.5 Construction - Market size and forecast 2023-2028
- Chart on Construction - Market size and forecast 2023-2028 ($ million)
- Data Table on Construction - Market size and forecast 2023-2028 ($ million)
- Chart on Construction - Year-over-year growth 2023-2028 (%)
- Data Table on Construction - Year-over-year growth 2023-2028 (%)
- 6.6 Others - Market size and forecast 2023-2028
- Chart on Others - Market size and forecast 2023-2028 ($ million)
- Data Table on Others - Market size and forecast 2023-2028 ($ million)
- Chart on Others - Year-over-year growth 2023-2028 (%)
- Data Table on Others - Year-over-year growth 2023-2028 (%)
- 6.7 Market opportunity by End-user
- Market opportunity by End-user ($ million)
- Data Table on Market opportunity by End-user ($ million)
7 Market Segmentation by Type
- 7.1 Market segments
- Chart on Type - Market share 2023-2028 (%)
- Data Table on Type - Market share 2023-2028 (%)
- 7.2 Comparison by Type
- Chart on Comparison by Type
- Data Table on Comparison by Type
- 7.3 Full-face shield - Market size and forecast 2023-2028
- Chart on Full-face shield - Market size and forecast 2023-2028 ($ million)
- Data Table on Full-face shield - Market size and forecast 2023-2028 ($ million)
- Chart on Full-face shield - Year-over-year growth 2023-2028 (%)
- Data Table on Full-face shield - Year-over-year growth 2023-2028 (%)
- 7.4 Half-face shield - Market size and forecast 2023-2028
- Chart on Half-face shield - Market size and forecast 2023-2028 ($ million)
- Data Table on Half-face shield - Market size and forecast 2023-2028 ($ million)
- Chart on Half-face shield - Year-over-year growth 2023-2028 (%)
- Data Table on Half-face shield - Year-over-year growth 2023-2028 (%)
- 7.5 Market opportunity by Type
- Market opportunity by Type ($ million)
- Data Table on Market opportunity by Type ($ million)
8 Customer Landscape
- 8.1 Customer landscape overview
- Analysis of price sensitivity, lifecycle, customer purchase basket, adoption rates, and purchase criteria
9 Geographic Landscape
- 9.1 Geographic segmentation
- Chart on Market share By Geographical Landscape 2023-2028 (%)
- Data Table on Market share By Geographical Landscape 2023-2028 (%)
- 9.2 Geographic comparison
- Chart on Geographic comparison
- Data Table on Geographic comparison
- 9.3 North America - Market size and forecast 2023-2028
- Chart on North America - Market size and forecast 2023-2028 ($ million)
- Data Table on North America - Market size and forecast 2023-2028 ($ million)
- Chart on North America - Year-over-year growth 2023-2028 (%)
- Data Table on North America - Year-over-year growth 2023-2028 (%)
- 9.4 Europe - Market size and forecast 2023-2028
- Chart on Europe - Market size and forecast 2023-2028 ($ million)
- Data Table on Europe - Market size and forecast 2023-2028 ($ million)
- Chart on Europe - Year-over-year growth 2023-2028 (%)
- Data Table on Europe - Year-over-year growth 2023-2028 (%)
- 9.5 APAC - Market size and forecast 2023-2028
- Chart on APAC - Market size and forecast 2023-2028 ($ million)
- Data Table on APAC - Market size and forecast 2023-2028 ($ million)
- Chart on APAC - Year-over-year growth 2023-2028 (%)
- Data Table on APAC - Year-over-year growth 2023-2028 (%)
- 9.6 Middle East and Africa - Market size and forecast 2023-2028
- Chart on Middle East and Africa - Market size and forecast 2023-2028 ($ million)
- Data Table on Middle East and Africa - Market size and forecast 2023-2028 ($ million)
- Chart on Middle East and Africa - Year-over-year growth 2023-2028 (%)
- Data Table on Middle East and Africa - Year-over-year growth 2023-2028 (%)
- 9.7 South America - Market size and forecast 2023-2028
- Chart on South America - Market size and forecast 2023-2028 ($ million)
- Data Table on South America - Market size and forecast 2023-2028 ($ million)
- Chart on South America - Year-over-year growth 2023-2028 (%)
- Data Table on South America - Year-over-year growth 2023-2028 (%)
- 9.8 US - Market size and forecast 2023-2028
- Chart on US - Market size and forecast 2023-2028 ($ million)
- Data Table on US - Market size and forecast 2023-2028 ($ million)
- Chart on US - Year-over-year growth 2023-2028 (%)
- Data Table on US - Year-over-year growth 2023-2028 (%)
- 9.9 China - Market size and forecast 2023-2028
- Chart on China - Market size and forecast 2023-2028 ($ million)
- Data Table on China - Market size and forecast 2023-2028 ($ million)
- Chart on China - Year-over-year growth 2023-2028 (%)
- Data Table on China - Year-over-year growth 2023-2028 (%)
- 9.10 Germany - Market size and forecast 2023-2028
- Chart on Germany - Market size and forecast 2023-2028 ($ million)
- Data Table on Germany - Market size and forecast 2023-2028 ($ million)
- Chart on Germany - Year-over-year growth 2023-2028 (%)
- Data Table on Germany - Year-over-year growth 2023-2028 (%)
- 9.11 Japan - Market size and forecast 2023-2028
- Chart on Japan - Market size and forecast 2023-2028 ($ million)
- Data Table on Japan - Market size and forecast 2023-2028 ($ million)
- Chart on Japan - Year-over-year growth 2023-2028 (%)
- Data Table on Japan - Year-over-year growth 2023-2028 (%)
- 9.12 UK - Market size and forecast 2023-2028
- Chart on UK - Market size and forecast 2023-2028 ($ million)
- Data Table on UK - Market size and forecast 2023-2028 ($ million)
- Chart on UK - Year-over-year growth 2023-2028 (%)
- Data Table on UK - Year-over-year growth 2023-2028 (%)
- 9.13 Market opportunity By Geographical Landscape
- Market opportunity By Geographical Landscape ($ million)
- Data Tables on Market opportunity By Geographical Landscape ($ million)
10 Drivers, Challenges, and Opportunity/Restraints
- 10.1 Market drivers
- 10.2 Market challenges
- 10.3 Impact of drivers and challenges
- Impact of drivers and challenges in 2023 and 2028
- 10.4 Market opportunities/restraints
11 Competitive Landscape
- 11.1 Overview
- 11.2 Competitive Landscape
- Overview on criticality of inputs and factors of differentiation
- 11.3 Landscape disruption
- Overview on factors of disruption
- 11.4 Industry risks
- Impact of key risks on business
12 Competitive Analysis
- 12.1 Companies profiled
- Companies covered
- 12.2 Market positioning of companies
- Matrix on companies position and classification
- 3M Co.
- 3M Co. - Overview
- 3M Co. - Business segments
- 3M Co. - Key news
- 3M Co. - Key offerings
- 3M Co. - Segment focus
- 12.4 Alpha Pro Tech Ltd.
- Alpha Pro Tech Ltd. - Overview
- Alpha Pro Tech Ltd. - Business segments
- Alpha Pro Tech Ltd. - Key offerings
- Alpha Pro Tech Ltd. - Segment focus
- 12.5 Bei BeI Safety Co. Ltd.
- Bei BeI Safety Co. Ltd. - Overview
- Bei BeI Safety Co. Ltd. - Product / Service
- Bei BeI Safety Co. Ltd. - Key offerings
- 12.6 CIGWELD Pty Ltd.
- CIGWELD Pty Ltd. - Overview
- CIGWELD Pty Ltd. - Product / Service
- CIGWELD Pty Ltd. - Key offerings
- 12.7 Dou Yee Enterprises S Pte Ltd.
- Dou Yee Enterprises S Pte Ltd. - Overview
- Dou Yee Enterprises S Pte Ltd. - Product / Service
- Dou Yee Enterprises S Pte Ltd. - Key offerings
- 12.8 Honeywell International Inc.
- Honeywell International Inc. - Overview
- Honeywell International Inc. - Business segments
- Honeywell International Inc. - Key news
- Honeywell International Inc. - Key offerings
- Honeywell International Inc. - Segment focus
- 12.9 JSP Ltd.
- JSP Ltd. - Overview
- JSP Ltd. - Product / Service
- JSP Ltd. - Key offerings
- 12.10 Merck KGaA
- Merck KGaA - Overview
- Merck KGaA - Business segments
- Merck KGaA - Key news
- Merck KGaA - Key offerings
- Merck KGaA - Segment focus
- 12.11 MSA Safety Inc.
- MSA Safety Inc. - Overview
- MSA Safety Inc. - Business segments
- MSA Safety Inc. - Key news
- MSA Safety Inc. - Key offerings
- MSA Safety Inc. - Segment focus
- 12.12 PETZL Distribution
- PETZL Distribution - Overview
- PETZL Distribution - Product / Service
- PETZL Distribution - Key offerings
- 12.13 Productos Climax SA
- Productos Climax SA - Overview
- Productos Climax SA - Product / Service
- Productos Climax SA - Key offerings
- 12.14 PROTECT Laserschutz GmbH
- PROTECT Laserschutz GmbH - Overview
- PROTECT Laserschutz GmbH - Product / Service
- PROTECT Laserschutz GmbH - Key offerings
- 12.15 Radians Inc.
- Radians Inc. - Overview
- Radians Inc. - Product / Service
- Radians Inc. - Key offerings
- 12.16 STERIS plc
- STERIS plc - Overview
- STERIS plc - Business segments
- STERIS plc - Key offerings
- STERIS plc - Segment focus
- 12.17 Univet Srl
- Univet Srl - Overview
- Univet Srl - Product / Service
- Univet Srl - Key offerings
13 Appendix
- 13.1 Scope of the report
- 13.2 Inclusions and exclusions checklist
- Inclusions checklist
- Exclusions checklist
- 13.3 Currency conversion rates for US$
- Currency conversion rates for US$
- 13.4 Research methodology
- Research methodology
- 13.5 Data procurement
- Information sources
- 13.6 Data validation
- Data validation
- 13.7 Validation techniques employed for market sizing
- Validation techniques employed for market sizing
- 13.8 Data synthesis
- Data synthesis
- 13.9 360 degree market analysis
- 360 degree market analysis
- 13.10 List of abbreviations
- List of abbreviations

