|
|
市場調査レポート
商品コード
1915556
世界の壁紙市場2025-2029年Global Wallcovering Market 2025-2029 |
||||||
|
|||||||
カスタマイズ可能
|
|||||||

| 世界の壁紙市場2025-2029年 |
|
出版日: 2026年01月19日
発行: TechNavio
ページ情報: 英文 281 Pages
納期: 即納可能
|

概要
世界の壁装材市場は、2024年から2029年にかけて67億4,300万米ドルの成長が見込まれ、予測期間中のCAGRは5.2%と予測されています。
本報告書では、世界の壁装材市場に関する包括的な分析、市場規模と予測、動向、成長要因、課題に加え、約25社のベンダー分析を提供しております。
本レポートは、現在の市場状況、最新の動向と促進要因、市場環境全般に関する最新の分析を提供します。市場は、室内空間の再評価への関心の高まり、生活水準の向上、プレミアム製品の導入増加、世界の建設産業の成長によって牽引されています。
本調査は、業界の主要関係者からの情報を含む、一次情報と二次情報の客観的な組み合わせを用いて実施されました。本レポートには、主要企業の分析に加え、包括的な市場規模データ、地域別分析を伴うセグメント、ベンダー情勢が含まれています。レポートには過去データと予測データが掲載されています。
| 市場範囲 | |
|---|---|
| 基準年 | 2025年 |
| 終了年 | 2029年 |
| 予測期間 | 2025-2029 |
| 成長モメンタム | 加速 |
| 前年比 | 4.9% |
| CAGR | 5.2% |
| 増分額 | 67億4,300万米ドル |
本調査では、デジタル印刷とマス・カスタマイゼーションの統合が、今後数年間における世界の壁装材市場成長を牽引する主要な要因の一つであると特定しております。また、環境に優しく無害な壁紙への嗜好の高まりや、商業施設からの需要増加が、市場において相当な需要を生み出すものと見込まれます。
目次
第1章 エグゼクティブサマリー
第2章 Technavio分析
- 価格・ライフサイクル・顧客購入バスケット・採用率・購入基準の分析
- インプットの重要性と差別化の要因
- 混乱の要因
- 促進要因と課題の影響
第3章 市場情勢
- 市場エコシステム
- 市場の特徴
- バリューチェーン分析
第4章 市場規模
- 市場の定義
- 市場セグメント分析
- 市場規模 2024
- 市場の見通し 2024-2029
第5章 市場規模実績
- 世界の壁紙市場 2019-2023
- タイプセグメント分析 2019-2023
- エンドユーザーセグメント分析 2019-2023
- 素材セグメント分析 2019-2023
- 地域別セグメント分析 2019-2023
- 国別セグメント分析 2019-2023
第6章 定性分析
- 人工知能が世界の壁紙市場
第7章 ファイブフォース分析
- ファイブフォースの要約
- 買い手の交渉力
- 供給企業の交渉力
- 新規参入業者の脅威
- 代替品の脅威
- 競争の脅威
- 市況
第8章 市場セグメンテーション:タイプ別
- 比較:タイプ別
- 壁パネル
- タイル
- 金属製壁装材
- 市場機会:タイプ別
第9章 市場セグメンテーション:エンドユーザー別
- 比較:エンドユーザー別
- 住宅用
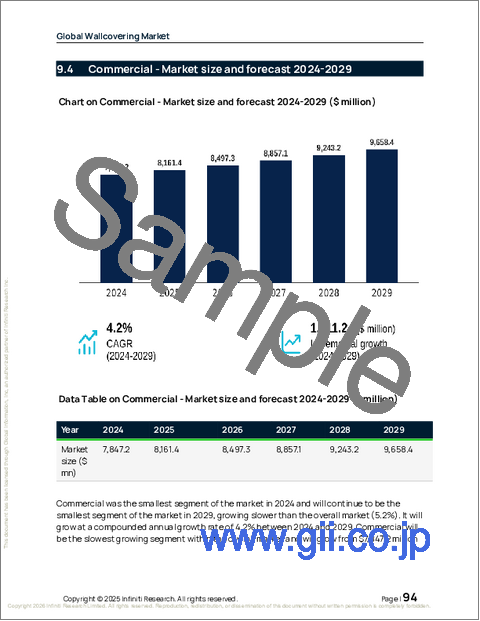
- 商業用
- 市場機会:エンドユーザー別
第10章 市場セグメンテーション:素材別
- 比較:素材別
- ビニール
- 布地
- 紙ベース
- 木材系
- 市場機会:素材別
第11章 顧客情勢
第12章 地域別情勢
- 地域別セグメンテーション
- 地域別比較
- アジア太平洋
- 中国
- 日本
- インド
- 韓国
- オーストラリア
- インドネシア
- 北米
- 米国
- カナダ
- メキシコ
- 欧州
- ドイツ
- 英国
- フランス
- イタリア
- スペイン
- オランダ
- 中東・アフリカ
- サウジアラビア
- アラブ首長国連邦
- 南アフリカ
- イスラエル
- トルコ
- 南米
- ブラジル
- アルゼンチン
- チリ
- 市場機会:地域別
第13章 促進要因・課題・機会
- 市場促進要因
- 市場の課題
- 促進要因と課題の影響
- 市場機会
第14章 競合情勢
- 概要
- 競合情勢
- 混乱の状況
- 業界のリスク
第15章 競合分析
- 企業プロファイル
- 企業ランキング指標
- 企業の市場ポジショニング
- Asian Paints Ltd.
- BRADLEY USA LLC
- BestOfBharat.com
- Brewster Home Fashions
- Excel Home Decor Pvt. Ltd.
- F. Schumacher and Co.
- Fandf Pvt. Ltd.
- Len Tex Corp.
- Marburger Tapetenfabrik JB
- Muraspec Decorative Solutions
- Nicobar Design Pvt. Ltd.
- Prime Walls US
- Sandberg Wallpaper
- Sangetsu Goodrich Co. Ltd.
- The Sherwin Williams Co.

