|
|
市場調査レポート
商品コード
1177471
オレンジの世界市場 2023-2027Global Orange Market 2023-2027 |
||||||
|
|
|||||||
|
● お客様のご希望に応じて、既存データの加工や未掲載情報(例:国別セグメント)の追加などの対応が可能です。 詳細はお問い合わせください。 |
|||||||


| オレンジの世界市場 2023-2027 |
|
出版日: 2022年12月16日
発行: TechNavio
ページ情報: 英文 140 Pages
納期: 即納可能
|
- 全表示
- 概要
- 図表
- 目次
当レポートではオレンジ市場をモニタリングしており、2022年から2027年の間に3,157万2,550トン、予測期間中のCAGRは6.22%で成長すると予測しています。
当レポートでは、オレンジ市場の全体分析、市場規模と予測、動向、成長促進要因・課題、約25のベンダーを網羅したベンダー分析などを提供します。
現在の市場動向と促進要因、市場環境全体に関する最新の分析を提供しています。市場は、オレンジを摂取することの利点に関する認知度やプロモーションの高まり、業界に対する需要の高まり、小売業界の拡大によって牽引されています。
本調査では、今後数年間のオレンジ市場の成長を牽引する主な要因の1つとして、柑橘類の利点に対する認知度の高まりを挙げています。また、食品サプライチェーンの複雑化とオレンジの革新的なラベリングは、市場の大きな需要につながるでしょう。
目次
第1章 エグゼクティブサマリー
- 市場概要
第2章 市場情勢
- 市場エコシステム
第3章 市場規模
- 市場の定義
- 市場セグメント分析
- 市場規模 2022
- 市場の見通し:2022-2027年の予測
第4章 市場規模実績
- オレンジの世界市場 2023-2027、2017-2021
- 製品タイプセグメント分析 2017-2021
- 用途セグメント分析 2017-2021
- 地域セグメント分析 2017-2021
- 国セグメント分析 2017-2021
第5章 ファイブフォース分析
- ファイブフォースの要約
- 買い手の交渉力
- 供給企業の交渉力
- 新規参入業者の脅威
- 代替品の脅威
- 競争の脅威
- 市況
第6章 製品タイプ別の市場セグメンテーション
- 市場内訳
- 製品タイプ別比較
- フレッシュ - 市場規模と予測 2022-2027
- 加工および冷凍 - 市場規模と予測 2022-2027
- 製品タイプ別の市場機会
第7章 用途別市場セグメンテーション
- 市場内訳
- 用途別比較
- 非有機 - 市場規模と予測 2022-2027
- オーガニック - 市場規模と予測 2022-2027
- 用途別の市場機会
第8章 顧客情勢
- 顧客情勢の概要
第9章 地域別情勢
- 地域別セグメンテーション
- 地域別比較
- APAC - 市場規模と予測 2022-2027
- 欧州 - 市場規模と予測 2022-2027
- 北米 - 市場規模と予測 2022-2027
- 南米 - 市場規模と予測 2022-2027
- 中東およびアフリカ - 市場規模と予測 2022-2027
- ブラジル - 市場規模と予測 2022-2027
- 中国 - 市場規模と予測 2022-2027
- インド - 市場規模と予測 2022-2027
- 米国 - 市場規模と予測 2022-2027
- メキシコ - 市場規模と予測 2022-2027
- 地域情勢別の市場機会
第10章 促進要因、課題、および動向
- 市場促進要因
- 市場の課題
- 促進要因と課題の影響
- 市場動向
第11章 ベンダー情勢
- 概要
- ベンダー情勢
- 混乱の状況
- 業界のリスク
第12章 ベンダー分析
- 対象ベンダー
- ベンダーの市場ポジショニング
- Berje Inc.
- Citrosuco
- Citrus World Inc.
- Hyatt Fruit Co.
- INDIAN RIVER FRUIT Co.
- LEMONCONCENTRATE SLU
- Nielsen Citrus Products Co. Inc.
- Paradise Juice Pvt. Ltd.
- Perricone Farms
- Schacht Groves
- SEQUOIA ORANGE Co. Inc.
- SUNRISE FRUITS COMPANY SL
- The Fruit Co.
- Trinity Fruit Co.
- Zain Natural Agro India Pvt. Ltd.
第13章 付録
Exhibits:
- Exhibits1: Executive Summary - Chart on Market Overview
- Exhibits2: Executive Summary - Data Table on Market Overview
- Exhibits3: Executive Summary - Chart on Global Market Characteristics
- Exhibits4: Executive Summary - Chart on Market By Geographical Landscape
- Exhibits5: Executive Summary - Chart on Market Segmentation by Product Type
- Exhibits6: Executive Summary - Chart on Market Segmentation by Application
- Exhibits7: Executive Summary - Chart on Incremental Growth
- Exhibits8: Executive Summary - Data Table on Incremental Growth
- Exhibits9: Executive Summary - Chart on Vendor Market Positioning
- Exhibits10: Parent market
- Exhibits11: Market Characteristics
- Exhibits12: Offerings of vendors included in the market definition
- Exhibits13: Market segments
- Exhibits14: Chart on Global - Market size and forecast 2022-2027 (thousand t)
- Exhibits15: Data Table on Global - Market size and forecast 2022-2027 (thousand t)
- Exhibits16: Chart on Global Market- Year-over-year growth 2022-2027 (%)
- Exhibits17: Data Table on Global Market- Year-over-year growth 2022-2027 (%)
- Exhibits18: Historic Market Size - Data Table on Global Orange Market 2023-2027 2017 - 2021 (thousand t)
- Exhibits19: Historic Market Size - Product Type Segment 2017 - 2021 (thousand t)
- Exhibits20: Historic Market Size - Application Segment 2017 - 2021 (thousand t)
- Exhibits21: Historic Market Size - Geography Segment 2017 - 2021 (thousand t)
- Exhibits22: Historic Market Size - Country Segment 2017 - 2021 (thousand t)
- Exhibits23: Five forces analysis - Comparison between 2022 and 2027
- Exhibits24: Chart on Bargaining power of buyers - Impact of key factors 2022 and 2027
- Exhibits25: Bargaining power of suppliers - Impact of key factors in 2022 and 2027
- Exhibits26: Threat of new entrants - Impact of key factors in 2022 and 2027
- Exhibits27: Threat of substitutes - Impact of key factors in 2022 and 2027
- Exhibits28: Threat of rivalry - Impact of key factors in 2022 and 2027
- Exhibits29: Chart on Market condition - Five forces 2022 and 2027
- Exhibits30: Chart on Product Type - Market share 2022-2027 (%)
- Exhibits31: Data Table on Product Type - Market share 2022-2027 (%)
- Exhibits32: Chart on Comparison by Product Type
- Exhibits33: Data Table on Comparison by Product Type
- Exhibits34: Chart on Fresh - Market size and forecast 2022-2027 (thousand t)
- Exhibits35: Data Table on Fresh - Market size and forecast 2022-2027 (thousand t)
- Exhibits36: Chart on Fresh - Year-over-year growth 2022-2027 (%)
- Exhibits37: Data Table on Fresh - Year-over-year growth 2022-2027 (%)
- Exhibits38: Chart on Processed and frozen - Market size and forecast 2022-2027 (thousand t)
- Exhibits39: Data Table on Processed and frozen - Market size and forecast 2022-2027 (thousand t)
- Exhibits40: Chart on Processed and frozen - Year-over-year growth 2022-2027 (%)
- Exhibits41: Data Table on Processed and frozen - Year-over-year growth 2022-2027 (%)
- Exhibits42: Market opportunity by Product Type (thousand t)
- Exhibits43: Chart on Application - Market share 2022-2027 (%)
- Exhibits44: Data Table on Application - Market share 2022-2027 (%)
- Exhibits45: Chart on Comparison by Application
- Exhibits46: Data Table on Comparison by Application
- Exhibits47: Chart on Non-organic - Market size and forecast 2022-2027 (thousand t)
- Exhibits48: Data Table on Non-organic - Market size and forecast 2022-2027 (thousand t)
- Exhibits49: Chart on Non-organic - Year-over-year growth 2022-2027 (%)
- Exhibits50: Data Table on Non-organic - Year-over-year growth 2022-2027 (%)
- Exhibits51: Chart on Organic - Market size and forecast 2022-2027 (thousand t)
- Exhibits52: Data Table on Organic - Market size and forecast 2022-2027 (thousand t)
- Exhibits53: Chart on Organic - Year-over-year growth 2022-2027 (%)
- Exhibits54: Data Table on Organic - Year-over-year growth 2022-2027 (%)
- Exhibits55: Market opportunity by Application (thousand t)
- Exhibits56: Analysis of price sensitivity, lifecycle, customer purchase basket, adoption rates, and purchase criteria
- Exhibits57: Chart on Market share By Geographical Landscape 2022-2027 (%)
- Exhibits58: Data Table on Market share By Geographical Landscape 2022-2027 (%)
- Exhibits59: Chart on Geographic comparison
- Exhibits60: Data Table on Geographic comparison
- Exhibits61: Chart on APAC - Market size and forecast 2022-2027 (thousand t)
- Exhibits62: Data Table on APAC - Market size and forecast 2022-2027 (thousand t)
- Exhibits63: Chart on APAC - Year-over-year growth 2022-2027 (%)
- Exhibits64: Data Table on APAC - Year-over-year growth 2022-2027 (%)
- Exhibits65: Chart on Europe - Market size and forecast 2022-2027 (thousand t)
- Exhibits66: Data Table on Europe - Market size and forecast 2022-2027 (thousand t)
- Exhibits67: Chart on Europe - Year-over-year growth 2022-2027 (%)
- Exhibits68: Data Table on Europe - Year-over-year growth 2022-2027 (%)
- Exhibits69: Chart on North America - Market size and forecast 2022-2027 (thousand t)
- Exhibits70: Data Table on North America - Market size and forecast 2022-2027 (thousand t)
- Exhibits71: Chart on North America - Year-over-year growth 2022-2027 (%)
- Exhibits72: Data Table on North America - Year-over-year growth 2022-2027 (%)
- Exhibits73: Chart on South America - Market size and forecast 2022-2027 (thousand t)
- Exhibits74: Data Table on South America - Market size and forecast 2022-2027 (thousand t)
- Exhibits75: Chart on South America - Year-over-year growth 2022-2027 (%)
- Exhibits76: Data Table on South America - Year-over-year growth 2022-2027 (%)
- Exhibits77: Chart on Middle East and Africa - Market size and forecast 2022-2027 (thousand t)
- Exhibits78: Data Table on Middle East and Africa - Market size and forecast 2022-2027 (thousand t)
- Exhibits79: Chart on Middle East and Africa - Year-over-year growth 2022-2027 (%)
- Exhibits80: Data Table on Middle East and Africa - Year-over-year growth 2022-2027 (%)
- Exhibits81: Chart on Brazil - Market size and forecast 2022-2027 (thousand t)
- Exhibits82: Data Table on Brazil - Market size and forecast 2022-2027 (thousand t)
- Exhibits83: Chart on Brazil - Year-over-year growth 2022-2027 (%)
- Exhibits84: Data Table on Brazil - Year-over-year growth 2022-2027 (%)
- Exhibits85: Chart on China - Market size and forecast 2022-2027 (thousand t)
- Exhibits86: Data Table on China - Market size and forecast 2022-2027 (thousand t)
- Exhibits87: Chart on China - Year-over-year growth 2022-2027 (%)
- Exhibits88: Data Table on China - Year-over-year growth 2022-2027 (%)
- Exhibits89: Chart on India - Market size and forecast 2022-2027 (thousand t)
- Exhibits90: Data Table on India - Market size and forecast 2022-2027 (thousand t)
- Exhibits91: Chart on India - Year-over-year growth 2022-2027 (%)
- Exhibits92: Data Table on India - Year-over-year growth 2022-2027 (%)
- Exhibits93: Chart on US - Market size and forecast 2022-2027 (thousand t)
- Exhibits94: Data Table on US - Market size and forecast 2022-2027 (thousand t)
- Exhibits95: Chart on US - Year-over-year growth 2022-2027 (%)
- Exhibits96: Data Table on US - Year-over-year growth 2022-2027 (%)
- Exhibits97: Chart on Mexico - Market size and forecast 2022-2027 (thousand t)
- Exhibits98: Data Table on Mexico - Market size and forecast 2022-2027 (thousand t)
- Exhibits99: Chart on Mexico - Year-over-year growth 2022-2027 (%)
- Exhibits100: Data Table on Mexico - Year-over-year growth 2022-2027 (%)
- Exhibits101: Market opportunity By Geographical Landscape (thousand t)
- Exhibits102: Impact of drivers and challenges in 2022 and 2027
- Exhibits103: Overview on Criticality of inputs and Factors of differentiation
- Exhibits104: Overview on factors of disruption
- Exhibits105: Impact of key risks on business
- Exhibits106: Vendors covered
- Exhibits107: Matrix on vendor position and classification
- Exhibits108: Berje Inc. - Overview
- Exhibits109: Berje Inc. - Product / Service
- Exhibits110: Berje Inc. - Key offerings
- Exhibits111: Citrosuco - Overview
- Exhibits112: Citrosuco - Product / Service
- Exhibits113: Citrosuco - Key offerings
- Exhibits114: Citrus World Inc. - Overview
- Exhibits115: Citrus World Inc. - Product / Service
- Exhibits116: Citrus World Inc. - Key offerings
- Exhibits117: Hyatt Fruit Co. - Overview
- Exhibits118: Hyatt Fruit Co. - Product / Service
- Exhibits119: Hyatt Fruit Co. - Key offerings
- Exhibits120: INDIAN RIVER FRUIT Co. - Overview
- Exhibits121: INDIAN RIVER FRUIT Co. - Product / Service
- Exhibits122: INDIAN RIVER FRUIT Co. - Key offerings
- Exhibits123: LEMONCONCENTRATE SLU - Overview
- Exhibits124: LEMONCONCENTRATE SLU - Product / Service
- Exhibits125: LEMONCONCENTRATE SLU - Key offerings
- Exhibits126: Nielsen Citrus Products Co. Inc. - Overview
- Exhibits127: Nielsen Citrus Products Co. Inc. - Product / Service
- Exhibits128: Nielsen Citrus Products Co. Inc. - Key offerings
- Exhibits129: Paradise Juice Pvt. Ltd. - Overview
- Exhibits130: Paradise Juice Pvt. Ltd. - Product / Service
- Exhibits131: Paradise Juice Pvt. Ltd. - Key offerings
- Exhibits132: Perricone Farms - Overview
- Exhibits133: Perricone Farms - Product / Service
- Exhibits134: Perricone Farms - Key offerings
- Exhibits135: Schacht Groves - Overview
- Exhibits136: Schacht Groves - Product / Service
- Exhibits137: Schacht Groves - Key offerings
- Exhibits138: SEQUOIA ORANGE Co. Inc. - Overview
- Exhibits139: SEQUOIA ORANGE Co. Inc. - Product / Service
- Exhibits140: SEQUOIA ORANGE Co. Inc. - Key offerings
- Exhibits141: SUNRISE FRUITS COMPANY SL - Overview
- Exhibits142: SUNRISE FRUITS COMPANY SL - Product / Service
- Exhibits143: SUNRISE FRUITS COMPANY SL - Key offerings
- Exhibits144: The Fruit Co. - Overview
- Exhibits145: The Fruit Co. - Product / Service
- Exhibits146: The Fruit Co. - Key offerings
- Exhibits147: Trinity Fruit Co. - Overview
- Exhibits148: Trinity Fruit Co. - Product / Service
- Exhibits149: Trinity Fruit Co. - Key offerings
- Exhibits150: Zain Natural Agro India Pvt. Ltd. - Overview
- Exhibits151: Zain Natural Agro India Pvt. Ltd. - Product / Service
- Exhibits152: Zain Natural Agro India Pvt. Ltd. - Key offerings
- Exhibits153: Inclusions checklist
- Exhibits154: Exclusions checklist
- Exhibits155: Currency conversion rates for US$
- Exhibits156: Research methodology
- Exhibits157: Validation techniques employed for market sizing
- Exhibits158: Information sources
- Exhibits159: List of abbreviations
Technavio has been monitoring the orange market and is forecast to grow by 31572.55 thousand tons during 2022-2027, accelerating at a CAGR of 6.22% during the forecast period. Our report on the orange market provides a holistic analysis, market size and forecast, trends, growth drivers, and challenges, as well as vendor analysis covering around 25 vendors.
The report offers an up-to-date analysis regarding the current market scenario, the latest trends and drivers, and the overall market environment. The market is driven by growing awareness and promotion of the benefits of consuming oranges, higher demand for industries, and expansion in the retail landscape.
Technavio's orange market is segmented as below:
By Product Type
- Fresh
- Processed
- Frozen
By Application
- Non-organic
- Organic
By Geographical Landscape
- APAC
- Europe
- North America
- South America
- Middle East and Africa
This study identifies the growing awareness of the benefits of citrus fruits as one of the prime reasons driving the orange market growth during the next few years. Also, increasing complexities in the food supply chain and innovative labeling for oranges will lead to sizable demand in the market.
Technavio presents a detailed picture of the market by the way of study, synthesis, and summation of data from multiple sources by an analysis of key parameters. Our report on the orange market covers the following areas:
- Orange market sizing
- Orange market forecast
- Orange market industry analysis
Technavio's robust vendor analysis is designed to help clients improve their market position, and in line with this, this report provides a detailed analysis of several leading orange market vendors that include Berje Inc., Citrosuco, Citrus World Inc., Hyatt Fruit Co., INDIAN RIVER FRUIT Co., LEMONCONCENTRATE SLU, Louis Dreyfus Co. BV, Nielsen Citrus Products Co. Inc., PACIFIC COAST FRUIT PRODUCTS Ltd., Paradise Juice Pvt. Ltd., Perricone Farms, Schacht Groves, SEQUOIA ORANGE Co. Inc., SUNRISE FRUITS COMPANY SL, The Fruit Co., Trinity Fruit Co., Tropicana Products Inc., and Zain Natural Agro India Pvt. Ltd. Also, the orange market analysis report includes information on upcoming trends and challenges that will influence market growth. This is to help companies strategize and leverage all forthcoming growth opportunities.
The study was conducted using an objective combination of primary and secondary information including inputs from key participants in the industry. The report contains a comprehensive market and vendor landscape in addition to an analysis of the key vendors.
Technavio presents a detailed picture of the market by the way of study, synthesis, and summation of data from multiple sources by an analysis of key parameters such as profit, pricing, competition, and promotions. It presents various market facets by identifying the key industry influencers. The data presented is comprehensive, reliable, and a result of extensive research - both primary and secondary. Technavio's market research reports provide a complete competitive landscape and an in-depth vendor selection methodology and analysis using qualitative and quantitative research to forecast the accurate market growth.
Table of Contents
1 Executive Summary
- 1.1 Market overview
- Exhibit 01: Executive Summary - Chart on Market Overview
- Exhibit 02: Executive Summary - Data Table on Market Overview
- Exhibit 03: Executive Summary - Chart on Global Market Characteristics
- Exhibit 04: Executive Summary - Chart on Market By Geographical Landscape
- Exhibit 05: Executive Summary - Chart on Market Segmentation by Product Type
- Exhibit 06: Executive Summary - Chart on Market Segmentation by Application
- Exhibit 07: Executive Summary - Chart on Incremental Growth
- Exhibit 08: Executive Summary - Data Table on Incremental Growth
- Exhibit 09: Executive Summary - Chart on Vendor Market Positioning
2 Market Landscape
- 2.1 Market ecosystem
- Exhibit 10: Parent market
- Exhibit 11: Market Characteristics
3 Market Sizing
- 3.1 Market definition
- Exhibit 12: Offerings of vendors included in the market definition
- 3.2 Market segment analysis
- Exhibit 13: Market segments
- 3.3 Market size 2022
- 3.4 Market outlook: Forecast for 2022-2027
- Exhibit 14: Chart on Global - Market size and forecast 2022-2027 (thousand t)
- Exhibit 15: Data Table on Global - Market size and forecast 2022-2027 (thousand t)
- Exhibit 16: Chart on Global Market- Year-over-year growth 2022-2027 (%)
- Exhibit 17: Data Table on Global Market- Year-over-year growth 2022-2027 (%)
4 Historic Market Size
- 4.1 Global Orange Market 2023-2027 2017 - 2021
- Exhibit 18: Historic Market Size - Data Table on Global Orange Market 2023-2027 2017 - 2021 (thousand t)
- 4.2 Product Type Segment Analysis 2017 - 2021
- Exhibit 19: Historic Market Size - Product Type Segment 2017 - 2021 (thousand t)
- 4.3 Application Segment Analysis 2017 - 2021
- Exhibit 20: Historic Market Size - Application Segment 2017 - 2021 (thousand t)
- 4.4 Geography Segment Analysis 2017 - 2021
- Exhibit 21: Historic Market Size - Geography Segment 2017 - 2021 (thousand t)
- 4.5 Country Segment Analysis 2017 - 2021
- Exhibit 22: Historic Market Size - Country Segment 2017 - 2021 (thousand t)
5 Five Forces Analysis
- 5.1 Five forces summary
- Exhibit 23: Five forces analysis - Comparison between 2022 and 2027
- 5.2 Bargaining power of buyers
- Exhibit 24: Chart on Bargaining power of buyers - Impact of key factors 2022 and 2027
- 5.3 Bargaining power of suppliers
- Exhibit 25: Bargaining power of suppliers - Impact of key factors in 2022 and 2027
- 5.4 Threat of new entrants
- Exhibit 26: Threat of new entrants - Impact of key factors in 2022 and 2027
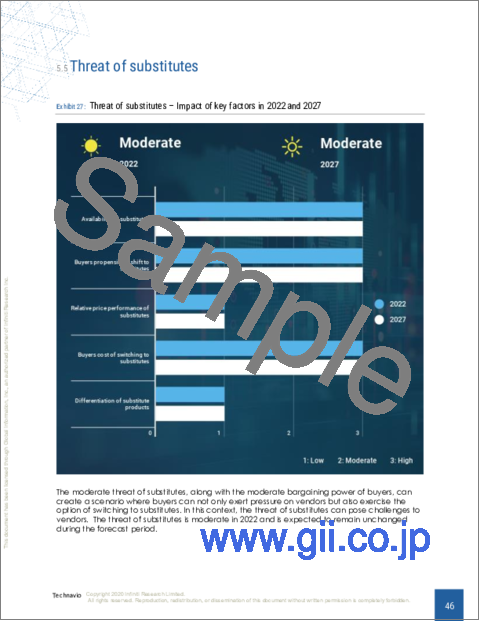
- 5.5 Threat of substitutes
- Exhibit 27: Threat of substitutes - Impact of key factors in 2022 and 2027
- 5.6 Threat of rivalry
- Exhibit 28: Threat of rivalry - Impact of key factors in 2022 and 2027
- 5.7 Market condition
- Exhibit 29: Chart on Market condition - Five forces 2022 and 2027
6 Market Segmentation by Product Type
- 6.1 Market segments
- Exhibit 30: Chart on Product Type - Market share 2022-2027 (%)
- Exhibit 31: Data Table on Product Type - Market share 2022-2027 (%)
- 6.2 Comparison by Product Type
- Exhibit 32: Chart on Comparison by Product Type
- Exhibit 33: Data Table on Comparison by Product Type
- 6.3 Fresh - Market size and forecast 2022-2027
- Exhibit 34: Chart on Fresh - Market size and forecast 2022-2027 (thousand t)
- Exhibit 35: Data Table on Fresh - Market size and forecast 2022-2027 (thousand t)
- Exhibit 36: Chart on Fresh - Year-over-year growth 2022-2027 (%)
- Exhibit 37: Data Table on Fresh - Year-over-year growth 2022-2027 (%)
- 6.4 Processed and frozen - Market size and forecast 2022-2027
- Exhibit 38: Chart on Processed and frozen - Market size and forecast 2022-2027 (thousand t)
- Exhibit 39: Data Table on Processed and frozen - Market size and forecast 2022-2027 (thousand t)
- Exhibit 40: Chart on Processed and frozen - Year-over-year growth 2022-2027 (%)
- Exhibit 41: Data Table on Processed and frozen - Year-over-year growth 2022-2027 (%)
- 6.5 Market opportunity by Product Type
- Exhibit 42: Market opportunity by Product Type (thousand t)
7 Market Segmentation by Application
- 7.1 Market segments
- Exhibit 43: Chart on Application - Market share 2022-2027 (%)
- Exhibit 44: Data Table on Application - Market share 2022-2027 (%)
- 7.2 Comparison by Application
- Exhibit 45: Chart on Comparison by Application
- Exhibit 46: Data Table on Comparison by Application
- 7.3 Non-organic - Market size and forecast 2022-2027
- Exhibit 47: Chart on Non-organic - Market size and forecast 2022-2027 (thousand t)
- Exhibit 48: Data Table on Non-organic - Market size and forecast 2022-2027 (thousand t)
- Exhibit 49: Chart on Non-organic - Year-over-year growth 2022-2027 (%)
- Exhibit 50: Data Table on Non-organic - Year-over-year growth 2022-2027 (%)
- 7.4 Organic - Market size and forecast 2022-2027
- Exhibit 51: Chart on Organic - Market size and forecast 2022-2027 (thousand t)
- Exhibit 52: Data Table on Organic - Market size and forecast 2022-2027 (thousand t)
- Exhibit 53: Chart on Organic - Year-over-year growth 2022-2027 (%)
- Exhibit 54: Data Table on Organic - Year-over-year growth 2022-2027 (%)
- 7.5 Market opportunity by Application
- Exhibit 55: Market opportunity by Application (thousand t)
8 Customer Landscape
- 8.1 Customer landscape overview
- Exhibit 56: Analysis of price sensitivity, lifecycle, customer purchase basket, adoption rates, and purchase criteria
9 Geographic Landscape
- 9.1 Geographic segmentation
- Exhibit 57: Chart on Market share By Geographical Landscape 2022-2027 (%)
- Exhibit 58: Data Table on Market share By Geographical Landscape 2022-2027 (%)
- 9.2 Geographic comparison
- Exhibit 59: Chart on Geographic comparison
- Exhibit 60: Data Table on Geographic comparison
- 9.3 APAC - Market size and forecast 2022-2027
- Exhibit 61: Chart on APAC - Market size and forecast 2022-2027 (thousand t)
- Exhibit 62: Data Table on APAC - Market size and forecast 2022-2027 (thousand t)
- Exhibit 63: Chart on APAC - Year-over-year growth 2022-2027 (%)
- Exhibit 64: Data Table on APAC - Year-over-year growth 2022-2027 (%)
- 9.4 Europe - Market size and forecast 2022-2027
- Exhibit 65: Chart on Europe - Market size and forecast 2022-2027 (thousand t)
- Exhibit 66: Data Table on Europe - Market size and forecast 2022-2027 (thousand t)
- Exhibit 67: Chart on Europe - Year-over-year growth 2022-2027 (%)
- Exhibit 68: Data Table on Europe - Year-over-year growth 2022-2027 (%)
- 9.5 North America - Market size and forecast 2022-2027
- Exhibit 69: Chart on North America - Market size and forecast 2022-2027 (thousand t)
- Exhibit 70: Data Table on North America - Market size and forecast 2022-2027 (thousand t)
- Exhibit 71: Chart on North America - Year-over-year growth 2022-2027 (%)
- Exhibit 72: Data Table on North America - Year-over-year growth 2022-2027 (%)
- 9.6 South America - Market size and forecast 2022-2027
- Exhibit 73: Chart on South America - Market size and forecast 2022-2027 (thousand t)
- Exhibit 74: Data Table on South America - Market size and forecast 2022-2027 (thousand t)
- Exhibit 75: Chart on South America - Year-over-year growth 2022-2027 (%)
- Exhibit 76: Data Table on South America - Year-over-year growth 2022-2027 (%)
- 9.7 Middle East and Africa - Market size and forecast 2022-2027
- Exhibit 77: Chart on Middle East and Africa - Market size and forecast 2022-2027 (thousand t)
- Exhibit 78: Data Table on Middle East and Africa - Market size and forecast 2022-2027 (thousand t)
- Exhibit 79: Chart on Middle East and Africa - Year-over-year growth 2022-2027 (%)
- Exhibit 80: Data Table on Middle East and Africa - Year-over-year growth 2022-2027 (%)
- 9.8 Brazil - Market size and forecast 2022-2027
- Exhibit 81: Chart on Brazil - Market size and forecast 2022-2027 (thousand t)
- Exhibit 82: Data Table on Brazil - Market size and forecast 2022-2027 (thousand t)
- Exhibit 83: Chart on Brazil - Year-over-year growth 2022-2027 (%)
- Exhibit 84: Data Table on Brazil - Year-over-year growth 2022-2027 (%)
- 9.9 China - Market size and forecast 2022-2027
- Exhibit 85: Chart on China - Market size and forecast 2022-2027 (thousand t)
- Exhibit 86: Data Table on China - Market size and forecast 2022-2027 (thousand t)
- Exhibit 87: Chart on China - Year-over-year growth 2022-2027 (%)
- Exhibit 88: Data Table on China - Year-over-year growth 2022-2027 (%)
- 9.10 India - Market size and forecast 2022-2027
- Exhibit 89: Chart on India - Market size and forecast 2022-2027 (thousand t)
- Exhibit 90: Data Table on India - Market size and forecast 2022-2027 (thousand t)
- Exhibit 91: Chart on India - Year-over-year growth 2022-2027 (%)
- Exhibit 92: Data Table on India - Year-over-year growth 2022-2027 (%)
- 9.11 US - Market size and forecast 2022-2027
- Exhibit 93: Chart on US - Market size and forecast 2022-2027 (thousand t)
- Exhibit 94: Data Table on US - Market size and forecast 2022-2027 (thousand t)
- Exhibit 95: Chart on US - Year-over-year growth 2022-2027 (%)
- Exhibit 96: Data Table on US - Year-over-year growth 2022-2027 (%)
- 9.12 Mexico - Market size and forecast 2022-2027
- Exhibit 97: Chart on Mexico - Market size and forecast 2022-2027 (thousand t)
- Exhibit 98: Data Table on Mexico - Market size and forecast 2022-2027 (thousand t)
- Exhibit 99: Chart on Mexico - Year-over-year growth 2022-2027 (%)
- Exhibit 100: Data Table on Mexico - Year-over-year growth 2022-2027 (%)
- 9.13 Market opportunity By Geographical Landscape
- Exhibit 101: Market opportunity By Geographical Landscape (thousand t)
10 Drivers, Challenges, and Trends
- 10.1 Market drivers
- 10.2 Market challenges
- 10.3 Impact of drivers and challenges
- Exhibit 102: Impact of drivers and challenges in 2022 and 2027
- 10.4 Market trends
11 Vendor Landscape
- 11.1 Overview
- 11.2 Vendor landscape
- Exhibit 103: Overview on Criticality of inputs and Factors of differentiation
- 11.3 Landscape disruption
- Exhibit 104: Overview on factors of disruption
- 11.4 Industry risks
- Exhibit 105: Impact of key risks on business
12 Vendor Analysis
- 12.1 Vendors covered
- Exhibit 106: Vendors covered
- 12.2 Market positioning of vendors
- Exhibit 107: Matrix on vendor position and classification
- 12.3 Berje Inc.
- Exhibit 108: Berje Inc. - Overview
- Exhibit 109: Berje Inc. - Product / Service
- Exhibit 110: Berje Inc. - Key offerings
- 12.4 Citrosuco
- Exhibit 111: Citrosuco - Overview
- Exhibit 112: Citrosuco - Product / Service
- Exhibit 113: Citrosuco - Key offerings
- 12.5 Citrus World Inc.
- Exhibit 114: Citrus World Inc. - Overview
- Exhibit 115: Citrus World Inc. - Product / Service
- Exhibit 116: Citrus World Inc. - Key offerings
- 12.6 Hyatt Fruit Co.
- Exhibit 117: Hyatt Fruit Co. - Overview
- Exhibit 118: Hyatt Fruit Co. - Product / Service
- Exhibit 119: Hyatt Fruit Co. - Key offerings
- 12.7 INDIAN RIVER FRUIT Co.
- Exhibit 120: INDIAN RIVER FRUIT Co. - Overview
- Exhibit 121: INDIAN RIVER FRUIT Co. - Product / Service
- Exhibit 122: INDIAN RIVER FRUIT Co. - Key offerings
- 12.8 LEMONCONCENTRATE SLU
- Exhibit 123: LEMONCONCENTRATE SLU - Overview
- Exhibit 124: LEMONCONCENTRATE SLU - Product / Service
- Exhibit 125: LEMONCONCENTRATE SLU - Key offerings
- 12.9 Nielsen Citrus Products Co. Inc.
- Exhibit 126: Nielsen Citrus Products Co. Inc. - Overview
- Exhibit 127: Nielsen Citrus Products Co. Inc. - Product / Service
- Exhibit 128: Nielsen Citrus Products Co. Inc. - Key offerings
- 12.10 Paradise Juice Pvt. Ltd.
- Exhibit 129: Paradise Juice Pvt. Ltd. - Overview
- Exhibit 130: Paradise Juice Pvt. Ltd. - Product / Service
- Exhibit 131: Paradise Juice Pvt. Ltd. - Key offerings
- 12.11 Perricone Farms
- Exhibit 132: Perricone Farms - Overview
- Exhibit 133: Perricone Farms - Product / Service
- Exhibit 134: Perricone Farms - Key offerings
- 12.12 Schacht Groves
- Exhibit 135: Schacht Groves - Overview
- Exhibit 136: Schacht Groves - Product / Service
- Exhibit 137: Schacht Groves - Key offerings
- 12.13 SEQUOIA ORANGE Co. Inc.
- Exhibit 138: SEQUOIA ORANGE Co. Inc. - Overview
- Exhibit 139: SEQUOIA ORANGE Co. Inc. - Product / Service
- Exhibit 140: SEQUOIA ORANGE Co. Inc. - Key offerings
- 12.14 SUNRISE FRUITS COMPANY SL
- Exhibit 141: SUNRISE FRUITS COMPANY SL - Overview
- Exhibit 142: SUNRISE FRUITS COMPANY SL - Product / Service
- Exhibit 143: SUNRISE FRUITS COMPANY SL - Key offerings
- 12.15 The Fruit Co.
- Exhibit 144: The Fruit Co. - Overview
- Exhibit 145: The Fruit Co. - Product / Service
- Exhibit 146: The Fruit Co. - Key offerings
- 12.16 Trinity Fruit Co.
- Exhibit 147: Trinity Fruit Co. - Overview
- Exhibit 148: Trinity Fruit Co. - Product / Service
- Exhibit 149: Trinity Fruit Co. - Key offerings
- 12.17 Zain Natural Agro India Pvt. Ltd.
- Exhibit 150: Zain Natural Agro India Pvt. Ltd. - Overview
- Exhibit 151: Zain Natural Agro India Pvt. Ltd. - Product / Service
- Exhibit 152: Zain Natural Agro India Pvt. Ltd. - Key offerings
13 Appendix
- 13.1 Scope of the report
- 13.2 Inclusions and exclusions checklist
- Exhibit 153: Inclusions checklist
- Exhibit 154: Exclusions checklist
- 13.3 Currency conversion rates for US$
- Exhibit 155: Currency conversion rates for US$
- 13.4 Research methodology
- Exhibit 156: Research methodology
- Exhibit 157: Validation techniques employed for market sizing
- Exhibit 158: Information sources
- 13.5 List of abbreviations
- Exhibit 159: List of abbreviations