|
|
市場調査レポート
商品コード
1544336
反芻動物用飼料の世界市場 2024-2028Global Ruminant Feed Market 2024-2028 |
||||||
|
|||||||
カスタマイズ可能
|
|||||||

| 反芻動物用飼料の世界市場 2024-2028 |
|
出版日: 2024年07月12日
発行: TechNavio
ページ情報: 英文 169 Pages
納期: 即納可能
|

全表示
- 概要
- 図表
- 目次
反芻動物用飼料市場は2023-2028年に292億米ドル、予測期間中のCAGRは4.6%で成長すると予測されます。
当レポートでは、反芻動物用飼料市場の全体的な分析、市場規模・予測、動向、成長促進要因、課題、約25のベンダーを網羅したベンダー分析などを掲載しています。
現在の市場シナリオ、最新動向と促進要因、市場環境全体に関する最新分析を提供しています。牛の健康に対する懸念の高まり、戦略的提携や買収の増加、精密栄養に対する需要の高まりなどが市場を牽引しています。
| 市場範囲 | |
|---|---|
| 基準年 | 2024 |
| 終了年 | 2028 |
| 予測期間 | 2024-2028 |
| 成長モメンタム | 加速 |
| 前年比2024年 | 4.14% |
| CAGR | 4.6% |
| 増分額 | 292億米ドル |
本調査では、今後数年間における反芻動物用飼料市場の成長を牽引する主な要因の一つとして、食肉製品に対する需要の高まりを挙げています。また、同市場への投資の増加と研究開発費の増加は、同市場における大規模な需要につながります。
目次
第1章 エグゼクティブサマリー
- 市場概要
第2章 市場情勢
- 市場エコシステム
- 市場の特徴
- バリューチェーン分析
第3章 市場規模の評価
- 市場の定義
- 市場セグメント分析
- 市場規模 2023
- 市場の見通し 2023-2028
第4章 市場規模実績
- 反芻動物用飼料の世界市場 2018-2022
- 動物タイプ別セグメント分析 2018-2022
- エンドユーザー別セグメント分析 2018-2022
- 地域別セグメント分析 2018-2022
- 国別セグメント分析 2018-2022
第5章 ファイブフォース分析
- ファイブフォースの要約
- 買い手の交渉力
- 供給企業の交渉力
- 新規参入業者の脅威
- 代替品の脅威
- 競争の脅威
- 市況
第6章 市場セグメンテーション:動物タイプ別
- 市場セグメンテーション
- 比較:動物タイプ別
- 乳牛:市場規模と予測 2023-2028
- 肉牛:市場規模と予測 2023-2028
- その他:市場規模と予測 2023-2028
- 市場機会:動物タイプ別
第7章 市場セグメンテーション:エンドユーザー別
- 市場セグメンテーション
- 比較:エンドユーザー別
- 酪農場:市場規模と予測 2023-2028
- 動物病院:市場規模と予測 2023-2028
- その他:市場規模と予測 2023-2028
- 市場機会:エンドユーザー別
第8章 顧客情勢
- 顧客情勢の概要
第9章 地域別情勢
- 地域別セグメンテーション
- 比較:地域別
- アジア太平洋:市場規模と予測 2023-2028
- 欧州:市場規模と予測 2023-2028
- 北米:市場規模と予測 2023-2028
- 南米:市場規模と予測 2023-2028
- 中東・アフリカ:市場規模と予測 2023-2028
- 中国:市場規模と予測 2023-2028
- 米国:市場規模と予測 2023-2028
- ブラジル:市場規模と予測 2023-2028
- ロシア:市場規模と予測 2023-2028
- スペイン:市場規模と予測 2023-2028
- 市場機会:地域別
第10章 促進要因・課題・機会・抑制要因
- 市場促進要因
- 市場の課題
- 促進要因と課題の影響
- 市場の機会・抑制要因
第11章 競合情勢
- 概要
- 競合情勢
- 混乱の状況
- 業界のリスク
第12章 競合分析
- 企業プロファイル
- 企業の市場ポジショニング
- Archer Daniels Midland Co.
- Beneo GmbH
- Bentoli
- Cargill Inc.
- Charoen Pokphand Foods PCL
- Epol
- Evonik Industries AG
- ForFarmers NV
- International Flavors and Fragrances Inc.
- Kemin Industries Inc.
- Koninklijke DSM NV
- Neogen Corp.
- Perdue Farms Inc.
- SHV Holdings N.V.
- Tyson Foods Inc.
第13章 付録
Exhibits:
- Exhibits1: Executive Summary - Chart on Market Overview
- Exhibits2: Executive Summary - Data Table on Market Overview
- Exhibits3: Executive Summary - Chart on Global Market Characteristics
- Exhibits4: Executive Summary - Chart on Market By Geographical Landscape
- Exhibits5: Executive Summary - Chart on Market Segmentation by Animal Type
- Exhibits6: Executive Summary - Chart on Market Segmentation by End-user
- Exhibits7: Executive Summary - Chart on Incremental Growth
- Exhibits8: Executive Summary - Data Table on Incremental Growth
- Exhibits9: Executive Summary - Chart on Company Market Positioning
- Exhibits10: Parent Market
- Exhibits11: Data Table on - Parent Market
- Exhibits12: Market characteristics analysis
- Exhibits13: Value Chain Analysis
- Exhibits14: Offerings of companies included in the market definition
- Exhibits15: Market segments
- Exhibits16: Chart on Global - Market size and forecast 2023-2028 ($ billion)
- Exhibits17: Data Table on Global - Market size and forecast 2023-2028 ($ billion)
- Exhibits18: Chart on Global Market: Year-over-year growth 2023-2028 (%)
- Exhibits19: Data Table on Global Market: Year-over-year growth 2023-2028 (%)
- Exhibits20: Historic Market Size - Data Table on Global Ruminant Feed Market 2018 - 2022 ($ billion)
- Exhibits21: Historic Market Size - Animal Type Segment 2018 - 2022 ($ billion)
- Exhibits22: Historic Market Size - End-user Segment 2018 - 2022 ($ billion)
- Exhibits23: Historic Market Size - Geography Segment 2018 - 2022 ($ billion)
- Exhibits24: Historic Market Size - Country Segment 2018 - 2022 ($ billion)
- Exhibits25: Five forces analysis - Comparison between 2023 and 2028
- Exhibits26: Bargaining power of buyers - Impact of key factors 2023 and 2028
- Exhibits27: Bargaining power of suppliers - Impact of key factors in 2023 and 2028
- Exhibits28: Threat of new entrants - Impact of key factors in 2023 and 2028
- Exhibits29: Threat of substitutes - Impact of key factors in 2023 and 2028
- Exhibits30: Threat of rivalry - Impact of key factors in 2023 and 2028
- Exhibits31: Chart on Market condition - Five forces 2023 and 2028
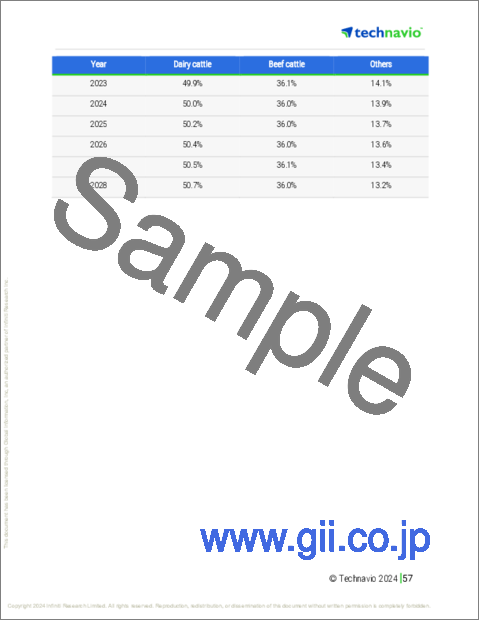
- Exhibits32: Chart on Animal Type - Market share 2023-2028 (%)
- Exhibits33: Data Table on Animal Type - Market share 2023-2028 (%)
- Exhibits34: Chart on Comparison by Animal Type
- Exhibits35: Data Table on Comparison by Animal Type
- Exhibits36: Chart on Dairy cattle - Market size and forecast 2023-2028 ($ billion)
- Exhibits37: Data Table on Dairy cattle - Market size and forecast 2023-2028 ($ billion)
- Exhibits38: Chart on Dairy cattle - Year-over-year growth 2023-2028 (%)
- Exhibits39: Data Table on Dairy cattle - Year-over-year growth 2023-2028 (%)
- Exhibits40: Chart on Beef cattle - Market size and forecast 2023-2028 ($ billion)
- Exhibits41: Data Table on Beef cattle - Market size and forecast 2023-2028 ($ billion)
- Exhibits42: Chart on Beef cattle - Year-over-year growth 2023-2028 (%)
- Exhibits43: Data Table on Beef cattle - Year-over-year growth 2023-2028 (%)
- Exhibits44: Chart on Others - Market size and forecast 2023-2028 ($ billion)
- Exhibits45: Data Table on Others - Market size and forecast 2023-2028 ($ billion)
- Exhibits46: Chart on Others - Year-over-year growth 2023-2028 (%)
- Exhibits47: Data Table on Others - Year-over-year growth 2023-2028 (%)
- Exhibits48: Market opportunity by Animal Type ($ billion)
- Exhibits49: Data Table on Market opportunity by Animal Type ($ billion)
- Exhibits50: Chart on End-user - Market share 2023-2028 (%)
- Exhibits51: Data Table on End-user - Market share 2023-2028 (%)
- Exhibits52: Chart on Comparison by End-user
- Exhibits53: Data Table on Comparison by End-user
- Exhibits54: Chart on Dairy farm - Market size and forecast 2023-2028 ($ billion)
- Exhibits55: Data Table on Dairy farm - Market size and forecast 2023-2028 ($ billion)
- Exhibits56: Chart on Dairy farm - Year-over-year growth 2023-2028 (%)
- Exhibits57: Data Table on Dairy farm - Year-over-year growth 2023-2028 (%)
- Exhibits58: Chart on Veterinary hospitals - Market size and forecast 2023-2028 ($ billion)
- Exhibits59: Data Table on Veterinary hospitals - Market size and forecast 2023-2028 ($ billion)
- Exhibits60: Chart on Veterinary hospitals - Year-over-year growth 2023-2028 (%)
- Exhibits61: Data Table on Veterinary hospitals - Year-over-year growth 2023-2028 (%)
- Exhibits62: Chart on Others - Market size and forecast 2023-2028 ($ billion)
- Exhibits63: Data Table on Others - Market size and forecast 2023-2028 ($ billion)
- Exhibits64: Chart on Others - Year-over-year growth 2023-2028 (%)
- Exhibits65: Data Table on Others - Year-over-year growth 2023-2028 (%)
- Exhibits66: Market opportunity by End-user ($ billion)
- Exhibits67: Data Table on Market opportunity by End-user ($ billion)
- Exhibits68: Analysis of price sensitivity, lifecycle, customer purchase basket, adoption rates, and purchase criteria
- Exhibits69: Chart on Market share By Geographical Landscape 2023-2028 (%)
- Exhibits70: Data Table on Market share By Geographical Landscape 2023-2028 (%)
- Exhibits71: Chart on Geographic comparison
- Exhibits72: Data Table on Geographic comparison
- Exhibits73: Chart on APAC - Market size and forecast 2023-2028 ($ billion)
- Exhibits74: Data Table on APAC - Market size and forecast 2023-2028 ($ billion)
- Exhibits75: Chart on APAC - Year-over-year growth 2023-2028 (%)
- Exhibits76: Data Table on APAC - Year-over-year growth 2023-2028 (%)
- Exhibits77: Chart on Europe - Market size and forecast 2023-2028 ($ billion)
- Exhibits78: Data Table on Europe - Market size and forecast 2023-2028 ($ billion)
- Exhibits79: Chart on Europe - Year-over-year growth 2023-2028 (%)
- Exhibits80: Data Table on Europe - Year-over-year growth 2023-2028 (%)
- Exhibits81: Chart on North America - Market size and forecast 2023-2028 ($ billion)
- Exhibits82: Data Table on North America - Market size and forecast 2023-2028 ($ billion)
- Exhibits83: Chart on North America - Year-over-year growth 2023-2028 (%)
- Exhibits84: Data Table on North America - Year-over-year growth 2023-2028 (%)
- Exhibits85: Chart on South America - Market size and forecast 2023-2028 ($ billion)
- Exhibits86: Data Table on South America - Market size and forecast 2023-2028 ($ billion)
- Exhibits87: Chart on South America - Year-over-year growth 2023-2028 (%)
- Exhibits88: Data Table on South America - Year-over-year growth 2023-2028 (%)
- Exhibits89: Chart on Middle East and Africa - Market size and forecast 2023-2028 ($ billion)
- Exhibits90: Data Table on Middle East and Africa - Market size and forecast 2023-2028 ($ billion)
- Exhibits91: Chart on Middle East and Africa - Year-over-year growth 2023-2028 (%)
- Exhibits92: Data Table on Middle East and Africa - Year-over-year growth 2023-2028 (%)
- Exhibits93: Chart on China - Market size and forecast 2023-2028 ($ billion)
- Exhibits94: Data Table on China - Market size and forecast 2023-2028 ($ billion)
- Exhibits95: Chart on China - Year-over-year growth 2023-2028 (%)
- Exhibits96: Data Table on China - Year-over-year growth 2023-2028 (%)
- Exhibits97: Chart on US - Market size and forecast 2023-2028 ($ billion)
- Exhibits98: Data Table on US - Market size and forecast 2023-2028 ($ billion)
- Exhibits99: Chart on US - Year-over-year growth 2023-2028 (%)
- Exhibits100: Data Table on US - Year-over-year growth 2023-2028 (%)
- Exhibits101: Chart on Brazil - Market size and forecast 2023-2028 ($ billion)
- Exhibits102: Data Table on Brazil - Market size and forecast 2023-2028 ($ billion)
- Exhibits103: Chart on Brazil - Year-over-year growth 2023-2028 (%)
- Exhibits104: Data Table on Brazil - Year-over-year growth 2023-2028 (%)
- Exhibits105: Chart on Russia - Market size and forecast 2023-2028 ($ billion)
- Exhibits106: Data Table on Russia - Market size and forecast 2023-2028 ($ billion)
- Exhibits107: Chart on Russia - Year-over-year growth 2023-2028 (%)
- Exhibits108: Data Table on Russia - Year-over-year growth 2023-2028 (%)
- Exhibits109: Chart on Spain - Market size and forecast 2023-2028 ($ billion)
- Exhibits110: Data Table on Spain - Market size and forecast 2023-2028 ($ billion)
- Exhibits111: Chart on Spain - Year-over-year growth 2023-2028 (%)
- Exhibits112: Data Table on Spain - Year-over-year growth 2023-2028 (%)
- Exhibits113: Market opportunity By Geographical Landscape ($ billion)
- Exhibits114: Data Tables on Market opportunity By Geographical Landscape ($ billion)
- Exhibits115: Impact of drivers and challenges in 2023 and 2028
- Exhibits116: Overview on criticality of inputs and factors of differentiation
- Exhibits117: Overview on factors of disruption
- Exhibits118: Impact of key risks on business
- Exhibits119: Companies covered
- Exhibits120: Matrix on companies position and classification
- Exhibits121: Archer Daniels Midland Co. - Overview
- Exhibits122: Archer Daniels Midland Co. - Business segments
- Exhibits123: Archer Daniels Midland Co. - Key news
- Exhibits124: Archer Daniels Midland Co. - Key offerings
- Exhibits125: Archer Daniels Midland Co. - Segment focus
- Exhibits126: Beneo GmbH - Overview
- Exhibits127: Beneo GmbH - Product / Service
- Exhibits128: Beneo GmbH - Key news
- Exhibits129: Beneo GmbH - Key offerings
- Exhibits130: Bentoli - Overview
- Exhibits131: Bentoli - Product / Service
- Exhibits132: Bentoli - Key offerings
- Exhibits133: Cargill Inc. - Overview
- Exhibits134: Cargill Inc. - Product / Service
- Exhibits135: Cargill Inc. - Key news
- Exhibits136: Cargill Inc. - Key offerings
- Exhibits137: Charoen Pokphand Foods PCL - Overview
- Exhibits138: Charoen Pokphand Foods PCL - Business segments
- Exhibits139: Charoen Pokphand Foods PCL - Key news
- Exhibits140: Charoen Pokphand Foods PCL - Key offerings
- Exhibits141: Charoen Pokphand Foods PCL - Segment focus
- Exhibits142: Epol - Overview
- Exhibits143: Epol - Product / Service
- Exhibits144: Epol - Key offerings
- Exhibits145: Evonik Industries AG - Overview
- Exhibits146: Evonik Industries AG - Business segments
- Exhibits147: Evonik Industries AG - Key news
- Exhibits148: Evonik Industries AG - Key offerings
- Exhibits149: Evonik Industries AG - Segment focus
- Exhibits150: ForFarmers NV - Overview
- Exhibits151: ForFarmers NV - Business segments
- Exhibits152: ForFarmers NV - Key offerings
- Exhibits153: ForFarmers NV - Segment focus
- Exhibits154: International Flavors and Fragrances Inc. - Overview
- Exhibits155: International Flavors and Fragrances Inc. - Business segments
- Exhibits156: International Flavors and Fragrances Inc. - Key news
- Exhibits157: International Flavors and Fragrances Inc. - Key offerings
- Exhibits158: International Flavors and Fragrances Inc. - Segment focus
- Exhibits159: Kemin Industries Inc. - Overview
- Exhibits160: Kemin Industries Inc. - Product / Service
- Exhibits161: Kemin Industries Inc. - Key news
- Exhibits162: Kemin Industries Inc. - Key offerings
- Exhibits163: Koninklijke DSM NV - Overview
- Exhibits164: Koninklijke DSM NV - Business segments
- Exhibits165: Koninklijke DSM NV - Key news
- Exhibits166: Koninklijke DSM NV - Key offerings
- Exhibits167: Koninklijke DSM NV - Segment focus
- Exhibits168: Neogen Corp. - Overview
- Exhibits169: Neogen Corp. - Business segments
- Exhibits170: Neogen Corp. - Key news
- Exhibits171: Neogen Corp. - Key offerings
- Exhibits172: Neogen Corp. - Segment focus
- Exhibits173: Perdue Farms Inc. - Overview
- Exhibits174: Perdue Farms Inc. - Product / Service
- Exhibits175: Perdue Farms Inc. - Key offerings
- Exhibits176: SHV Holdings N.V. - Overview
- Exhibits177: SHV Holdings N.V. - Product / Service
- Exhibits178: SHV Holdings N.V. - Key offerings
- Exhibits179: Tyson Foods Inc. - Overview
- Exhibits180: Tyson Foods Inc. - Business segments
- Exhibits181: Tyson Foods Inc. - Key news
- Exhibits182: Tyson Foods Inc. - Key offerings
- Exhibits183: Tyson Foods Inc. - Segment focus
- Exhibits184: Inclusions checklist
- Exhibits185: Exclusions checklist
- Exhibits186: Currency conversion rates for US$
- Exhibits187: Research methodology
- Exhibits188: Information sources
- Exhibits189: Data validation
- Exhibits190: Validation techniques employed for market sizing
- Exhibits191: Data synthesis
- Exhibits192: 360 degree market analysis
- Exhibits193: List of abbreviations
The ruminant feed market is forecasted to grow by USD 29.2 bn during 2023-2028, accelerating at a CAGR of 4.6% during the forecast period. The report on the ruminant feed market provides a holistic analysis, market size and forecast, trends, growth drivers, and challenges, as well as vendor analysis covering around 25 vendors.
The report offers an up-to-date analysis regarding the current market scenario, the latest trends and drivers, and the overall market environment. The market is driven by rising concerns over cattle health, growing number of strategic partnerships and acquisitions, and rising demand for precision nutrition.
Technavio's ruminant feed market is segmented as below:
| Market Scope | |
|---|---|
| Base Year | 2024 |
| End Year | 2028 |
| Series Year | 2024-2028 |
| Growth Momentum | Accelerate |
| YOY 2024 | 4.14% |
| CAGR | 4.6% |
| Incremental Value | $29.2 bn |
By Animal Type
- Dairy cattle
- Beef cattle
- Others
By End-user
- Dairy farm
- Veterinary hospitals
- Others
By Geographical Landscape
- APAC
- Europe
- North America
- South America
- Middle East and Africa
This study identifies the growing demand for meat products as one of the prime reasons driving the ruminant feed market growth during the next few years. Also, increasing investments in the market and rising r and d spending will lead to sizable demand in the market.
The report on the ruminant feed market covers the following areas:
- Ruminant feed market sizing
- Ruminant feed market forecast
- Ruminant feed market industry analysis
The robust vendor analysis is designed to help clients improve their market position, and in line with this, this report provides a detailed analysis of several leading ruminant feed market vendors that include Alltech Inc., Archer Daniels Midland Co., Beneo GmbH, Bentoli, Cargill Inc., Charoen Pokphand Foods PCL, Davidson Brothers Shotts Ltd., Epol, Evonik Industries AG, ForFarmers NV, Godrej Agrovet Ltd., International Flavors and Fragrances Inc., Kamdhenu Cattle Feeds Pvt. Ltd., Kemin Industries Inc., Koninklijke DSM NV, Land O Lakes Inc., Neogen Corp., Perdue Farms Inc., SHV Holdings N.V., and Tyson Foods Inc.. Also, the ruminant feed market analysis report includes information on upcoming trends and challenges that will influence market growth. This is to help companies strategize and leverage all forthcoming growth opportunities.
The study was conducted using an objective combination of primary and secondary information including inputs from key participants in the industry. The report contains a comprehensive market and vendor landscape in addition to an analysis of the key vendors.
The publisher presents a detailed picture of the market by the way of study, synthesis, and summation of data from multiple sources by an analysis of key parameters such as profit, pricing, competition, and promotions. It presents various market facets by identifying the key industry influencers. The data presented is comprehensive, reliable, and a result of extensive research - both primary and secondary. The market research reports provide a complete competitive landscape and an in-depth vendor selection methodology and analysis using qualitative and quantitative research to forecast the accurate market growth.
Table of Contents
1 Executive Summary
- 1.1 Market overview
- Executive Summary - Chart on Market Overview
- Executive Summary - Data Table on Market Overview
- Executive Summary - Chart on Global Market Characteristics
- Executive Summary - Chart on Market By Geographical Landscape
- Executive Summary - Chart on Market Segmentation by Animal Type
- Executive Summary - Chart on Market Segmentation by End-user
- Executive Summary - Chart on Incremental Growth
- Executive Summary - Data Table on Incremental Growth
- Executive Summary - Chart on Company Market Positioning
2 Market Landscape
- 2.1 Market ecosystem
- Parent Market
- Data Table on - Parent Market
- 2.2 Market characteristics
- Market characteristics analysis
- 2.3 Value chain analysis
- Value Chain Analysis
3 Market Sizing
- 3.1 Market definition
- Offerings of companies included in the market definition
- 3.2 Market segment analysis
- Market segments
- 3.3 Market size 2023
- 3.4 Market outlook: Forecast for 2023-2028
- Chart on Global - Market size and forecast 2023-2028 ($ billion)
- Data Table on Global - Market size and forecast 2023-2028 ($ billion)
- Chart on Global Market: Year-over-year growth 2023-2028 (%)
- Data Table on Global Market: Year-over-year growth 2023-2028 (%)
4 Historic Market Size
- 4.1 Global Ruminant Feed Market 2018 - 2022
- Historic Market Size - Data Table on Global Ruminant Feed Market 2018 - 2022 ($ billion)
- 4.2 Animal Type segment analysis 2018 - 2022
- Historic Market Size - Animal Type Segment 2018 - 2022 ($ billion)
- 4.3 End-user segment analysis 2018 - 2022
- Historic Market Size - End-user Segment 2018 - 2022 ($ billion)
- 4.4 Geography segment analysis 2018 - 2022
- Historic Market Size - Geography Segment 2018 - 2022 ($ billion)
- 4.5 Country segment analysis 2018 - 2022
- Historic Market Size - Country Segment 2018 - 2022 ($ billion)
5 Five Forces Analysis
- 5.1 Five forces summary
- Five forces analysis - Comparison between 2023 and 2028
- 5.2 Bargaining power of buyers
- Bargaining power of buyers - Impact of key factors 2023 and 2028
- 5.3 Bargaining power of suppliers
- Bargaining power of suppliers - Impact of key factors in 2023 and 2028
- 5.4 Threat of new entrants
- Threat of new entrants - Impact of key factors in 2023 and 2028
- 5.5 Threat of substitutes
- Threat of substitutes - Impact of key factors in 2023 and 2028
- 5.6 Threat of rivalry
- Threat of rivalry - Impact of key factors in 2023 and 2028
- 5.7 Market condition
- Chart on Market condition - Five forces 2023 and 2028
6 Market Segmentation by Animal Type
- 6.1 Market segments
- Chart on Animal Type - Market share 2023-2028 (%)
- Data Table on Animal Type - Market share 2023-2028 (%)
- 6.2 Comparison by Animal Type
- Chart on Comparison by Animal Type
- Data Table on Comparison by Animal Type
- 6.3 Dairy cattle - Market size and forecast 2023-2028
- Chart on Dairy cattle - Market size and forecast 2023-2028 ($ billion)
- Data Table on Dairy cattle - Market size and forecast 2023-2028 ($ billion)
- Chart on Dairy cattle - Year-over-year growth 2023-2028 (%)
- Data Table on Dairy cattle - Year-over-year growth 2023-2028 (%)
- 6.4 Beef cattle - Market size and forecast 2023-2028
- Chart on Beef cattle - Market size and forecast 2023-2028 ($ billion)
- Data Table on Beef cattle - Market size and forecast 2023-2028 ($ billion)
- Chart on Beef cattle - Year-over-year growth 2023-2028 (%)
- Data Table on Beef cattle - Year-over-year growth 2023-2028 (%)
- 6.5 Others - Market size and forecast 2023-2028
- Chart on Others - Market size and forecast 2023-2028 ($ billion)
- Data Table on Others - Market size and forecast 2023-2028 ($ billion)
- Chart on Others - Year-over-year growth 2023-2028 (%)
- Data Table on Others - Year-over-year growth 2023-2028 (%)
- 6.6 Market opportunity by Animal Type
- Market opportunity by Animal Type ($ billion)
- Data Table on Market opportunity by Animal Type ($ billion)
7 Market Segmentation by End-user
- 7.1 Market segments
- Chart on End-user - Market share 2023-2028 (%)
- Data Table on End-user - Market share 2023-2028 (%)
- 7.2 Comparison by End-user
- Chart on Comparison by End-user
- Data Table on Comparison by End-user
- 7.3 Dairy farm - Market size and forecast 2023-2028
- Chart on Dairy farm - Market size and forecast 2023-2028 ($ billion)
- Data Table on Dairy farm - Market size and forecast 2023-2028 ($ billion)
- Chart on Dairy farm - Year-over-year growth 2023-2028 (%)
- Data Table on Dairy farm - Year-over-year growth 2023-2028 (%)
- 7.4 Veterinary hospitals - Market size and forecast 2023-2028
- Chart on Veterinary hospitals - Market size and forecast 2023-2028 ($ billion)
- Data Table on Veterinary hospitals - Market size and forecast 2023-2028 ($ billion)
- Chart on Veterinary hospitals - Year-over-year growth 2023-2028 (%)
- Data Table on Veterinary hospitals - Year-over-year growth 2023-2028 (%)
- 7.5 Others - Market size and forecast 2023-2028
- Chart on Others - Market size and forecast 2023-2028 ($ billion)
- Data Table on Others - Market size and forecast 2023-2028 ($ billion)
- Chart on Others - Year-over-year growth 2023-2028 (%)
- Data Table on Others - Year-over-year growth 2023-2028 (%)
- 7.6 Market opportunity by End-user
- Market opportunity by End-user ($ billion)
- Data Table on Market opportunity by End-user ($ billion)
8 Customer Landscape
- 8.1 Customer landscape overview
- Analysis of price sensitivity, lifecycle, customer purchase basket, adoption rates, and purchase criteria
9 Geographic Landscape
- 9.1 Geographic segmentation
- Chart on Market share By Geographical Landscape 2023-2028 (%)
- Data Table on Market share By Geographical Landscape 2023-2028 (%)
- 9.2 Geographic comparison
- Chart on Geographic comparison
- Data Table on Geographic comparison
- 9.3 APAC - Market size and forecast 2023-2028
- Chart on APAC - Market size and forecast 2023-2028 ($ billion)
- Data Table on APAC - Market size and forecast 2023-2028 ($ billion)
- Chart on APAC - Year-over-year growth 2023-2028 (%)
- Data Table on APAC - Year-over-year growth 2023-2028 (%)
- 9.4 Europe - Market size and forecast 2023-2028
- Chart on Europe - Market size and forecast 2023-2028 ($ billion)
- Data Table on Europe - Market size and forecast 2023-2028 ($ billion)
- Chart on Europe - Year-over-year growth 2023-2028 (%)
- Data Table on Europe - Year-over-year growth 2023-2028 (%)
- 9.5 North America - Market size and forecast 2023-2028
- Chart on North America - Market size and forecast 2023-2028 ($ billion)
- Data Table on North America - Market size and forecast 2023-2028 ($ billion)
- Chart on North America - Year-over-year growth 2023-2028 (%)
- Data Table on North America - Year-over-year growth 2023-2028 (%)
- 9.6 South America - Market size and forecast 2023-2028
- Chart on South America - Market size and forecast 2023-2028 ($ billion)
- Data Table on South America - Market size and forecast 2023-2028 ($ billion)
- Chart on South America - Year-over-year growth 2023-2028 (%)
- Data Table on South America - Year-over-year growth 2023-2028 (%)
- 9.7 Middle East and Africa - Market size and forecast 2023-2028
- Chart on Middle East and Africa - Market size and forecast 2023-2028 ($ billion)
- Data Table on Middle East and Africa - Market size and forecast 2023-2028 ($ billion)
- Chart on Middle East and Africa - Year-over-year growth 2023-2028 (%)
- Data Table on Middle East and Africa - Year-over-year growth 2023-2028 (%)
- 9.8 China - Market size and forecast 2023-2028
- Chart on China - Market size and forecast 2023-2028 ($ billion)
- Data Table on China - Market size and forecast 2023-2028 ($ billion)
- Chart on China - Year-over-year growth 2023-2028 (%)
- Data Table on China - Year-over-year growth 2023-2028 (%)
- 9.9 US - Market size and forecast 2023-2028
- Chart on US - Market size and forecast 2023-2028 ($ billion)
- Data Table on US - Market size and forecast 2023-2028 ($ billion)
- Chart on US - Year-over-year growth 2023-2028 (%)
- Data Table on US - Year-over-year growth 2023-2028 (%)
- 9.10 Brazil - Market size and forecast 2023-2028
- Chart on Brazil - Market size and forecast 2023-2028 ($ billion)
- Data Table on Brazil - Market size and forecast 2023-2028 ($ billion)
- Chart on Brazil - Year-over-year growth 2023-2028 (%)
- Data Table on Brazil - Year-over-year growth 2023-2028 (%)
- 9.11 Russia - Market size and forecast 2023-2028
- Chart on Russia - Market size and forecast 2023-2028 ($ billion)
- Data Table on Russia - Market size and forecast 2023-2028 ($ billion)
- Chart on Russia - Year-over-year growth 2023-2028 (%)
- Data Table on Russia - Year-over-year growth 2023-2028 (%)
- 9.12 Spain - Market size and forecast 2023-2028
- Chart on Spain - Market size and forecast 2023-2028 ($ billion)
- Data Table on Spain - Market size and forecast 2023-2028 ($ billion)
- Chart on Spain - Year-over-year growth 2023-2028 (%)
- Data Table on Spain - Year-over-year growth 2023-2028 (%)
- 9.13 Market opportunity By Geographical Landscape
- Market opportunity By Geographical Landscape ($ billion)
- Data Tables on Market opportunity By Geographical Landscape ($ billion)
10 Drivers, Challenges, and Opportunity/Restraints
- 10.1 Market drivers
- 10.2 Market challenges
- 10.3 Impact of drivers and challenges
- Impact of drivers and challenges in 2023 and 2028
- 10.4 Market opportunities/restraints
11 Competitive Landscape
- 11.1 Overview
- 11.2 Competitive Landscape
- Overview on criticality of inputs and factors of differentiation
- 11.3 Landscape disruption
- Overview on factors of disruption
- 11.4 Industry risks
- Impact of key risks on business
12 Competitive Analysis
- 12.1 Companies profiled
- Companies covered
- 12.2 Market positioning of companies
- Matrix on companies position and classification
- 12.3 Archer Daniels Midland Co.
- Archer Daniels Midland Co. - Overview
- Archer Daniels Midland Co. - Business segments
- Archer Daniels Midland Co. - Key news
- Archer Daniels Midland Co. - Key offerings
- Archer Daniels Midland Co. - Segment focus
- 12.4 Beneo GmbH
- Beneo GmbH - Overview
- Beneo GmbH - Product / Service
- Beneo GmbH - Key news
- Beneo GmbH - Key offerings
- 12.5 Bentoli
- Bentoli - Overview
- Bentoli - Product / Service
- Bentoli - Key offerings
- 12.6 Cargill Inc.
- Cargill Inc. - Overview
- Cargill Inc. - Product / Service
- Cargill Inc. - Key news
- Cargill Inc. - Key offerings
- 12.7 Charoen Pokphand Foods PCL
- Charoen Pokphand Foods PCL - Overview
- Charoen Pokphand Foods PCL - Business segments
- Charoen Pokphand Foods PCL - Key news
- Charoen Pokphand Foods PCL - Key offerings
- Charoen Pokphand Foods PCL - Segment focus
- 12.8 Epol
- Epol - Overview
- Epol - Product / Service
- Epol - Key offerings
- 12.9 Evonik Industries AG
- Evonik Industries AG - Overview
- Evonik Industries AG - Business segments
- Evonik Industries AG - Key news
- Evonik Industries AG - Key offerings
- Evonik Industries AG - Segment focus
- 12.10 ForFarmers NV
- ForFarmers NV - Overview
- ForFarmers NV - Business segments
- ForFarmers NV - Key offerings
- ForFarmers NV - Segment focus
- 12.11 International Flavors and Fragrances Inc.
- International Flavors and Fragrances Inc. - Overview
- International Flavors and Fragrances Inc. - Business segments
- International Flavors and Fragrances Inc. - Key news
- International Flavors and Fragrances Inc. - Key offerings
- International Flavors and Fragrances Inc. - Segment focus
- 12.12 Kemin Industries Inc.
- Kemin Industries Inc. - Overview
- Kemin Industries Inc. - Product / Service
- Kemin Industries Inc. - Key news
- Kemin Industries Inc. - Key offerings
- 12.13 Koninklijke DSM NV
- Koninklijke DSM NV - Overview
- Koninklijke DSM NV - Business segments
- Koninklijke DSM NV - Key news
- Koninklijke DSM NV - Key offerings
- Koninklijke DSM NV - Segment focus
- 12.14 Neogen Corp.
- Neogen Corp. - Overview
- Neogen Corp. - Business segments
- Neogen Corp. - Key news
- Neogen Corp. - Key offerings
- Neogen Corp. - Segment focus
- 12.15 Perdue Farms Inc.
- Perdue Farms Inc. - Overview
- Perdue Farms Inc. - Product / Service
- Perdue Farms Inc. - Key offerings
- 12.16 SHV Holdings N.V.
- SHV Holdings N.V. - Overview
- SHV Holdings N.V. - Product / Service
- SHV Holdings N.V. - Key offerings
- 12.17 Tyson Foods Inc.
- Tyson Foods Inc. - Overview
- Tyson Foods Inc. - Business segments
- Tyson Foods Inc. - Key news
- Tyson Foods Inc. - Key offerings
- Tyson Foods Inc. - Segment focus
13 Appendix
- 13.1 Scope of the report
- 13.2 Inclusions and exclusions checklist
- Inclusions checklist
- Exclusions checklist
- 13.3 Currency conversion rates for US$
- Currency conversion rates for US$
- 13.4 Research methodology
- Research methodology
- 13.5 Data procurement
- Information sources
- 13.6 Data validation
- Data validation
- 13.7 Validation techniques employed for market sizing
- Validation techniques employed for market sizing
- 13.8 Data synthesis
- Data synthesis
- 13.9 360 degree market analysis
- 360 degree market analysis
- 13.10 List of abbreviations
- List of abbreviations

