|
|
市場調査レポート
商品コード
1502063
医療用外骨格の世界市場 2024-2028Global medical exoskeleton market 2024-2028 |
||||||
|
|||||||
カスタマイズ可能
|
|||||||

| 医療用外骨格の世界市場 2024-2028 |
|
出版日: 2024年05月21日
発行: TechNavio
ページ情報: 英文 159 Pages
納期: 即納可能
|

全表示
- 概要
- 図表
- 目次
医療用外骨格市場は2023-2028年に28億6,860万米ドル、予測期間中のCAGRは55.77%で成長すると予測されます。
当レポートでは、医療用外骨格市場の全体的な分析、市場規模・予測、動向、成長促進要因、課題、約25のベンダーを網羅したベンダー分析などを掲載しています。
現在の市場シナリオ、最新動向と促進要因、市場環境全体に関する最新分析を提供しています。同市場は、Scisの増加、リハビリテーションにおける医療用外骨格の利用増加、医療用外骨格に対する保険適用の増加などが牽引しています。
| 市場範囲 | |
|---|---|
| 基準年 | 2024 |
| 終了年 | 2028 |
| 予測期間 | 2024-2028 |
| 成長モメンタム | 加速 |
| 前年比2024年 | 38.93% |
| CAGR | 55.77% |
| 増分額 | 28億6,860万米ドル |
本調査では、今後数年間の医療用外骨格市場成長を牽引する主な要因の1つとして、技術的に先進的な製品の発売を挙げています。また、既存および新興技術を搭載した外骨格の使用への注目の高まりや、3dプリント医療用外骨格の開発への注目は、市場の大きな需要につながります。
目次
第1章 エグゼクティブサマリー
- 市場概要
第2章 市場情勢
- 市場エコシステム
- 市場の特徴
- バリューチェーン分析
第3章 市場規模の評価
- 市場の定義
- 市場セグメント分析
- 市場規模 2023
- 市場の見通し 2023-2028
第4章 市場規模実績
- 世界の医療用外骨格市場 2018-2022
- モビリティタイプ別セグメント分析 2018-2022
- 技術別セグメント分析 2018-2022
- 地域別セグメント分析 2018-2022
- 国別セグメント分析 2018-2022
第5章 ファイブフォース分析
- ファイブフォースの要約
- 買い手の交渉力
- 供給企業の交渉力
- 新規参入業者の脅威
- 代替品の脅威
- 競争の脅威
- 市況
第6章 市場セグメンテーション:モビリティタイプ別
- 市場セグメンテーション
- 比較:モビリティタイプ別
- 移動式外骨格:市場規模と予測 2023-2028
- 固定式外骨格:市場規模と予測 2023-2028
- 市場機会:モビリティタイプ別
第7章 市場セグメンテーション:技術別
- 市場セグメンテーション
- 比較:技術別
- パワードエクソスケルトン:市場規模と予測 2023-2028
- 受動型外骨格:市場規模と予測 2023-2028
- 市場機会:技術別
第8章 顧客情勢
- 顧客情勢の概要
第9章 地域別情勢
- 地域別セグメンテーション
- 地域別比較
- 北米:市場規模と予測 2023-2028
- 欧州:市場規模と予測 2023-2028
- アジア:市場規模と予測 2023-2028
- 世界のその他の地域:市場規模と予測 2023-2028
- 米国:市場規模と予測 2023-2028
- ドイツ:市場規模と予測 2023-2028
- 英国:市場規模と予測 2023-2028
- 中国:市場規模と予測 2023-2028
- 日本:市場規模と予測 2023-2028
- 市場機会:地域別
第10章 促進要因・課題・機会・抑制要因
- 市場促進要因
- 市場の課題
- 促進要因と課題の影響
- 市場の機会・抑制要因
第11章 競合情勢
- 概要
- 競合情勢
- 混乱の状況
- 業界のリスク
第12章 競合分析
- 企業プロファイル
- 企業の市場ポジショニング
- Bionik Laboratories Corp.
- B Temia
- Cyberdyne Inc.
- DIH Group
- Ekso Bionics Holdings Inc.
- Exoatlet Global SA
- GOGOA Mobility Robots SL
- Ottobock SE and Co. KGaA
- P and S Mechanics Co. Ltd.
- Parker Hannifin Corp.
- ReWalk Robotics Ltd.
- Rex Bionics Ltd.
- Sarcos Technology and Robotics Corp.
- Wandercraft
- Wearable Robotics Srl
第13章 付録
Exhibits:
- Exhibits1: Executive Summary - Chart on Market Overview
- Exhibits2: Executive Summary - Data Table on Market Overview
- Exhibits3: Executive Summary - Chart on Global Market Characteristics
- Exhibits4: Executive Summary - Chart on Market by Geography
- Exhibits5: Executive Summary - Chart on Market Segmentation by Mobility Type
- Exhibits6: Executive Summary - Chart on Market Segmentation by Technology
- Exhibits7: Executive Summary - Chart on Incremental Growth
- Exhibits8: Executive Summary - Data Table on Incremental Growth
- Exhibits9: Executive Summary - Chart on Company Market Positioning
- Exhibits10: Parent Market
- Exhibits11: Data Table on - Parent Market
- Exhibits12: Market characteristics analysis
- Exhibits13: Value Chain Analysis
- Exhibits14: Offerings of companies included in the market definition
- Exhibits15: Market segments
- Exhibits16: Chart on Global - Market size and forecast 2023-2028 ($ million)
- Exhibits17: Data Table on Global - Market size and forecast 2023-2028 ($ million)
- Exhibits18: Chart on Global Market: Year-over-year growth 2023-2028 (%)
- Exhibits19: Data Table on Global Market: Year-over-year growth 2023-2028 (%)
- Exhibits20: Historic Market Size - Data Table on Global Medical Exoskeleton Market 2018 - 2022 ($ million)
- Exhibits21: Historic Market Size - Mobility Type Segment 2018 - 2022 ($ million)
- Exhibits22: Historic Market Size - Technology Segment 2018 - 2022 ($ million)
- Exhibits23: Historic Market Size - Geography Segment 2018 - 2022 ($ million)
- Exhibits24: Historic Market Size - Country Segment 2018 - 2022 ($ million)
- Exhibits25: Five forces analysis - Comparison between 2023 and 2028
- Exhibits26: Bargaining power of buyers - Impact of key factors 2023 and 2028
- Exhibits27: Bargaining power of suppliers - Impact of key factors in 2023 and 2028
- Exhibits28: Threat of new entrants - Impact of key factors in 2023 and 2028
- Exhibits29: Threat of substitutes - Impact of key factors in 2023 and 2028
- Exhibits30: Threat of rivalry - Impact of key factors in 2023 and 2028
- Exhibits31: Chart on Market condition - Five forces 2023 and 2028
- Exhibits32: Chart on Mobility Type - Market share 2023-2028 (%)
- Exhibits33: Data Table on Mobility Type - Market share 2023-2028 (%)
- Exhibits34: Chart on Comparison by Mobility Type
- Exhibits35: Data Table on Comparison by Mobility Type
- Exhibits36: Chart on Mobile exoskeleton - Market size and forecast 2023-2028 ($ million)
- Exhibits37: Data Table on Mobile exoskeleton - Market size and forecast 2023-2028 ($ million)
- Exhibits38: Chart on Mobile exoskeleton - Year-over-year growth 2023-2028 (%)
- Exhibits39: Data Table on Mobile exoskeleton - Year-over-year growth 2023-2028 (%)
- Exhibits40: Chart on Stationary exoskeleton - Market size and forecast 2023-2028 ($ million)
- Exhibits41: Data Table on Stationary exoskeleton - Market size and forecast 2023-2028 ($ million)
- Exhibits42: Chart on Stationary exoskeleton - Year-over-year growth 2023-2028 (%)
- Exhibits43: Data Table on Stationary exoskeleton - Year-over-year growth 2023-2028 (%)
- Exhibits44: Market opportunity by Mobility Type ($ million)
- Exhibits45: Data Table on Market opportunity by Mobility Type ($ million)
- Exhibits46: Chart on Technology - Market share 2023-2028 (%)
- Exhibits47: Data Table on Technology - Market share 2023-2028 (%)
- Exhibits48: Chart on Comparison by Technology
- Exhibits49: Data Table on Comparison by Technology
- Exhibits50: Chart on Powered exoskeletons - Market size and forecast 2023-2028 ($ million)
- Exhibits51: Data Table on Powered exoskeletons - Market size and forecast 2023-2028 ($ million)
- Exhibits52: Chart on Powered exoskeletons - Year-over-year growth 2023-2028 (%)
- Exhibits53: Data Table on Powered exoskeletons - Year-over-year growth 2023-2028 (%)
- Exhibits54: Chart on Passive exoskeletons - Market size and forecast 2023-2028 ($ million)
- Exhibits55: Data Table on Passive exoskeletons - Market size and forecast 2023-2028 ($ million)
- Exhibits56: Chart on Passive exoskeletons - Year-over-year growth 2023-2028 (%)
- Exhibits57: Data Table on Passive exoskeletons - Year-over-year growth 2023-2028 (%)
- Exhibits58: Market opportunity by Technology ($ million)
- Exhibits59: Data Table on Market opportunity by Technology ($ million)
- Exhibits60: Analysis of price sensitivity, lifecycle, customer purchase basket, adoption rates, and purchase criteria
- Exhibits61: Chart on Market share By Geographical Landscape2023-2028 (%)
- Exhibits62: Data Table on Market share By Geographical Landscape2023-2028 (%)
- Exhibits63: Chart on Geographic comparison
- Exhibits64: Data Table on Geographic comparison
- Exhibits65: Chart on North America - Market size and forecast 2023-2028 ($ million)
- Exhibits66: Data Table on North America - Market size and forecast 2023-2028 ($ million)
- Exhibits67: Chart on North America - Year-over-year growth 2023-2028 (%)
- Exhibits68: Data Table on North America - Year-over-year growth 2023-2028 (%)
- Exhibits69: Chart on Europe - Market size and forecast 2023-2028 ($ million)
- Exhibits70: Data Table on Europe - Market size and forecast 2023-2028 ($ million)
- Exhibits71: Chart on Europe - Year-over-year growth 2023-2028 (%)
- Exhibits72: Data Table on Europe - Year-over-year growth 2023-2028 (%)
- Exhibits73: Chart on Asia - Market size and forecast 2023-2028 ($ million)
- Exhibits74: Data Table on Asia - Market size and forecast 2023-2028 ($ million)
- Exhibits75: Chart on Asia - Year-over-year growth 2023-2028 (%)
- Exhibits76: Data Table on Asia - Year-over-year growth 2023-2028 (%)
- Exhibits77: Chart on Rest of World (ROW) - Market size and forecast 2023-2028 ($ million)
- Exhibits78: Data Table on Rest of World (ROW) - Market size and forecast 2023-2028 ($ million)
- Exhibits79: Chart on Rest of World (ROW) - Year-over-year growth 2023-2028 (%)
- Exhibits80: Data Table on Rest of World (ROW) - Year-over-year growth 2023-2028 (%)
- Exhibits81: Chart on US - Market size and forecast 2023-2028 ($ million)
- Exhibits82: Data Table on US - Market size and forecast 2023-2028 ($ million)
- Exhibits83: Chart on US - Year-over-year growth 2023-2028 (%)
- Exhibits84: Data Table on US - Year-over-year growth 2023-2028 (%)
- Exhibits85: Chart on Germany - Market size and forecast 2023-2028 ($ million)
- Exhibits86: Data Table on Germany - Market size and forecast 2023-2028 ($ million)
- Exhibits87: Chart on Germany - Year-over-year growth 2023-2028 (%)
- Exhibits88: Data Table on Germany - Year-over-year growth 2023-2028 (%)
- Exhibits89: Chart on UK - Market size and forecast 2023-2028 ($ million)
- Exhibits90: Data Table on UK - Market size and forecast 2023-2028 ($ million)
- Exhibits91: Chart on UK - Year-over-year growth 2023-2028 (%)
- Exhibits92: Data Table on UK - Year-over-year growth 2023-2028 (%)
- Exhibits93: Chart on China - Market size and forecast 2023-2028 ($ million)
- Exhibits94: Data Table on China - Market size and forecast 2023-2028 ($ million)
- Exhibits95: Chart on China - Year-over-year growth 2023-2028 (%)
- Exhibits96: Data Table on China - Year-over-year growth 2023-2028 (%)
- Exhibits97: Chart on Japan - Market size and forecast 2023-2028 ($ million)
- Exhibits98: Data Table on Japan - Market size and forecast 2023-2028 ($ million)
- Exhibits99: Chart on Japan - Year-over-year growth 2023-2028 (%)
- Exhibits100: Data Table on Japan - Year-over-year growth 2023-2028 (%)
- Exhibits101: Market opportunity By Geographical Landscape($ million)
- Exhibits102: Data Tables on Market opportunity By Geographical Landscape($ million)
- Exhibits103: Impact of drivers and challenges in 2023 and 2028
- Exhibits104: Overview on criticality of inputs and factors of differentiation
- Exhibits105: Overview on factors of disruption
- Exhibits106: Impact of key risks on business
- Exhibits107: Companies covered
- Exhibits108: Matrix on companies position and classification
- Exhibits109: Bionik Laboratories Corp. - Overview
- Exhibits110: Bionik Laboratories Corp. - Product / Service
- Exhibits111: Bionik Laboratories Corp. - Key offerings
- Exhibits112: B Temia - Overview
- Exhibits113: B Temia - Product / Service
- Exhibits114: B Temia - Key offerings
- Exhibits115: Cyberdyne Inc. - Overview
- Exhibits116: Cyberdyne Inc. - Product / Service
- Exhibits117: Cyberdyne Inc. - Key offerings
- Exhibits118: DIH Group - Overview
- Exhibits119: DIH Group - Product / Service
- Exhibits120: DIH Group - Key offerings
- Exhibits121: Ekso Bionics Holdings Inc. - Overview
- Exhibits122: Ekso Bionics Holdings Inc. - Business segments
- Exhibits123: Ekso Bionics Holdings Inc. - Key offerings
- Exhibits124: Ekso Bionics Holdings Inc. - Segment focus
- Exhibits125: Exoatlet Global SA - Overview
- Exhibits126: Exoatlet Global SA - Product / Service
- Exhibits127: Exoatlet Global SA - Key offerings
- Exhibits128: GOGOA Mobility Robots SL - Overview
- Exhibits129: GOGOA Mobility Robots SL - Product / Service
- Exhibits130: GOGOA Mobility Robots SL - Key offerings
- Exhibits131: Ottobock SE and Co. KGaA - Overview
- Exhibits132: Ottobock SE and Co. KGaA - Product / Service
- Exhibits133: Ottobock SE and Co. KGaA - Key offerings
- Exhibits134: P and S Mechanics Co. Ltd. - Overview
- Exhibits135: P and S Mechanics Co. Ltd. - Product / Service
- Exhibits136: P and S Mechanics Co. Ltd. - Key offerings
- Exhibits137: Parker Hannifin Corp. - Overview
- Exhibits138: Parker Hannifin Corp. - Business segments
- Exhibits139: Parker Hannifin Corp. - Key news
- Exhibits140: Parker Hannifin Corp. - Key offerings
- Exhibits141: Parker Hannifin Corp. - Segment focus
- Exhibits142: ReWalk Robotics Ltd. - Overview
- Exhibits143: ReWalk Robotics Ltd. - Product / Service
- Exhibits144: ReWalk Robotics Ltd. - Key offerings
- Exhibits145: Rex Bionics Ltd. - Overview
- Exhibits146: Rex Bionics Ltd. - Product / Service
- Exhibits147: Rex Bionics Ltd. - Key offerings
- Exhibits148: Sarcos Technology and Robotics Corp. - Overview
- Exhibits149: Sarcos Technology and Robotics Corp. - Product / Service
- Exhibits150: Sarcos Technology and Robotics Corp. - Key offerings
- Exhibits151: Wandercraft - Overview
- Exhibits152: Wandercraft - Product / Service
- Exhibits153: Wandercraft - Key offerings
- Exhibits154: Wearable Robotics Srl - Overview
- Exhibits155: Wearable Robotics Srl - Product / Service
- Exhibits156: Wearable Robotics Srl - Key offerings
- Exhibits157: Inclusions checklist
- Exhibits158: Exclusions checklist
- Exhibits159: Currency conversion rates for US$
- Exhibits160: Research methodology
- Exhibits161: Information sources
- Exhibits162: Data validation
- Exhibits163: Validation techniques employed for market sizing
- Exhibits164: Data synthesis
- Exhibits165: 360 degree market analysis
- Exhibits166: List of abbreviations
The medical exoskeleton market is forecasted to grow by USD 2868.6 mn during 2023-2028, accelerating at a CAGR of 55.77% during the forecast period. The report on the medical exoskeleton market provides a holistic analysis, market size and forecast, trends, growth drivers, and challenges, as well as vendor analysis covering around 25 vendors.
The report offers an up-to-date analysis regarding the current market scenario, the latest trends and drivers, and the overall market environment. The market is driven by increasing incidences of scis, increasing usage of medical exoskeletons in rehabilitation, and increasing insurance coverage for medical exoskeleton.
Technavio's medical exoskeleton market is segmented as below:
| Market Scope | |
|---|---|
| Base Year | 2024 |
| End Year | 2028 |
| Series Year | 2024-2028 |
| Growth Momentum | Accelerate |
| YOY 2024 | 38.93% |
| CAGR | 55.77% |
| Incremental Value | $2868.6mn |
By Mobility Type
- Mobile exoskeleton
- Stationary exoskeleton
By Technology
- Powered exoskeletons
- Passive exoskeletons
By Geography
- North America
- Europe
- Asia
- Rest of World (ROW)
This study identifies the launch of technologically advanced products as one of the prime reasons driving the medical exoskeleton market growth during the next few years. Also, increasing focus on use of exoskeletons featuring existing and emerging technologies and focus on development of 3d-printed medical exoskeletons will lead to sizable demand in the market.
The report on the medical exoskeleton market covers the following areas:
- Medical exoskeleton market sizing
- Medical exoskeleton market forecast
- Medical exoskeleton market industry analysis
The robust vendor analysis is designed to help clients improve their market position, and in line with this, this report provides a detailed analysis of several leading medical exoskeleton market vendors that include Bionik Laboratories Corp., B Temia, Cyberdyne Inc., DIH Group, Ekso Bionics Holdings Inc., Exoatlet Global SA, Focal Meditech, GOGOA Mobility Robots SL, Honda Motor Co. Ltd., Marsi Bionics SL, MYOMO INC., Ottobock SE and Co. KGaA, P and S Mechanics Co. Ltd., Parker Hannifin Corp., Rehab Robotics Co. Ltd., ReWalk Robotics Ltd., Rex Bionics Ltd., Sarcos Technology and Robotics Corp., Wandercraft, and Wearable Robotics Srl. Also, the medical exoskeleton market analysis report includes information on upcoming trends and challenges that will influence market growth. This is to help companies strategize and leverage all forthcoming growth opportunities.
The study was conducted using an objective combination of primary and secondary information including inputs from key participants in the industry. The report contains a comprehensive market and vendor landscape in addition to an analysis of the key vendors.
The publisher presents a detailed picture of the market by the way of study, synthesis, and summation of data from multiple sources by an analysis of key parameters such as profit, pricing, competition, and promotions. It presents various market facets by identifying the key industry influencers. The data presented is comprehensive, reliable, and a result of extensive research - both primary and secondary. The market research reports provide a complete competitive landscape and an in-depth vendor selection methodology and analysis using qualitative and quantitative research to forecast the accurate market growth.
Table of Contents
1 Executive Summary
- 1.1 Market overview
- Executive Summary - Chart on Market Overview
- Executive Summary - Data Table on Market Overview
- Executive Summary - Chart on Global Market Characteristics
- Executive Summary - Chart on Market by Geography
- Executive Summary - Chart on Market Segmentation by Mobility Type
- Executive Summary - Chart on Market Segmentation by Technology
- Executive Summary - Chart on Incremental Growth
- Executive Summary - Data Table on Incremental Growth
- Executive Summary - Chart on Company Market Positioning
2 Market Landscape
- 2.1 Market ecosystem
- Parent Market
- Data Table on - Parent Market
- 2.2 Market characteristics
- Market characteristics analysis
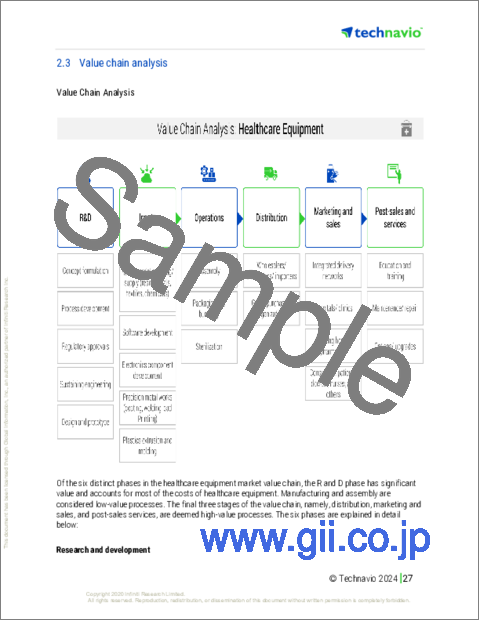
- 2.3 Value chain analysis
- Value Chain Analysis
3 Market Sizing
- 3.1 Market definition
- Offerings of companies included in the market definition
- 3.2 Market segment analysis
- Market segments
- 3.3 Market size 2023
- 3.4 Market outlook: Forecast for 2023-2028
- Chart on Global - Market size and forecast 2023-2028 ($ million)
- Data Table on Global - Market size and forecast 2023-2028 ($ million)
- Chart on Global Market: Year-over-year growth 2023-2028 (%)
- Data Table on Global Market: Year-over-year growth 2023-2028 (%)
4 Historic Market Size
- 4.1 Global Medical Exoskeleton Market 2018 - 2022
- Historic Market Size - Data Table on Global Medical Exoskeleton Market 2018 - 2022 ($ million)
- 4.2 Mobility Type segment analysis 2018 - 2022
- Historic Market Size - Mobility Type Segment 2018 - 2022 ($ million)
- 4.3 Technology segment analysis 2018 - 2022
- Historic Market Size - Technology Segment 2018 - 2022 ($ million)
- 4.4 Geography segment analysis 2018 - 2022
- Historic Market Size - Geography Segment 2018 - 2022 ($ million)
- 4.5 Country segment analysis 2018 - 2022
- Historic Market Size - Country Segment 2018 - 2022 ($ million)
5 Five Forces Analysis
- 5.1 Five forces summary
- Five forces analysis - Comparison between 2023 and 2028
- 5.2 Bargaining power of buyers
- Bargaining power of buyers - Impact of key factors 2023 and 2028
- 5.3 Bargaining power of suppliers
- Bargaining power of suppliers - Impact of key factors in 2023 and 2028
- 5.4 Threat of new entrants
- Threat of new entrants - Impact of key factors in 2023 and 2028
- 5.5 Threat of substitutes
- Threat of substitutes - Impact of key factors in 2023 and 2028
- 5.6 Threat of rivalry
- Threat of rivalry - Impact of key factors in 2023 and 2028
- 5.7 Market condition
- Chart on Market condition - Five forces 2023 and 2028
6 Market Segmentation by Mobility Type
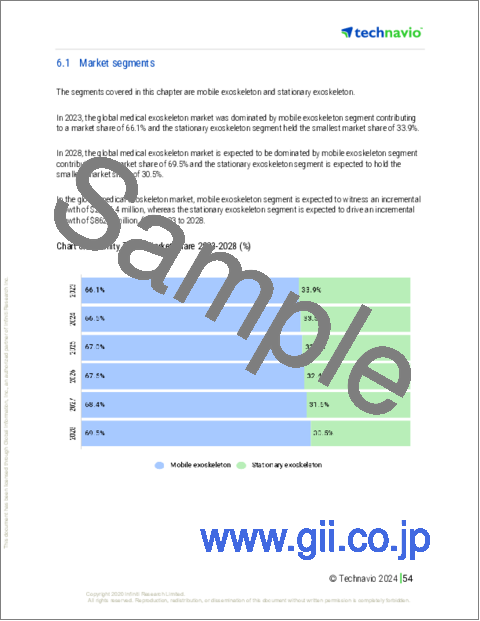
- 6.1 Market segments
- Chart on Mobility Type - Market share 2023-2028 (%)
- Data Table on Mobility Type - Market share 2023-2028 (%)
- 6.2 Comparison by Mobility Type
- Chart on Comparison by Mobility Type
- Data Table on Comparison by Mobility Type
- 6.3 Mobile exoskeleton - Market size and forecast 2023-2028
- Chart on Mobile exoskeleton - Market size and forecast 2023-2028 ($ million)
- Data Table on Mobile exoskeleton - Market size and forecast 2023-2028 ($ million)
- Chart on Mobile exoskeleton - Year-over-year growth 2023-2028 (%)
- Data Table on Mobile exoskeleton - Year-over-year growth 2023-2028 (%)
- 6.4 Stationary exoskeleton - Market size and forecast 2023-2028
- Chart on Stationary exoskeleton - Market size and forecast 2023-2028 ($ million)
- Data Table on Stationary exoskeleton - Market size and forecast 2023-2028 ($ million)
- Chart on Stationary exoskeleton - Year-over-year growth 2023-2028 (%)
- Data Table on Stationary exoskeleton - Year-over-year growth 2023-2028 (%)
- 6.5 Market opportunity by Mobility Type
- Market opportunity by Mobility Type ($ million)
- Data Table on Market opportunity by Mobility Type ($ million)
7 Market Segmentation by Technology
- 7.1 Market segments
- Chart on Technology - Market share 2023-2028 (%)
- Data Table on Technology - Market share 2023-2028 (%)
- 7.2 Comparison by Technology
- Chart on Comparison by Technology
- Data Table on Comparison by Technology
- 7.3 Powered exoskeletons - Market size and forecast 2023-2028
- Chart on Powered exoskeletons - Market size and forecast 2023-2028 ($ million)
- Data Table on Powered exoskeletons - Market size and forecast 2023-2028 ($ million)
- Chart on Powered exoskeletons - Year-over-year growth 2023-2028 (%)
- Data Table on Powered exoskeletons - Year-over-year growth 2023-2028 (%)
- 7.4 Passive exoskeletons - Market size and forecast 2023-2028
- Chart on Passive exoskeletons - Market size and forecast 2023-2028 ($ million)
- Data Table on Passive exoskeletons - Market size and forecast 2023-2028 ($ million)
- Chart on Passive exoskeletons - Year-over-year growth 2023-2028 (%)
- Data Table on Passive exoskeletons - Year-over-year growth 2023-2028 (%)
- 7.5 Market opportunity by Technology
- Market opportunity by Technology ($ million)
- Data Table on Market opportunity by Technology ($ million)
8 Customer Landscape
- 8.1 Customer landscape overview
- Analysis of price sensitivity, lifecycle, customer purchase basket, adoption rates, and purchase criteria
9 Geographic Landscape
- 9.1 Geographic segmentation
- Chart on Market share By Geographical Landscape2023-2028 (%)
- Data Table on Market share By Geographical Landscape2023-2028 (%)
- 9.2 Geographic comparison
- Chart on Geographic comparison
- Data Table on Geographic comparison
- 9.3 North America - Market size and forecast 2023-2028
- Chart on North America - Market size and forecast 2023-2028 ($ million)
- Data Table on North America - Market size and forecast 2023-2028 ($ million)
- Chart on North America - Year-over-year growth 2023-2028 (%)
- Data Table on North America - Year-over-year growth 2023-2028 (%)
- 9.4 Europe - Market size and forecast 2023-2028
- Chart on Europe - Market size and forecast 2023-2028 ($ million)
- Data Table on Europe - Market size and forecast 2023-2028 ($ million)
- Chart on Europe - Year-over-year growth 2023-2028 (%)
- Data Table on Europe - Year-over-year growth 2023-2028 (%)
- 9.5 Asia - Market size and forecast 2023-2028
- Chart on Asia - Market size and forecast 2023-2028 ($ million)
- Data Table on Asia - Market size and forecast 2023-2028 ($ million)
- Chart on Asia - Year-over-year growth 2023-2028 (%)
- Data Table on Asia - Year-over-year growth 2023-2028 (%)
- 9.6 Rest of World (ROW) - Market size and forecast 2023-2028
- Chart on Rest of World (ROW) - Market size and forecast 2023-2028 ($ million)
- Data Table on Rest of World (ROW) - Market size and forecast 2023-2028 ($ million)
- Chart on Rest of World (ROW) - Year-over-year growth 2023-2028 (%)
- Data Table on Rest of World (ROW) - Year-over-year growth 2023-2028 (%)
- 9.7 US - Market size and forecast 2023-2028
- Chart on US - Market size and forecast 2023-2028 ($ million)
- Data Table on US - Market size and forecast 2023-2028 ($ million)
- Chart on US - Year-over-year growth 2023-2028 (%)
- Data Table on US - Year-over-year growth 2023-2028 (%)
- 9.8 Germany - Market size and forecast 2023-2028
- Chart on Germany - Market size and forecast 2023-2028 ($ million)
- Data Table on Germany - Market size and forecast 2023-2028 ($ million)
- Chart on Germany - Year-over-year growth 2023-2028 (%)
- Data Table on Germany - Year-over-year growth 2023-2028 (%)
- 9.9 UK - Market size and forecast 2023-2028
- Chart on UK - Market size and forecast 2023-2028 ($ million)
- Data Table on UK - Market size and forecast 2023-2028 ($ million)
- Chart on UK - Year-over-year growth 2023-2028 (%)
- Data Table on UK - Year-over-year growth 2023-2028 (%)
- 9.10 China - Market size and forecast 2023-2028
- Chart on China - Market size and forecast 2023-2028 ($ million)
- Data Table on China - Market size and forecast 2023-2028 ($ million)
- Chart on China - Year-over-year growth 2023-2028 (%)
- Data Table on China - Year-over-year growth 2023-2028 (%)
- 9.11 Japan - Market size and forecast 2023-2028
- Chart on Japan - Market size and forecast 2023-2028 ($ million)
- Data Table on Japan - Market size and forecast 2023-2028 ($ million)
- Chart on Japan - Year-over-year growth 2023-2028 (%)
- Data Table on Japan - Year-over-year growth 2023-2028 (%)
- 9.12 Market opportunity by geography
- Market opportunity By Geographical Landscape($ million)
- Data Tables on Market opportunity By Geographical Landscape($ million)
10 Drivers, Challenges, and Opportunity/Restraints
- 10.1 Market drivers
- 10.2 Market challenges
- 10.3 Impact of drivers and challenges
- Impact of drivers and challenges in 2023 and 2028
- 10.4 Market opportunities/restraints
11 Competitive Landscape
- 11.1 Overview
- 11.2 Competitive Landscape
- Overview on criticality of inputs and factors of differentiation
- 11.3 Landscape disruption
- Overview on factors of disruption
- 11.4 Industry risks
- Impact of key risks on business
12 Competitive Analysis
- 12.1 Companies profiled
- Companies covered
- 12.2 Market positioning of companies
- Matrix on companies position and classification
- 12.3 Bionik Laboratories Corp.
- Bionik Laboratories Corp. - Overview
- Bionik Laboratories Corp. - Product / Service
- Bionik Laboratories Corp. - Key offerings
- 12.4 B Temia
- B Temia - Overview
- B Temia - Product / Service
- B Temia - Key offerings
- 12.5 Cyberdyne Inc.
- Cyberdyne Inc. - Overview
- Cyberdyne Inc. - Product / Service
- Cyberdyne Inc. - Key offerings
- 12.6 DIH Group
- DIH Group - Overview
- DIH Group - Product / Service
- DIH Group - Key offerings
- 12.7 Ekso Bionics Holdings Inc.
- Ekso Bionics Holdings Inc. - Overview
- Ekso Bionics Holdings Inc. - Business segments
- Ekso Bionics Holdings Inc. - Key offerings
- Ekso Bionics Holdings Inc. - Segment focus
- 12.8 Exoatlet Global SA
- Exoatlet Global SA - Overview
- Exoatlet Global SA - Product / Service
- Exoatlet Global SA - Key offerings
- 12.9 GOGOA Mobility Robots SL
- GOGOA Mobility Robots SL - Overview
- GOGOA Mobility Robots SL - Product / Service
- GOGOA Mobility Robots SL - Key offerings
- 12.10 Ottobock SE and Co. KGaA
- Ottobock SE and Co. KGaA - Overview
- Ottobock SE and Co. KGaA - Product / Service
- Ottobock SE and Co. KGaA - Key offerings
- 12.11 P and S Mechanics Co. Ltd.
- P and S Mechanics Co. Ltd. - Overview
- P and S Mechanics Co. Ltd. - Product / Service
- P and S Mechanics Co. Ltd. - Key offerings
- 12.12 Parker Hannifin Corp.
- Parker Hannifin Corp. - Overview
- Parker Hannifin Corp. - Business segments
- Parker Hannifin Corp. - Key news
- Parker Hannifin Corp. - Key offerings
- Parker Hannifin Corp. - Segment focus
- 12.13 ReWalk Robotics Ltd.
- ReWalk Robotics Ltd. - Overview
- ReWalk Robotics Ltd. - Product / Service
- ReWalk Robotics Ltd. - Key offerings
- 12.14 Rex Bionics Ltd.
- Rex Bionics Ltd. - Overview
- Rex Bionics Ltd. - Product / Service
- Rex Bionics Ltd. - Key offerings
- 12.15 Sarcos Technology and Robotics Corp.
- Sarcos Technology and Robotics Corp. - Overview
- Sarcos Technology and Robotics Corp. - Product / Service
- Sarcos Technology and Robotics Corp. - Key offerings
- 12.16 Wandercraft
- Wandercraft - Overview
- Wandercraft - Product / Service
- Wandercraft - Key offerings
- 12.17 Wearable Robotics Srl
- Wearable Robotics Srl - Overview
- Wearable Robotics Srl - Product / Service
- Wearable Robotics Srl - Key offerings
13 Appendix
- 13.1 Scope of the report
- 13.2 Inclusions and exclusions checklist
- Inclusions checklist
- Exclusions checklist
- 13.3 Currency conversion rates for US$
- Currency conversion rates for US$
- 13.4 Research methodology
- Research methodology
- 13.5 Data procurement
- Information sources
- 13.6 Data validation
- Data validation
- 13.7 Validation techniques employed for market sizing
- Validation techniques employed for market sizing
- 13.8 Data synthesis
- Data synthesis
- 13.9 360 degree market analysis
- 360 degree market analysis
- 13.10 List of abbreviations
- List of abbreviations
