|
|
市場調査レポート
商品コード
1645405
モバイルロボットプラットフォームの世界市場、2025-2029年Global Mobile Robot Platforms Market 2025-2029 |
||||||

|
|||||||
カスタマイズ可能
|
|||||||


| モバイルロボットプラットフォームの世界市場、2025-2029年 |
|
出版日: 2025年01月09日
発行: TechNavio
ページ情報: 英文 211 Pages
納期: 即納可能
|

全表示
- 概要
- 図表
- 目次
モバイルロボットプラットフォーム市場は2024-2029年に33億1,300万米ドル、予測期間中のCAGRは19%で成長すると予測されます。
当レポートでは、モバイルロボットプラットフォーム市場の全体的な分析、市場規模・予測、動向、成長促進要因、課題、約25のベンダーを網羅したベンダー分析などを掲載しています。
現在の市場シナリオ、最新動向と促進要因、市場環境全体に関する最新分析を提供しています。世界の労働力の変化、センサーの小型化、モバイルロボットプラットフォームの技術進歩が市場を牽引しています。
| 市場範囲 | |
|---|---|
| 基準年 | 2025 |
| 終了年 | 2029 |
| 予測期間 | 2025-2029 |
| 成長モメンタム | 加速 |
| 前年比2025年 | 15.5% |
| CAGR | 19% |
| 増分額 | 33億1,300万米ドル |
本調査では、今後数年間におけるモバイルロボットプラットフォーム市場の成長を促進する主な要因の1つとして、ハードウェア関連の欠点の削減に重点が置かれていることを挙げています。また、データ解析の採用とマシンビジョンシステムの改良の増加は、市場の大きな需要につながります。
目次
第1章 エグゼクティブサマリー
- 市場概要
第2章 Technavio分析
- 価格・ライフサイクル・顧客購入バスケット・採用率・購入基準の分析
- インプットの重要性と差別化の要因
- 混乱の要因
- 促進要因と課題の影響
第3章 市場情勢
- 市場エコシステム
- 市場の特徴
- バリューチェーン分析
第4章 市場規模
- 市場の定義
- 市場セグメント分析
- 市場規模 2024
- 市場の見通し 2024-2029
第5章 市場規模実績
- モバイルロボットプラットフォームの世界市場 2019-2023
- 製品セグメント分析 2019-2023
- エンドユーザーセグメント分析 2019-2023
- 地域別セグメント分析 2019-2023
- 国別セグメント分析 2019-2023
第6章 定性分析
- AIの影響:モバイルロボットプラットフォームの世界市場
第7章 ファイブフォース分析
- ファイブフォースの要約
- 買い手の交渉力
- 供給企業の交渉力
- 新規参入業者の脅威
- 代替品の脅威
- 競争の脅威
- 市況
第8章 市場セグメンテーション:製品別
- 市場セグメント
- 比較:製品別
- ソフトウェア:市場規模と予測 2024-2029
- サービス:市場規模と予測 2024-2029
- ハードウェア:市場規模と予測 2024-2029
- 市場機会:製品別
第9章 市場セグメンテーション:エンドユーザー別
- 市場セグメント
- 比較:エンドユーザー別
- 物流と倉庫:市場規模と予測 2024-2029
- 製造業:市場規模と予測 2024-2029
- 農業と鉱業:市場規模と予測 2024-2029
- 医療とヘルスケア:市場規模と予測 2024-2029
- その他:市場規模と予測 2024-2029
- 市場機会:エンドユーザー別
第10章 顧客情勢
- 顧客情勢の概要
第11章 地域別情勢
- 地域別セグメンテーション
- 地域別比較
- アジア太平洋:市場規模と予測 2024-2029
- 北米:市場規模と予測 2024-2029
- 欧州:市場規模と予測 2024-2029
- 中東・アフリカ:市場規模と予測 2024-2029
- 南米:市場規模と予測 2024-2029
- 米国:市場規模と予測 2024-2029
- 中国:市場規模と予測 2024-2029
- ドイツ:市場規模と予測 2024-2029
- 日本:市場規模と予測 2024-2029
- 韓国:市場規模と予測 2024-2029
- 英国:市場規模と予測 2024-2029
- カナダ:市場規模と予測 2024-2029
- ブラジル:市場規模と予測 2024-2029
- フランス:市場規模と予測 2024-2029
- サウジアラビア:市場規模と予測 2024-2029
- 市場機会:地域情勢別
第12章 促進要因・課題・機会・抑制要因
- 市場促進要因
- 市場の課題
- 促進要因と課題の影響
- 市場の機会・抑制要因
第13章 競合情勢
- 概要
- 競合情勢
- 混乱の状況
- 業界のリスク
第14章 競合分析
- 企業プロファイル
- 企業ランキング指数
- 企業の市場ポジショニング
- ABB Ltd.
- Amazon.com Inc.
- BlueBotics SA
- Boston Dynamics Inc.
- Clearpath Robotics Inc.
- Dematic Group
- KUKA AG
- Locus Robotics Corp.
- Mekatronix
- Mobile Industrial Robots AS
- Neobotix GmbH
- OMRON Corp.
- ROFA INDUSTRIAL AUTOMATION AG
- ST Engineering Aethon Inc.
- Yaskawa Electric Corp.
第15章 付録
Exhibits:
- Exhibits1: Executive Summary - Chart on Market Overview
- Exhibits2: Executive Summary - Data Table on Market Overview
- Exhibits3: Executive Summary - Chart on Global Market Characteristics
- Exhibits4: Executive Summary - Chart on Market By Geographical Landscape
- Exhibits5: Executive Summary - Chart on Market Segmentation by Product
- Exhibits6: Executive Summary - Chart on Market Segmentation by End-user
- Exhibits7: Executive Summary - Chart on Incremental Growth
- Exhibits8: Executive Summary - Data Table on Incremental Growth
- Exhibits9: Executive Summary - Chart on Company Market Positioning
- Exhibits10: Analysis of price sensitivity, lifecycle, customer purchase basket, adoption rates, and purchase criteria
- Exhibits11: Overview on criticality of inputs and factors of differentiation
- Exhibits12: Overview on factors of disruption
- Exhibits13: Impact of drivers and challenges in 2024 and 2029
- Exhibits14: Parent Market
- Exhibits15: Data Table on - Parent Market
- Exhibits16: Market characteristics analysis
- Exhibits17: Value chain analysis
- Exhibits18: Offerings of companies included in the market definition
- Exhibits19: Market segments
- Exhibits20: Chart on Global - Market size and forecast 2024-2029 ($ million)
- Exhibits21: Data Table on Global - Market size and forecast 2024-2029 ($ million)
- Exhibits22: Chart on Global Market: Year-over-year growth 2024-2029 (%)
- Exhibits23: Data Table on Global Market: Year-over-year growth 2024-2029 (%)
- Exhibits24: Historic Market Size - Data Table on Global Mobile Robot Platforms Market 2019 - 2023 ($ million)
- Exhibits25: Historic Market Size - Product Segment 2019 - 2023 ($ million)
- Exhibits26: Historic Market Size - End-user Segment 2019 - 2023 ($ million)
- Exhibits27: Historic Market Size - Geography Segment 2019 - 2023 ($ million)
- Exhibits28: Historic Market Size - Country Segment 2019 - 2023 ($ million)
- Exhibits29: Five forces analysis - Comparison between 2024 and 2029
- Exhibits30: Bargaining power of buyers - Impact of key factors 2024 and 2029
- Exhibits31: Bargaining power of suppliers - Impact of key factors in 2024 and 2029
- Exhibits32: Threat of new entrants - Impact of key factors in 2024 and 2029
- Exhibits33: Threat of substitutes - Impact of key factors in 2024 and 2029
- Exhibits34: Threat of rivalry - Impact of key factors in 2024 and 2029
- Exhibits35: Chart on Market condition - Five forces 2024 and 2029
- Exhibits36: Chart on Product - Market share 2024-2029 (%)
- Exhibits37: Data Table on Product - Market share 2024-2029 (%)
- Exhibits38: Chart on Comparison by Product
- Exhibits39: Data Table on Comparison by Product
- Exhibits40: Chart on Software - Market size and forecast 2024-2029 ($ million)
- Exhibits41: Data Table on Software - Market size and forecast 2024-2029 ($ million)
- Exhibits42: Chart on Software - Year-over-year growth 2024-2029 (%)
- Exhibits43: Data Table on Software - Year-over-year growth 2024-2029 (%)
- Exhibits44: Chart on Services - Market size and forecast 2024-2029 ($ million)
- Exhibits45: Data Table on Services - Market size and forecast 2024-2029 ($ million)
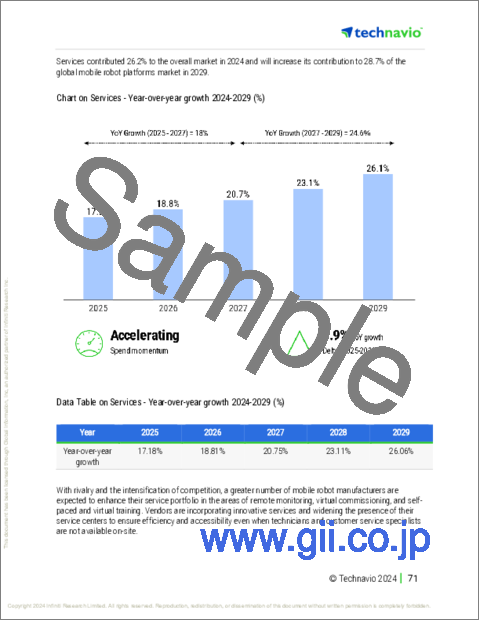
- Exhibits46: Chart on Services - Year-over-year growth 2024-2029 (%)
- Exhibits47: Data Table on Services - Year-over-year growth 2024-2029 (%)
- Exhibits48: Chart on Hardware - Market size and forecast 2024-2029 ($ million)
- Exhibits49: Data Table on Hardware - Market size and forecast 2024-2029 ($ million)
- Exhibits50: Chart on Hardware - Year-over-year growth 2024-2029 (%)
- Exhibits51: Data Table on Hardware - Year-over-year growth 2024-2029 (%)
- Exhibits52: Market opportunity by Product ($ million)
- Exhibits53: Data Table on Market opportunity by Product ($ million)
- Exhibits54: Chart on End-user - Market share 2024-2029 (%)
- Exhibits55: Data Table on End-user - Market share 2024-2029 (%)
- Exhibits56: Chart on Comparison by End-user
- Exhibits57: Data Table on Comparison by End-user
- Exhibits58: Chart on Logistics and warehousing - Market size and forecast 2024-2029 ($ million)
- Exhibits59: Data Table on Logistics and warehousing - Market size and forecast 2024-2029 ($ million)
- Exhibits60: Chart on Logistics and warehousing - Year-over-year growth 2024-2029 (%)
- Exhibits61: Data Table on Logistics and warehousing - Year-over-year growth 2024-2029 (%)
- Exhibits62: Chart on Manufacturing industries - Market size and forecast 2024-2029 ($ million)
- Exhibits63: Data Table on Manufacturing industries - Market size and forecast 2024-2029 ($ million)
- Exhibits64: Chart on Manufacturing industries - Year-over-year growth 2024-2029 (%)
- Exhibits65: Data Table on Manufacturing industries - Year-over-year growth 2024-2029 (%)
- Exhibits66: Chart on Agriculture and mining - Market size and forecast 2024-2029 ($ million)
- Exhibits67: Data Table on Agriculture and mining - Market size and forecast 2024-2029 ($ million)
- Exhibits68: Chart on Agriculture and mining - Year-over-year growth 2024-2029 (%)
- Exhibits69: Data Table on Agriculture and mining - Year-over-year growth 2024-2029 (%)
- Exhibits70: Chart on Medical and healthcare - Market size and forecast 2024-2029 ($ million)
- Exhibits71: Data Table on Medical and healthcare - Market size and forecast 2024-2029 ($ million)
- Exhibits72: Chart on Medical and healthcare - Year-over-year growth 2024-2029 (%)
- Exhibits73: Data Table on Medical and healthcare - Year-over-year growth 2024-2029 (%)
- Exhibits74: Chart on Others - Market size and forecast 2024-2029 ($ million)
- Exhibits75: Data Table on Others - Market size and forecast 2024-2029 ($ million)
- Exhibits76: Chart on Others - Year-over-year growth 2024-2029 (%)
- Exhibits77: Data Table on Others - Year-over-year growth 2024-2029 (%)
- Exhibits78: Market opportunity by End-user ($ million)
- Exhibits79: Data Table on Market opportunity by End-user ($ million)
- Exhibits80: Analysis of price sensitivity, lifecycle, customer purchase basket, adoption rates, and purchase criteria
- Exhibits81: Chart on Market share By Geographical Landscape 2024-2029 (%)
- Exhibits82: Data Table on Market share By Geographical Landscape 2024-2029 (%)
- Exhibits83: Chart on Geographic comparison
- Exhibits84: Data Table on Geographic comparison
- Exhibits85: Chart on APAC - Market size and forecast 2024-2029 ($ million)
- Exhibits86: Data Table on APAC - Market size and forecast 2024-2029 ($ million)
- Exhibits87: Chart on APAC - Year-over-year growth 2024-2029 (%)
- Exhibits88: Data Table on APAC - Year-over-year growth 2024-2029 (%)
- Exhibits89: Chart on North America - Market size and forecast 2024-2029 ($ million)
- Exhibits90: Data Table on North America - Market size and forecast 2024-2029 ($ million)
- Exhibits91: Chart on North America - Year-over-year growth 2024-2029 (%)
- Exhibits92: Data Table on North America - Year-over-year growth 2024-2029 (%)
- Exhibits93: Chart on Europe - Market size and forecast 2024-2029 ($ million)
- Exhibits94: Data Table on Europe - Market size and forecast 2024-2029 ($ million)
- Exhibits95: Chart on Europe - Year-over-year growth 2024-2029 (%)
- Exhibits96: Data Table on Europe - Year-over-year growth 2024-2029 (%)
- Exhibits97: Chart on Middle East and Africa - Market size and forecast 2024-2029 ($ million)
- Exhibits98: Data Table on Middle East and Africa - Market size and forecast 2024-2029 ($ million)
- Exhibits99: Chart on Middle East and Africa - Year-over-year growth 2024-2029 (%)
- Exhibits100: Data Table on Middle East and Africa - Year-over-year growth 2024-2029 (%)
- Exhibits101: Chart on South America - Market size and forecast 2024-2029 ($ million)
- Exhibits102: Data Table on South America - Market size and forecast 2024-2029 ($ million)
- Exhibits103: Chart on South America - Year-over-year growth 2024-2029 (%)
- Exhibits104: Data Table on South America - Year-over-year growth 2024-2029 (%)
- Exhibits105: Chart on US - Market size and forecast 2024-2029 ($ million)
- Exhibits106: Data Table on US - Market size and forecast 2024-2029 ($ million)
- Exhibits107: Chart on US - Year-over-year growth 2024-2029 (%)
- Exhibits108: Data Table on US - Year-over-year growth 2024-2029 (%)
- Exhibits109: Chart on China - Market size and forecast 2024-2029 ($ million)
- Exhibits110: Data Table on China - Market size and forecast 2024-2029 ($ million)
- Exhibits111: Chart on China - Year-over-year growth 2024-2029 (%)
- Exhibits112: Data Table on China - Year-over-year growth 2024-2029 (%)
- Exhibits113: Chart on Germany - Market size and forecast 2024-2029 ($ million)
- Exhibits114: Data Table on Germany - Market size and forecast 2024-2029 ($ million)
- Exhibits115: Chart on Germany - Year-over-year growth 2024-2029 (%)
- Exhibits116: Data Table on Germany - Year-over-year growth 2024-2029 (%)
- Exhibits117: Chart on Japan - Market size and forecast 2024-2029 ($ million)
- Exhibits118: Data Table on Japan - Market size and forecast 2024-2029 ($ million)
- Exhibits119: Chart on Japan - Year-over-year growth 2024-2029 (%)
- Exhibits120: Data Table on Japan - Year-over-year growth 2024-2029 (%)
- Exhibits121: Chart on South Korea - Market size and forecast 2024-2029 ($ million)
- Exhibits122: Data Table on South Korea - Market size and forecast 2024-2029 ($ million)
- Exhibits123: Chart on South Korea - Year-over-year growth 2024-2029 (%)
- Exhibits124: Data Table on South Korea - Year-over-year growth 2024-2029 (%)
- Exhibits125: Chart on UK - Market size and forecast 2024-2029 ($ million)
- Exhibits126: Data Table on UK - Market size and forecast 2024-2029 ($ million)
- Exhibits127: Chart on UK - Year-over-year growth 2024-2029 (%)
- Exhibits128: Data Table on UK - Year-over-year growth 2024-2029 (%)
- Exhibits129: Chart on Canada - Market size and forecast 2024-2029 ($ million)
- Exhibits130: Data Table on Canada - Market size and forecast 2024-2029 ($ million)
- Exhibits131: Chart on Canada - Year-over-year growth 2024-2029 (%)
- Exhibits132: Data Table on Canada - Year-over-year growth 2024-2029 (%)
- Exhibits133: Chart on Brazil - Market size and forecast 2024-2029 ($ million)
- Exhibits134: Data Table on Brazil - Market size and forecast 2024-2029 ($ million)
- Exhibits135: Chart on Brazil - Year-over-year growth 2024-2029 (%)
- Exhibits136: Data Table on Brazil - Year-over-year growth 2024-2029 (%)
- Exhibits137: Chart on France - Market size and forecast 2024-2029 ($ million)
- Exhibits138: Data Table on France - Market size and forecast 2024-2029 ($ million)
- Exhibits139: Chart on France - Year-over-year growth 2024-2029 (%)
- Exhibits140: Data Table on France - Year-over-year growth 2024-2029 (%)
- Exhibits141: Chart on Saudi Arabia - Market size and forecast 2024-2029 ($ million)
- Exhibits142: Data Table on Saudi Arabia - Market size and forecast 2024-2029 ($ million)
- Exhibits143: Chart on Saudi Arabia - Year-over-year growth 2024-2029 (%)
- Exhibits144: Data Table on Saudi Arabia - Year-over-year growth 2024-2029 (%)
- Exhibits145: Market opportunity By Geographical Landscape ($ million)
- Exhibits146: Data Tables on Market opportunity By Geographical Landscape ($ million)
- Exhibits147: Impact of drivers and challenges in 2024 and 2029
- Exhibits148: Overview on criticality of inputs and factors of differentiation
- Exhibits149: Overview on factors of disruption
- Exhibits150: Impact of key risks on business
- Exhibits151: Companies covered
- Exhibits152: Company ranking index
- Exhibits153: Matrix on companies position and classification
- Exhibits154: ABB Ltd. - Overview
- Exhibits155: ABB Ltd. - Business segments
- Exhibits156: ABB Ltd. - Key news
- Exhibits157: ABB Ltd. - Key offerings
- Exhibits158: ABB Ltd. - Segment focus
- Exhibits159: SWOT
- Exhibits160: Amazon.com Inc. - Overview
- Exhibits161: Amazon.com Inc. - Business segments
- Exhibits162: Amazon.com Inc. - Key news
- Exhibits163: Amazon.com Inc. - Key offerings
- Exhibits164: Amazon.com Inc. - Segment focus
- Exhibits165: SWOT
- Exhibits166: BlueBotics SA - Overview
- Exhibits167: BlueBotics SA - Product / Service
- Exhibits168: BlueBotics SA - Key offerings
- Exhibits169: SWOT
- Exhibits170: Boston Dynamics Inc. - Overview
- Exhibits171: Boston Dynamics Inc. - Product / Service
- Exhibits172: Boston Dynamics Inc. - Key offerings
- Exhibits173: SWOT
- Exhibits174: Clearpath Robotics Inc. - Overview
- Exhibits175: Clearpath Robotics Inc. - Product / Service
- Exhibits176: Clearpath Robotics Inc. - Key news
- Exhibits177: Clearpath Robotics Inc. - Key offerings
- Exhibits178: SWOT
- Exhibits179: Dematic Group - Overview
- Exhibits180: Dematic Group - Product / Service
- Exhibits181: Dematic Group - Key news
- Exhibits182: Dematic Group - Key offerings
- Exhibits183: SWOT
- Exhibits184: KUKA AG - Overview
- Exhibits185: KUKA AG - Business segments
- Exhibits186: KUKA AG - Key offerings
- Exhibits187: KUKA AG - Segment focus
- Exhibits188: SWOT
- Exhibits189: Locus Robotics Corp. - Overview
- Exhibits190: Locus Robotics Corp. - Product / Service
- Exhibits191: Locus Robotics Corp. - Key offerings
- Exhibits192: SWOT
- Exhibits193: Mekatronix - Overview
- Exhibits194: Mekatronix - Product / Service
- Exhibits195: Mekatronix - Key offerings
- Exhibits196: SWOT
- Exhibits197: Mobile Industrial Robots AS - Overview
- Exhibits198: Mobile Industrial Robots AS - Product / Service
- Exhibits199: Mobile Industrial Robots AS - Key offerings
- Exhibits200: SWOT
- Exhibits201: Neobotix GmbH - Overview
- Exhibits202: Neobotix GmbH - Product / Service
- Exhibits203: Neobotix GmbH - Key offerings
- Exhibits204: SWOT
- Exhibits205: OMRON Corp. - Overview
- Exhibits206: OMRON Corp. - Business segments
- Exhibits207: OMRON Corp. - Key news
- Exhibits208: OMRON Corp. - Key offerings
- Exhibits209: OMRON Corp. - Segment focus
- Exhibits210: SWOT
- Exhibits211: ROFA INDUSTRIAL AUTOMATION AG - Overview
- Exhibits212: ROFA INDUSTRIAL AUTOMATION AG - Product / Service
- Exhibits213: ROFA INDUSTRIAL AUTOMATION AG - Key offerings
- Exhibits214: SWOT
- Exhibits215: ST Engineering Aethon Inc. - Overview
- Exhibits216: ST Engineering Aethon Inc. - Product / Service
- Exhibits217: ST Engineering Aethon Inc. - Key offerings
- Exhibits218: SWOT
- Exhibits219: Yaskawa Electric Corp. - Overview
- Exhibits220: Yaskawa Electric Corp. - Business segments
- Exhibits221: Yaskawa Electric Corp. - Key news
- Exhibits222: Yaskawa Electric Corp. - Key offerings
- Exhibits223: Yaskawa Electric Corp. - Segment focus
- Exhibits224: SWOT
- Exhibits225: Inclusions checklist
- Exhibits226: Exclusions checklist
- Exhibits227: Currency conversion rates for US$
- Exhibits228: Research methodology
- Exhibits229: Information sources
- Exhibits230: Data validation
- Exhibits231: Validation techniques employed for market sizing
- Exhibits232: Data synthesis
- Exhibits233: 360 degree market analysis
- Exhibits234: List of abbreviations
The mobile robot platforms market is forecasted to grow by USD 3313 mn during 2024-2029, accelerating at a CAGR of 19% during the forecast period. The report on the mobile robot platforms market provides a holistic analysis, market size and forecast, trends, growth drivers, and challenges, as well as vendor analysis covering around 25 vendors.
The report offers an up-to-date analysis regarding the current market scenario, the latest trends and drivers, and the overall market environment. The market is driven by changes in global labor force, miniaturization of sensors, and technological advances in mobile robot platforms.
| Market Scope | |
|---|---|
| Base Year | 2025 |
| End Year | 2029 |
| Series Year | 2025-2029 |
| Growth Momentum | Accelerate |
| YOY 2025 | 15.5% |
| CAGR | 19% |
| Incremental Value | $3313 mn |
Technavio's mobile robot platforms market is segmented as below:
By Product
- Software
- Services
- Hardware
By End-user
- Logistics and warehousing
- Manufacturing industries
- Agriculture and mining
- Medical and healthcare
- Others
By Geographical Landscape
- APAC
- North America
- Europe
- Middle East and Africa
- South America
This study identifies the increased emphasis on reducing hardware-related drawbacks as one of the prime reasons driving the mobile robot platforms market growth during the next few years. Also, increase in adoption of data analytics and improvements in machine vision systems will lead to sizable demand in the market.
The report on the mobile robot platforms market covers the following areas:
- Mobile Robot Platforms Market sizing
- Mobile Robot Platforms Market forecast
- Mobile Robot Platforms Market industry analysis
The robust vendor analysis is designed to help clients improve their market position, and in line with this, this report provides a detailed analysis of several leading mobile robot platforms market vendors that include ABB Ltd., Amazon.com Inc., BlueBotics SA, Boston Dynamics Inc., Clearpath Robotics Inc., Dematic Group, Irobot Corp., KUKA AG, Locus Robotics Corp., Mekatronix, Mobile Industrial Robots AS, Neobotix GmbH, OMRON Corp., Robotnik Automation SLL, ROFA INDUSTRIAL AUTOMATION AG, SoftBank Robotics Group Corp., ST Engineering Aethon Inc., and Yaskawa Electric Corp.. Also, the mobile robot platforms market analysis report includes information on upcoming trends and challenges that will influence market growth. This is to help companies strategize and leverage all forthcoming growth opportunities.
The study was conducted using an objective combination of primary and secondary information including inputs from key participants in the industry. The report contains a comprehensive market and vendor landscape in addition to an analysis of the key vendors.
The publisher presents a detailed picture of the market by the way of study, synthesis, and summation of data from multiple sources by an analysis of key parameters such as profit, pricing, competition, and promotions. It presents various market facets by identifying the key industry influencers. The data presented is comprehensive, reliable, and a result of extensive primary and secondary research. The market research reports provide a complete competitive landscape and an in-depth vendor selection methodology and analysis using qualitative and quantitative research to forecast accurate market growth.
Table of Contents
1 Executive Summary
- 1.1 Market overview
- Executive Summary - Chart on Market Overview
- Executive Summary - Data Table on Market Overview
- Executive Summary - Chart on Global Market Characteristics
- Executive Summary - Chart on Market By Geographical Landscape
- Executive Summary - Chart on Market Segmentation by Product
- Executive Summary - Chart on Market Segmentation by End-user
- Executive Summary - Chart on Incremental Growth
- Executive Summary - Data Table on Incremental Growth
- Executive Summary - Chart on Company Market Positioning
2 Technavio Analysis
- 2.1 Analysis of price sensitivity, lifecycle, customer purchase basket, adoption rates, and purchase criteria
- Analysis of price sensitivity, lifecycle, customer purchase basket, adoption rates, and purchase criteria
- 2.2 Criticality of inputs and Factors of differentiation
- Overview on criticality of inputs and factors of differentiation
- 2.3 Factors of disruption
- Overview on factors of disruption
- 2.4 Impact of drivers and challenges
- Impact of drivers and challenges in 2024 and 2029
3 Market Landscape
- 3.1 Market ecosystem
- Parent Market
- Data Table on - Parent Market
- 3.2 Market characteristics
- Market characteristics analysis
- 3.3 Value chain analysis
- Value chain analysis
4 Market Sizing
- 4.1 Market definition
- Offerings of companies included in the market definition
- 4.2 Market segment analysis
- Market segments
- 4.3 Market size 2024
- 4.4 Market outlook: Forecast for 2024-2029
- Chart on Global - Market size and forecast 2024-2029 ($ million)
- Data Table on Global - Market size and forecast 2024-2029 ($ million)
- Chart on Global Market: Year-over-year growth 2024-2029 (%)
- Data Table on Global Market: Year-over-year growth 2024-2029 (%)
5 Historic Market Size
- 5.1 Global Mobile Robot Platforms Market 2019 - 2023
- Historic Market Size - Data Table on Global Mobile Robot Platforms Market 2019 - 2023 ($ million)
- 5.2 Product segment analysis 2019 - 2023
- Historic Market Size - Product Segment 2019 - 2023 ($ million)
- 5.3 End-user segment analysis 2019 - 2023
- Historic Market Size - End-user Segment 2019 - 2023 ($ million)
- 5.4 Geography segment analysis 2019 - 2023
- Historic Market Size - Geography Segment 2019 - 2023 ($ million)
- 5.5 Country segment analysis 2019 - 2023
- Historic Market Size - Country Segment 2019 - 2023 ($ million)
6 Qualitative Analysis
- 6.1 The AI Impact on Global Mobile Robot Platforms market
7 Five Forces Analysis
- 7.1 Five forces summary
- Five forces analysis - Comparison between 2024 and 2029
- 7.2 Bargaining power of buyers
- Bargaining power of buyers - Impact of key factors 2024 and 2029
- 7.3 Bargaining power of suppliers
- Bargaining power of suppliers - Impact of key factors in 2024 and 2029
- 7.4 Threat of new entrants
- Threat of new entrants - Impact of key factors in 2024 and 2029
- 7.5 Threat of substitutes
- Threat of substitutes - Impact of key factors in 2024 and 2029
- 7.6 Threat of rivalry
- Threat of rivalry - Impact of key factors in 2024 and 2029
- 7.7 Market condition
- Chart on Market condition - Five forces 2024 and 2029
8 Market Segmentation by Product
- 8.1 Market segments
- Chart on Product - Market share 2024-2029 (%)
- Data Table on Product - Market share 2024-2029 (%)
- 8.2 Comparison by Product
- Chart on Comparison by Product
- Data Table on Comparison by Product
- 8.3 Software - Market size and forecast 2024-2029
- Chart on Software - Market size and forecast 2024-2029 ($ million)
- Data Table on Software - Market size and forecast 2024-2029 ($ million)
- Chart on Software - Year-over-year growth 2024-2029 (%)
- Data Table on Software - Year-over-year growth 2024-2029 (%)
- 8.4 Services - Market size and forecast 2024-2029
- Chart on Services - Market size and forecast 2024-2029 ($ million)
- Data Table on Services - Market size and forecast 2024-2029 ($ million)
- Chart on Services - Year-over-year growth 2024-2029 (%)
- Data Table on Services - Year-over-year growth 2024-2029 (%)
- 8.5 Hardware - Market size and forecast 2024-2029
- Chart on Hardware - Market size and forecast 2024-2029 ($ million)
- Data Table on Hardware - Market size and forecast 2024-2029 ($ million)
- Chart on Hardware - Year-over-year growth 2024-2029 (%)
- Data Table on Hardware - Year-over-year growth 2024-2029 (%)
- 8.6 Market opportunity by Product
- Market opportunity by Product ($ million)
- Data Table on Market opportunity by Product ($ million)
9 Market Segmentation by End-user
- 9.1 Market segments
- Chart on End-user - Market share 2024-2029 (%)
- Data Table on End-user - Market share 2024-2029 (%)
- 9.2 Comparison by End-user
- Chart on Comparison by End-user
- Data Table on Comparison by End-user
- 9.3 Logistics and warehousing - Market size and forecast 2024-2029
- Chart on Logistics and warehousing - Market size and forecast 2024-2029 ($ million)
- Data Table on Logistics and warehousing - Market size and forecast 2024-2029 ($ million)
- Chart on Logistics and warehousing - Year-over-year growth 2024-2029 (%)
- Data Table on Logistics and warehousing - Year-over-year growth 2024-2029 (%)
- 9.4 Manufacturing industries - Market size and forecast 2024-2029
- Chart on Manufacturing industries - Market size and forecast 2024-2029 ($ million)
- Data Table on Manufacturing industries - Market size and forecast 2024-2029 ($ million)
- Chart on Manufacturing industries - Year-over-year growth 2024-2029 (%)
- Data Table on Manufacturing industries - Year-over-year growth 2024-2029 (%)
- 9.5 Agriculture and mining - Market size and forecast 2024-2029
- Chart on Agriculture and mining - Market size and forecast 2024-2029 ($ million)
- Data Table on Agriculture and mining - Market size and forecast 2024-2029 ($ million)
- Chart on Agriculture and mining - Year-over-year growth 2024-2029 (%)
- Data Table on Agriculture and mining - Year-over-year growth 2024-2029 (%)
- 9.6 Medical and healthcare - Market size and forecast 2024-2029
- Chart on Medical and healthcare - Market size and forecast 2024-2029 ($ million)
- Data Table on Medical and healthcare - Market size and forecast 2024-2029 ($ million)
- Chart on Medical and healthcare - Year-over-year growth 2024-2029 (%)
- Data Table on Medical and healthcare - Year-over-year growth 2024-2029 (%)
- 9.7 Others - Market size and forecast 2024-2029
- Chart on Others - Market size and forecast 2024-2029 ($ million)
- Data Table on Others - Market size and forecast 2024-2029 ($ million)
- Chart on Others - Year-over-year growth 2024-2029 (%)
- Data Table on Others - Year-over-year growth 2024-2029 (%)
- 9.8 Market opportunity by End-user
- Market opportunity by End-user ($ million)
- Data Table on Market opportunity by End-user ($ million)
10 Customer Landscape
- 10.1 Customer landscape overview
- Analysis of price sensitivity, lifecycle, customer purchase basket, adoption rates, and purchase criteria
11 Geographic Landscape
- 11.1 Geographic segmentation
- Chart on Market share By Geographical Landscape 2024-2029 (%)
- Data Table on Market share By Geographical Landscape 2024-2029 (%)
- 11.2 Geographic comparison
- Chart on Geographic comparison
- Data Table on Geographic comparison
- 11.3 APAC - Market size and forecast 2024-2029
- Chart on APAC - Market size and forecast 2024-2029 ($ million)
- Data Table on APAC - Market size and forecast 2024-2029 ($ million)
- Chart on APAC - Year-over-year growth 2024-2029 (%)
- Data Table on APAC - Year-over-year growth 2024-2029 (%)
- 11.4 North America - Market size and forecast 2024-2029
- Chart on North America - Market size and forecast 2024-2029 ($ million)
- Data Table on North America - Market size and forecast 2024-2029 ($ million)
- Chart on North America - Year-over-year growth 2024-2029 (%)
- Data Table on North America - Year-over-year growth 2024-2029 (%)
- 11.5 Europe - Market size and forecast 2024-2029
- Chart on Europe - Market size and forecast 2024-2029 ($ million)
- Data Table on Europe - Market size and forecast 2024-2029 ($ million)
- Chart on Europe - Year-over-year growth 2024-2029 (%)
- Data Table on Europe - Year-over-year growth 2024-2029 (%)
- 11.6 Middle East and Africa - Market size and forecast 2024-2029
- Chart on Middle East and Africa - Market size and forecast 2024-2029 ($ million)
- Data Table on Middle East and Africa - Market size and forecast 2024-2029 ($ million)
- Chart on Middle East and Africa - Year-over-year growth 2024-2029 (%)
- Data Table on Middle East and Africa - Year-over-year growth 2024-2029 (%)
- 11.7 South America - Market size and forecast 2024-2029
- Chart on South America - Market size and forecast 2024-2029 ($ million)
- Data Table on South America - Market size and forecast 2024-2029 ($ million)
- Chart on South America - Year-over-year growth 2024-2029 (%)
- Data Table on South America - Year-over-year growth 2024-2029 (%)
- 11.8 US - Market size and forecast 2024-2029
- Chart on US - Market size and forecast 2024-2029 ($ million)
- Data Table on US - Market size and forecast 2024-2029 ($ million)
- Chart on US - Year-over-year growth 2024-2029 (%)
- Data Table on US - Year-over-year growth 2024-2029 (%)
- 11.9 China - Market size and forecast 2024-2029
- Chart on China - Market size and forecast 2024-2029 ($ million)
- Data Table on China - Market size and forecast 2024-2029 ($ million)
- Chart on China - Year-over-year growth 2024-2029 (%)
- Data Table on China - Year-over-year growth 2024-2029 (%)
- 11.10 Germany - Market size and forecast 2024-2029
- Chart on Germany - Market size and forecast 2024-2029 ($ million)
- Data Table on Germany - Market size and forecast 2024-2029 ($ million)
- Chart on Germany - Year-over-year growth 2024-2029 (%)
- Data Table on Germany - Year-over-year growth 2024-2029 (%)
- 11.11 Japan - Market size and forecast 2024-2029
- Chart on Japan - Market size and forecast 2024-2029 ($ million)
- Data Table on Japan - Market size and forecast 2024-2029 ($ million)
- Chart on Japan - Year-over-year growth 2024-2029 (%)
- Data Table on Japan - Year-over-year growth 2024-2029 (%)
- 11.12 South Korea - Market size and forecast 2024-2029
- Chart on South Korea - Market size and forecast 2024-2029 ($ million)
- Data Table on South Korea - Market size and forecast 2024-2029 ($ million)
- Chart on South Korea - Year-over-year growth 2024-2029 (%)
- Data Table on South Korea - Year-over-year growth 2024-2029 (%)
- 11.13 UK - Market size and forecast 2024-2029
- Chart on UK - Market size and forecast 2024-2029 ($ million)
- Data Table on UK - Market size and forecast 2024-2029 ($ million)
- Chart on UK - Year-over-year growth 2024-2029 (%)
- Data Table on UK - Year-over-year growth 2024-2029 (%)
- 11.14 Canada - Market size and forecast 2024-2029
- Chart on Canada - Market size and forecast 2024-2029 ($ million)
- Data Table on Canada - Market size and forecast 2024-2029 ($ million)
- Chart on Canada - Year-over-year growth 2024-2029 (%)
- Data Table on Canada - Year-over-year growth 2024-2029 (%)
- 11.15 Brazil - Market size and forecast 2024-2029
- Chart on Brazil - Market size and forecast 2024-2029 ($ million)
- Data Table on Brazil - Market size and forecast 2024-2029 ($ million)
- Chart on Brazil - Year-over-year growth 2024-2029 (%)
- Data Table on Brazil - Year-over-year growth 2024-2029 (%)
- 11.16 France - Market size and forecast 2024-2029
- Chart on France - Market size and forecast 2024-2029 ($ million)
- Data Table on France - Market size and forecast 2024-2029 ($ million)
- Chart on France - Year-over-year growth 2024-2029 (%)
- Data Table on France - Year-over-year growth 2024-2029 (%)
- 11.17 Saudi Arabia - Market size and forecast 2024-2029
- Chart on Saudi Arabia - Market size and forecast 2024-2029 ($ million)
- Data Table on Saudi Arabia - Market size and forecast 2024-2029 ($ million)
- Chart on Saudi Arabia - Year-over-year growth 2024-2029 (%)
- Data Table on Saudi Arabia - Year-over-year growth 2024-2029 (%)
- 11.18 Market opportunity By Geographical Landscape
- Market opportunity By Geographical Landscape ($ million)
- Data Tables on Market opportunity By Geographical Landscape ($ million)
12 Drivers, Challenges, and Opportunity/Restraints
- 12.1 Market drivers
- 12.2 Market challenges
- 12.3 Impact of drivers and challenges
- Impact of drivers and challenges in 2024 and 2029
- 12.4 Market opportunities/restraints
13 Competitive Landscape
- 13.1 Overview
- 13.2 Competitive Landscape
- Overview on criticality of inputs and factors of differentiation
- 13.3 Landscape disruption
- Overview on factors of disruption
- 13.4 Industry risks
- Impact of key risks on business
14 Competitive Analysis
- 14.1 Companies profiled
- Companies covered
- 14.2 Company ranking index
- Company ranking index
- 14.3 Market positioning of companies
- Matrix on companies position and classification
- 14.4 ABB Ltd.
- ABB Ltd. - Overview
- ABB Ltd. - Business segments
- ABB Ltd. - Key news
- ABB Ltd. - Key offerings
- ABB Ltd. - Segment focus
- SWOT
- 14.5 Amazon.com Inc.
- Amazon.com Inc. - Overview
- Amazon.com Inc. - Business segments
- Amazon.com Inc. - Key news
- Amazon.com Inc. - Key offerings
- Amazon.com Inc. - Segment focus
- SWOT
- 14.6 BlueBotics SA
- BlueBotics SA - Overview
- BlueBotics SA - Product / Service
- BlueBotics SA - Key offerings
- SWOT
- 14.7 Boston Dynamics Inc.
- Boston Dynamics Inc. - Overview
- Boston Dynamics Inc. - Product / Service
- Boston Dynamics Inc. - Key offerings
- SWOT
- 14.8 Clearpath Robotics Inc.
- Clearpath Robotics Inc. - Overview
- Clearpath Robotics Inc. - Product / Service
- Clearpath Robotics Inc. - Key news
- Clearpath Robotics Inc. - Key offerings
- SWOT
- 14.9 Dematic Group
- Dematic Group - Overview
- Dematic Group - Product / Service
- Dematic Group - Key news
- Dematic Group - Key offerings
- SWOT
- 14.10 KUKA AG
- KUKA AG - Overview
- KUKA AG - Business segments
- KUKA AG - Key offerings
- KUKA AG - Segment focus
- SWOT
- 14.11 Locus Robotics Corp.
- Locus Robotics Corp. - Overview
- Locus Robotics Corp. - Product / Service
- Locus Robotics Corp. - Key offerings
- SWOT
- 14.12 Mekatronix
- Mekatronix - Overview
- Mekatronix - Product / Service
- Mekatronix - Key offerings
- SWOT
- 14.13 Mobile Industrial Robots AS
- Mobile Industrial Robots AS - Overview
- Mobile Industrial Robots AS - Product / Service
- Mobile Industrial Robots AS - Key offerings
- SWOT
- 14.14 Neobotix GmbH
- Neobotix GmbH - Overview
- Neobotix GmbH - Product / Service
- Neobotix GmbH - Key offerings
- SWOT
- 14.15 OMRON Corp.
- OMRON Corp. - Overview
- OMRON Corp. - Business segments
- OMRON Corp. - Key news
- OMRON Corp. - Key offerings
- OMRON Corp. - Segment focus
- SWOT
- 14.16 ROFA INDUSTRIAL AUTOMATION AG
- ROFA INDUSTRIAL AUTOMATION AG - Overview
- ROFA INDUSTRIAL AUTOMATION AG - Product / Service
- ROFA INDUSTRIAL AUTOMATION AG - Key offerings
- SWOT
- 14.17 ST Engineering Aethon Inc.
- ST Engineering Aethon Inc. - Overview
- ST Engineering Aethon Inc. - Product / Service
- ST Engineering Aethon Inc. - Key offerings
- SWOT
- 14.18 Yaskawa Electric Corp.
- Yaskawa Electric Corp. - Overview
- Yaskawa Electric Corp. - Business segments
- Yaskawa Electric Corp. - Key news
- Yaskawa Electric Corp. - Key offerings
- Yaskawa Electric Corp. - Segment focus
- SWOT
15 Appendix
- 15.1 Scope of the report
- 15.2 Inclusions and exclusions checklist
- Inclusions checklist
- Exclusions checklist
- 15.3 Currency conversion rates for US$
- Currency conversion rates for US$
- 15.4 Research methodology
- Research methodology
- 15.5 Data procurement
- Information sources
- 15.6 Data validation
- Data validation
- 15.7 Validation techniques employed for market sizing
- Validation techniques employed for market sizing
- 15.8 Data synthesis
- Data synthesis
- 15.9 360 degree market analysis
- 360 degree market analysis
- 15.10 List of abbreviations
- List of abbreviations

