|
|
市場調査レポート
商品コード
1502478
ラプチャーディスクの世界市場 2024-2028Global rupture disc market 2024-2028 |
||||||

|
|||||||
カスタマイズ可能
|
|||||||

| ラプチャーディスクの世界市場 2024-2028 |
|
出版日: 2024年05月16日
発行: TechNavio
ページ情報: 英文 184 Pages
納期: 即納可能
|

全表示
- 概要
- 図表
- 目次
Technavio社は、ラプチャーディスク市場をモニターしており、2023年から2028年にかけて8,690万米ドル、予測期間中のCAGRは2.83%で成長すると予測しています。
当レポートでは、ラプチャーディスク市場の全体的な分析、市場規模・予測、動向、成長促進要因、課題、約25のベンダーを網羅したベンダー分析などを掲載しています。
現在の市場シナリオ、最新動向と促進要因、市場環境全体に関する最新分析を提供しています。同市場は、即効性のあるリリーフ装置への需要の高まり、高粘性液体への対応能力、上下水道処理産業の重要性の高まりによって牽引されています。
| 市場範囲 | |
|---|---|
| 基準年 | 2024 |
| 終了年 | 2028 |
| 予測期間 | 2024-2028 |
| 成長モメンタム | 加速 |
| 前年比2024年 | 2.72% |
| CAGR | 2.83% |
| 増分額 | 8,690万米ドル |
本調査では、ラプチャーディスクの小型化が今後数年間のラプチャーディスク市場成長を牽引する主要因の1つであるとしています。また、双方向ラプチャーディスクの市場開発と様々なエンドユーザー産業からの圧力容器需要の増加が市場の大きな需要につながります。
目次
第1章 エグゼクティブサマリー
- 市場概要
第2章 市場情勢
- 市場エコシステム
- 市場の特徴
- バリューチェーン分析
第3章 市場規模の評価
- 市場の定義
- 市場セグメント分析
- 市場規模 2023
- 市場の見通し 2023-2028
第4章 市場規模実績
- 世界ラプチャーディスク市場 2018-2022
- 用途別セグメント分析 2018-2022
- 製品別セグメント分析 2018-2022
- エンドユーザー別セグメント分析 2018-2022
- 地域別セグメント分析 2018-2022
- 国別セグメント分析 2018-2022
第5章 ファイブフォース分析
- ファイブフォースの要約
- 買い手の交渉力
- 供給企業の交渉力
- 新規参入業者の脅威
- 代替品の脅威
- 競争の脅威
- 市況
第6章 市場セグメンテーション:用途別
- 市場セグメンテーション
- 比較:用途別
- スタンドアロンラプチャーディスク:市場規模と予測 2023-2028
- ラプチャーディスクリリーフバルブとの組み合わせ:市場規模と予測 2023-2028
- 市場機会:用途別
第7章 市場セグメンテーション:製品別
- 市場セグメンテーション
- 比較:製品別
- メタリックラプチャーディスク:市場規模と予測 2023-2028
- グラファイトラプチャーディスク:市場規模と予測 2023-2028
- 市場機会:製品別
第8章 市場セグメンテーション:エンドユーザー別
- 市場セグメンテーション
- 比較:エンドユーザー別
- エネルギー:市場規模と予測 2023-2028
- 加工産業:市場規模と予測 2023-2028
- 交通機関:市場規模と予測 2023-2028
- その他:市場規模と予測 2023-2028
- 市場機会:エンドユーザー別
第9章 顧客情勢
- 顧客情勢の概要
第10章 地域別情勢
- 地域別セグメンテーション
- 地域別比較
- アジア太平洋:市場規模と予測 2023-2028
- 欧州:市場規模と予測 2023-2028
- 北米:市場規模と予測 2023-2028
- 南米:市場規模と予測 2023-2028
- 中東・アフリカ:市場規模と予測 2023-2028
- 米国:市場規模と予測 2023-2028
- 中国:市場規模と予測 2023-2028
- ドイツ:市場規模と予測 2023-2028
- 日本:市場規模と予測 2023-2028
- 英国:市場規模と予測 2023-2028
- 市場機会:地域情勢別
第11章 促進要因・課題・機会・抑制要因
- 市場促進要因
- 市場の課題
- 促進要因と課題の影響
- 市場の機会・抑制要因
第12章 競合情勢
- 概要
- 競合情勢
- 混乱の状況
- 業界のリスク
第13章 競合分析
- 企業プロファイル
- 企業の市場ポジショニング
- BS and B Innovations Ltd.
- Continental Disc Corp.
- DonadonSDD Srl
- Emerson Electric Co.
- Fike Corp.
- Graco Inc.
- Halma Plc
- Heleon Group BV
- Leser GmbH and Co. KG
- Mersen Corporate Services SAS
- Parker Hannifin Corp.
- Parr Instrument Co.
- SGL Carbon SE
- V TEX Corp.
- Wolff Group
第14章 付録
Exhibits:
- Exhibits1: Executive Summary - Chart on Market Overview
- Exhibits2: Executive Summary - Data Table on Market Overview
- Exhibits3: Executive Summary - Chart on Global Market Characteristics
- Exhibits4: Executive Summary - Chart on Market By Geographical Landscape
- Exhibits5: Executive Summary - Chart on Market Segmentation by Application
- Exhibits6: Executive Summary - Chart on Market Segmentation by Product
- Exhibits7: Executive Summary - Chart on Market Segmentation by End-user
- Exhibits8: Executive Summary - Chart on Incremental Growth
- Exhibits9: Executive Summary - Data Table on Incremental Growth
- Exhibits10: Executive Summary - Chart on Company Market Positioning
- Exhibits11: Parent Market
- Exhibits12: Data Table on - Parent Market
- Exhibits13: Market characteristics analysis
- Exhibits14: Value Chain Analysis
- Exhibits15: Offerings of companies included in the market definition
- Exhibits16: Market segments
- Exhibits17: Chart on Global - Market size and forecast 2023-2028 ($ million)
- Exhibits18: Data Table on Global - Market size and forecast 2023-2028 ($ million)
- Exhibits19: Chart on Global Market: Year-over-year growth 2023-2028 (%)
- Exhibits20: Data Table on Global Market: Year-over-year growth 2023-2028 (%)
- Exhibits21: Historic Market Size - Data Table on Global Rupture Disc Market 2018 - 2022 ($ million)
- Exhibits22: Historic Market Size - Application Segment 2018 - 2022 ($ million)
- Exhibits23: Historic Market Size - Product Segment 2018 - 2022 ($ million)
- Exhibits24: Historic Market Size - End-user Segment 2018 - 2022 ($ million)
- Exhibits25: Historic Market Size - Geography Segment 2018 - 2022 ($ million)
- Exhibits26: Historic Market Size - Country Segment 2018 - 2022 ($ million)
- Exhibits27: Five forces analysis - Comparison between 2023 and 2028
- Exhibits28: Bargaining power of buyers - Impact of key factors 2023 and 2028
- Exhibits29: Bargaining power of suppliers - Impact of key factors in 2023 and 2028
- Exhibits30: Threat of new entrants - Impact of key factors in 2023 and 2028
- Exhibits31: Threat of substitutes - Impact of key factors in 2023 and 2028
- Exhibits32: Threat of rivalry - Impact of key factors in 2023 and 2028
- Exhibits33: Chart on Market condition - Five forces 2023 and 2028
- Exhibits34: Chart on Application - Market share 2023-2028 (%)
- Exhibits35: Data Table on Application - Market share 2023-2028 (%)
- Exhibits36: Chart on Comparison by Application
- Exhibits37: Data Table on Comparison by Application
- Exhibits38: Chart on Standalone rupture disc - Market size and forecast 2023-2028 ($ million)
- Exhibits39: Data Table on Standalone rupture disc - Market size and forecast 2023-2028 ($ million)
- Exhibits40: Chart on Standalone rupture disc - Year-over-year growth 2023-2028 (%)
- Exhibits41: Data Table on Standalone rupture disc - Year-over-year growth 2023-2028 (%)
- Exhibits42: Chart on Rupture disc in combination with relief valves - Market size and forecast 2023-2028 ($ million)
- Exhibits43: Data Table on Rupture disc in combination with relief valves - Market size and forecast 2023-2028 ($ million)
- Exhibits44: Chart on Rupture disc in combination with relief valves - Year-over-year growth 2023-2028 (%)
- Exhibits45: Data Table on Rupture disc in combination with relief valves - Year-over-year growth 2023-2028 (%)
- Exhibits46: Market opportunity by Application ($ million)
- Exhibits47: Data Table on Market opportunity by Application ($ million)
- Exhibits48: Chart on Product - Market share 2023-2028 (%)
- Exhibits49: Data Table on Product - Market share 2023-2028 (%)
- Exhibits50: Chart on Comparison by Product
- Exhibits51: Data Table on Comparison by Product
- Exhibits52: Chart on Metallic rupture disc - Market size and forecast 2023-2028 ($ million)
- Exhibits53: Data Table on Metallic rupture disc - Market size and forecast 2023-2028 ($ million)
- Exhibits54: Chart on Metallic rupture disc - Year-over-year growth 2023-2028 (%)
- Exhibits55: Data Table on Metallic rupture disc - Year-over-year growth 2023-2028 (%)
- Exhibits56: Chart on Graphite rupture disc - Market size and forecast 2023-2028 ($ million)
- Exhibits57: Data Table on Graphite rupture disc - Market size and forecast 2023-2028 ($ million)
- Exhibits58: Chart on Graphite rupture disc - Year-over-year growth 2023-2028 (%)
- Exhibits59: Data Table on Graphite rupture disc - Year-over-year growth 2023-2028 (%)
- Exhibits60: Market opportunity by Product ($ million)
- Exhibits61: Data Table on Market opportunity by Product ($ million)
- Exhibits62: Chart on End-user - Market share 2023-2028 (%)
- Exhibits63: Data Table on End-user - Market share 2023-2028 (%)
- Exhibits64: Chart on Comparison by End-user
- Exhibits65: Data Table on Comparison by End-user
- Exhibits66: Chart on Energy - Market size and forecast 2023-2028 ($ million)
- Exhibits67: Data Table on Energy - Market size and forecast 2023-2028 ($ million)
- Exhibits68: Chart on Energy - Year-over-year growth 2023-2028 (%)
- Exhibits69: Data Table on Energy - Year-over-year growth 2023-2028 (%)
- Exhibits70: Chart on Processing industries - Market size and forecast 2023-2028 ($ million)
- Exhibits71: Data Table on Processing industries - Market size and forecast 2023-2028 ($ million)
- Exhibits72: Chart on Processing industries - Year-over-year growth 2023-2028 (%)
- Exhibits73: Data Table on Processing industries - Year-over-year growth 2023-2028 (%)
- Exhibits74: Chart on Transportation - Market size and forecast 2023-2028 ($ million)
- Exhibits75: Data Table on Transportation - Market size and forecast 2023-2028 ($ million)
- Exhibits76: Chart on Transportation - Year-over-year growth 2023-2028 (%)
- Exhibits77: Data Table on Transportation - Year-over-year growth 2023-2028 (%)
- Exhibits78: Chart on Others - Market size and forecast 2023-2028 ($ million)
- Exhibits79: Data Table on Others - Market size and forecast 2023-2028 ($ million)
- Exhibits80: Chart on Others - Year-over-year growth 2023-2028 (%)
- Exhibits81: Data Table on Others - Year-over-year growth 2023-2028 (%)
- Exhibits82: Market opportunity by End-user ($ million)
- Exhibits83: Data Table on Market opportunity by End-user ($ million)
- Exhibits84: Analysis of price sensitivity, lifecycle, customer purchase basket, adoption rates, and purchase criteria
- Exhibits85: Chart on Market share By Geographical Landscape 2023-2028 (%)
- Exhibits86: Data Table on Market share By Geographical Landscape 2023-2028 (%)
- Exhibits87: Chart on Geographic comparison
- Exhibits88: Data Table on Geographic comparison
- Exhibits89: Chart on APAC - Market size and forecast 2023-2028 ($ million)
- Exhibits90: Data Table on APAC - Market size and forecast 2023-2028 ($ million)
- Exhibits91: Chart on APAC - Year-over-year growth 2023-2028 (%)
- Exhibits92: Data Table on APAC - Year-over-year growth 2023-2028 (%)
- Exhibits93: Chart on Europe - Market size and forecast 2023-2028 ($ million)
- Exhibits94: Data Table on Europe - Market size and forecast 2023-2028 ($ million)
- Exhibits95: Chart on Europe - Year-over-year growth 2023-2028 (%)
- Exhibits96: Data Table on Europe - Year-over-year growth 2023-2028 (%)
- Exhibits97: Chart on North America - Market size and forecast 2023-2028 ($ million)
- Exhibits98: Data Table on North America - Market size and forecast 2023-2028 ($ million)
- Exhibits99: Chart on North America - Year-over-year growth 2023-2028 (%)
- Exhibits100: Data Table on North America - Year-over-year growth 2023-2028 (%)
- Exhibits101: Chart on South America - Market size and forecast 2023-2028 ($ million)
- Exhibits102: Data Table on South America - Market size and forecast 2023-2028 ($ million)
- Exhibits103: Chart on South America - Year-over-year growth 2023-2028 (%)
- Exhibits104: Data Table on South America - Year-over-year growth 2023-2028 (%)
- Exhibits105: Chart on Middle East and Africa - Market size and forecast 2023-2028 ($ million)
- Exhibits106: Data Table on Middle East and Africa - Market size and forecast 2023-2028 ($ million)
- Exhibits107: Chart on Middle East and Africa - Year-over-year growth 2023-2028 (%)
- Exhibits108: Data Table on Middle East and Africa - Year-over-year growth 2023-2028 (%)
- Exhibits109: Chart on US - Market size and forecast 2023-2028 ($ million)
- Exhibits110: Data Table on US - Market size and forecast 2023-2028 ($ million)
- Exhibits111: Chart on US - Year-over-year growth 2023-2028 (%)
- Exhibits112: Data Table on US - Year-over-year growth 2023-2028 (%)
- Exhibits113: Chart on China - Market size and forecast 2023-2028 ($ million)
- Exhibits114: Data Table on China - Market size and forecast 2023-2028 ($ million)
- Exhibits115: Chart on China - Year-over-year growth 2023-2028 (%)
- Exhibits116: Data Table on China - Year-over-year growth 2023-2028 (%)
- Exhibits117: Chart on Germany - Market size and forecast 2023-2028 ($ million)
- Exhibits118: Data Table on Germany - Market size and forecast 2023-2028 ($ million)
- Exhibits119: Chart on Germany - Year-over-year growth 2023-2028 (%)
- Exhibits120: Data Table on Germany - Year-over-year growth 2023-2028 (%)
- Exhibits121: Chart on Japan - Market size and forecast 2023-2028 ($ million)
- Exhibits122: Data Table on Japan - Market size and forecast 2023-2028 ($ million)
- Exhibits123: Chart on Japan - Year-over-year growth 2023-2028 (%)
- Exhibits124: Data Table on Japan - Year-over-year growth 2023-2028 (%)
- Exhibits125: Chart on UK - Market size and forecast 2023-2028 ($ million)
- Exhibits126: Data Table on UK - Market size and forecast 2023-2028 ($ million)
- Exhibits127: Chart on UK - Year-over-year growth 2023-2028 (%)
- Exhibits128: Data Table on UK - Year-over-year growth 2023-2028 (%)
- Exhibits129: Market opportunity By Geographical Landscape ($ million)
- Exhibits130: Data Tables on Market opportunity By Geographical Landscape ($ million)
- Exhibits131: Impact of drivers and challenges in 2023 and 2028
- Exhibits132: Overview on criticality of inputs and factors of differentiation
- Exhibits133: Overview on factors of disruption
- Exhibits134: Impact of key risks on business
- Exhibits135: Companies covered
- Exhibits136: Matrix on companies position and classification
- Exhibits137: BS and B Innovations Ltd. - Overview
- Exhibits138: BS and B Innovations Ltd. - Product / Service
- Exhibits139: BS and B Innovations Ltd. - Key offerings
- Exhibits140: Continental Disc Corp. - Overview
- Exhibits141: Continental Disc Corp. - Product / Service
- Exhibits142: Continental Disc Corp. - Key offerings
- Exhibits143: DonadonSDD Srl - Overview
- Exhibits144: DonadonSDD Srl - Product / Service
- Exhibits145: DonadonSDD Srl - Key offerings
- Exhibits146: Emerson Electric Co. - Overview
- Exhibits147: Emerson Electric Co. - Business segments
- Exhibits148: Emerson Electric Co. - Key news
- Exhibits149: Emerson Electric Co. - Key offerings
- Exhibits150: Emerson Electric Co. - Segment focus
- Exhibits151: Fike Corp. - Overview
- Exhibits152: Fike Corp. - Product / Service
- Exhibits153: Fike Corp. - Key offerings
- Exhibits154: Graco Inc. - Overview
- Exhibits155: Graco Inc. - Product / Service
- Exhibits156: Graco Inc. - Key news
- Exhibits157: Graco Inc. - Key offerings
- Exhibits158: Halma Plc - Overview
- Exhibits159: Halma Plc - Business segments
- Exhibits160: Halma Plc - Key news
- Exhibits161: Halma Plc - Key offerings
- Exhibits162: Halma Plc - Segment focus
- Exhibits163: Heleon Group BV - Overview
- Exhibits164: Heleon Group BV - Product / Service
- Exhibits165: Heleon Group BV - Key offerings
- Exhibits166: Leser GmbH and Co. KG - Overview
- Exhibits167: Leser GmbH and Co. KG - Product / Service
- Exhibits168: Leser GmbH and Co. KG - Key offerings
- Exhibits169: Mersen Corporate Services SAS - Overview
- Exhibits170: Mersen Corporate Services SAS - Business segments
- Exhibits171: Mersen Corporate Services SAS - Key offerings
- Exhibits172: Mersen Corporate Services SAS - Segment focus
- Exhibits173: Parker Hannifin Corp. - Overview
- Exhibits174: Parker Hannifin Corp. - Business segments
- Exhibits175: Parker Hannifin Corp. - Key news
- Exhibits176: Parker Hannifin Corp. - Key offerings
- Exhibits177: Parker Hannifin Corp. - Segment focus
- Exhibits178: Parr Instrument Co. - Overview
- Exhibits179: Parr Instrument Co. - Product / Service
- Exhibits180: Parr Instrument Co. - Key offerings
- Exhibits181: SGL Carbon SE - Overview
- Exhibits182: SGL Carbon SE - Business segments
- Exhibits183: SGL Carbon SE - Key offerings
- Exhibits184: SGL Carbon SE - Segment focus
- Exhibits185: V TEX Corp. - Overview
- Exhibits186: V TEX Corp. - Product / Service
- Exhibits187: V TEX Corp. - Key offerings
- Exhibits188: Wolff Group - Overview
- Exhibits189: Wolff Group - Product / Service
- Exhibits190: Wolff Group - Key offerings
- Exhibits191: Inclusions checklist
- Exhibits192: Exclusions checklist
- Exhibits193: Currency conversion rates for US$
- Exhibits194: Research methodology
- Exhibits195: Information sources
- Exhibits196: Data validation
- Exhibits197: Validation techniques employed for market sizing
- Exhibits198: Data synthesis
- Exhibits199: 360 degree market analysis
- Exhibits200: List of abbreviations
Technavio has been monitoring the rupture disc market and is forecast to grow by USD 86.9 mn during 2023-2028, accelerating at a CAGR of 2.83% during the forecast period. Our report on the rupture disc market provides a holistic analysis, market size and forecast, trends, growth drivers, and challenges, as well as vendor analysis covering around 25 vendors.
The report offers an up-to-date analysis regarding the current market scenario, the latest trends and drivers, and the overall market environment. The market is driven by growing demand for fast-acting relief devices, ability to handle highly viscous liquids, and growing importance of water and wastewater treatment industry.
Technavio's rupture disc market is segmented as below:
| Market Scope | |
|---|---|
| Base Year | 2024 |
| End Year | 2028 |
| Series Year | 2024-2028 |
| Growth Momentum | Accelerate |
| YOY 2024 | 2.72% |
| CAGR | 2.83% |
| Incremental Value | $86.9mn |
By Application
- Standalone rupture disc
- Rupture disc in combination with relief valves
By Product
- Metallic rupture disc
- Graphite rupture disc
By End-user
- Energy
- Processing industries
- Transportation
- Others
By Geographical Landscape
- APAC
- Europe
- North America
- South America
- Middle East and Africa
This study identifies the miniaturization of rupture discs as one of the prime reasons driving the rupture disc market growth during the next few years. Also, development of two-way rupture discs and increasing demand for pressure vessels from various end-user industries will lead to sizable demand in the market.
Technavio presents a detailed picture of the market by the way of study, synthesis, and summation of data from multiple sources by an analysis of key parameters. Our report on the rupture disc market covers the following areas:
- Rupture disc market sizing
- Rupture disc market forecast
- Rupture disc market industry analysis
Technavio's robust vendor analysis is designed to help clients improve their market position, and in line with this, this report provides a detailed analysis of several leading rupture disc market vendors that include BS and B Innovations Ltd., Continental Disc Corp., DonadonSDD Srl, Emerson Electric Co., Fike Corp., Graco Inc., Halma Plc, Heleon Group BV, Leser GmbH and Co. KG, Mersen Corporate Services SAS, Parker Hannifin Corp., Parr Instrument Co., Rembe, SGL Carbon SE, Striko Verfahrenstechnik GmbH, Technetics Group, Tundra Process Solutions Ltd, V TEX Corp., Wolff Group, and Zook Enterprises LLC. Also, the rupture disc market analysis report includes information on upcoming trends and challenges that will influence market growth. This is to help companies strategize and leverage all forthcoming growth opportunities.
The study was conducted using an objective combination of primary and secondary information including inputs from key participants in the industry. The report contains a comprehensive market and vendor landscape in addition to an analysis of the key vendors.
Technavio presents a detailed picture of the market by the way of study, synthesis, and summation of data from multiple sources by an analysis of key parameters such as profit, pricing, competition, and promotions. It presents various market facets by identifying the key industry influencers. The data presented is comprehensive, reliable, and a result of extensive research - both primary and secondary. Technavio's market research reports provide a complete competitive landscape and an in-depth vendor selection methodology and analysis using qualitative and quantitative research to forecast accurate market growth.
Table of Contents
1 Executive Summary
- 1.1 Market overview
- Executive Summary - Chart on Market Overview
- Executive Summary - Data Table on Market Overview
- Executive Summary - Chart on Global Market Characteristics
- Executive Summary - Chart on Market By Geographical Landscape
- Executive Summary - Chart on Market Segmentation by Application
- Executive Summary - Chart on Market Segmentation by Product
- Executive Summary - Chart on Market Segmentation by End-user
- Executive Summary - Chart on Incremental Growth
- Executive Summary - Data Table on Incremental Growth
- Executive Summary - Chart on Company Market Positioning
2 Market Landscape
- 2.1 Market ecosystem
- Parent Market
- Data Table on - Parent Market
- 2.2 Market characteristics
- Market characteristics analysis
- 2.3 Value chain analysis
- Value Chain Analysis
3 Market Sizing
- 3.1 Market definition
- Offerings of companies included in the market definition
- 3.2 Market segment analysis
- Market segments
- 3.3 Market size 2023
- 3.4 Market outlook: Forecast for 2023-2028
- Chart on Global - Market size and forecast 2023-2028 ($ million)
- Data Table on Global - Market size and forecast 2023-2028 ($ million)
- Chart on Global Market: Year-over-year growth 2023-2028 (%)
- Data Table on Global Market: Year-over-year growth 2023-2028 (%)
4 Historic Market Size
- 4.1 Global Rupture Disc Market 2018 - 2022
- Historic Market Size - Data Table on Global Rupture Disc Market 2018 - 2022 ($ million)
- 4.2 Application segment analysis 2018 - 2022
- Historic Market Size - Application Segment 2018 - 2022 ($ million)
- 4.3 Product segment analysis 2018 - 2022
- Historic Market Size - Product Segment 2018 - 2022 ($ million)
- 4.4 End-user segment analysis 2018 - 2022
- Historic Market Size - End-user Segment 2018 - 2022 ($ million)
- 4.5 Geography segment analysis 2018 - 2022
- Historic Market Size - Geography Segment 2018 - 2022 ($ million)
- 4.6 Country segment analysis 2018 - 2022
- Historic Market Size - Country Segment 2018 - 2022 ($ million)
5 Five Forces Analysis
- 5.1 Five forces summary
- Five forces analysis - Comparison between 2023 and 2028
- 5.2 Bargaining power of buyers
- Bargaining power of buyers - Impact of key factors 2023 and 2028
- 5.3 Bargaining power of suppliers
- Bargaining power of suppliers - Impact of key factors in 2023 and 2028
- 5.4 Threat of new entrants
- Threat of new entrants - Impact of key factors in 2023 and 2028
- 5.5 Threat of substitutes
- Threat of substitutes - Impact of key factors in 2023 and 2028
- 5.6 Threat of rivalry
- Threat of rivalry - Impact of key factors in 2023 and 2028
- 5.7 Market condition
- Chart on Market condition - Five forces 2023 and 2028
6 Market Segmentation by Application
- 6.1 Market segments
- Chart on Application - Market share 2023-2028 (%)
- Data Table on Application - Market share 2023-2028 (%)
- 6.2 Comparison by Application
- Chart on Comparison by Application
- Data Table on Comparison by Application
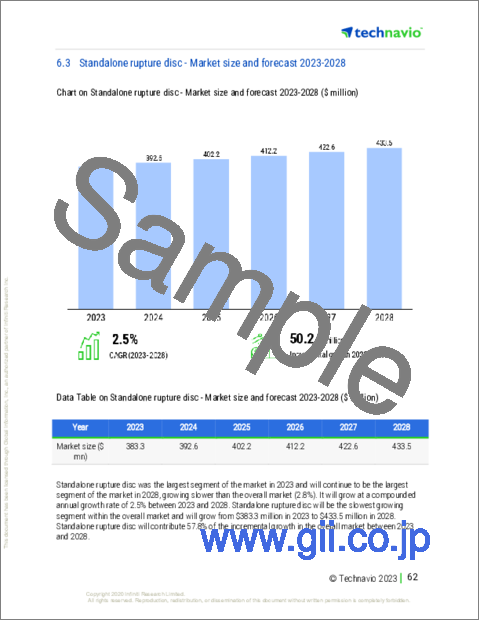
- 6.3 Standalone rupture disc - Market size and forecast 2023-2028
- Chart on Standalone rupture disc - Market size and forecast 2023-2028 ($ million)
- Data Table on Standalone rupture disc - Market size and forecast 2023-2028 ($ million)
- Chart on Standalone rupture disc - Year-over-year growth 2023-2028 (%)
- Data Table on Standalone rupture disc - Year-over-year growth 2023-2028 (%)
- 6.4 Rupture disc in combination with relief valves - Market size and forecast 2023-2028
- Chart on Rupture disc in combination with relief valves - Market size and forecast 2023-2028 ($ million)
- Data Table on Rupture disc in combination with relief valves - Market size and forecast 2023-2028 ($ million)
- Chart on Rupture disc in combination with relief valves - Year-over-year growth 2023-2028 (%)
- Data Table on Rupture disc in combination with relief valves - Year-over-year growth 2023-2028 (%)
- 6.5 Market opportunity by Application
- Market opportunity by Application ($ million)
- Data Table on Market opportunity by Application ($ million)
7 Market Segmentation by Product
- 7.1 Market segments
- Chart on Product - Market share 2023-2028 (%)
- Data Table on Product - Market share 2023-2028 (%)
- 7.2 Comparison by Product
- Chart on Comparison by Product
- Data Table on Comparison by Product
- 7.3 Metallic rupture disc - Market size and forecast 2023-2028
- Chart on Metallic rupture disc - Market size and forecast 2023-2028 ($ million)
- Data Table on Metallic rupture disc - Market size and forecast 2023-2028 ($ million)
- Chart on Metallic rupture disc - Year-over-year growth 2023-2028 (%)
- Data Table on Metallic rupture disc - Year-over-year growth 2023-2028 (%)
- 7.4 Graphite rupture disc - Market size and forecast 2023-2028
- Chart on Graphite rupture disc - Market size and forecast 2023-2028 ($ million)
- Data Table on Graphite rupture disc - Market size and forecast 2023-2028 ($ million)
- Chart on Graphite rupture disc - Year-over-year growth 2023-2028 (%)
- Data Table on Graphite rupture disc - Year-over-year growth 2023-2028 (%)
- 7.5 Market opportunity by Product
- Market opportunity by Product ($ million)
- Data Table on Market opportunity by Product ($ million)
8 Market Segmentation by End-user
- 8.1 Market segments
- Chart on End-user - Market share 2023-2028 (%)
- Data Table on End-user - Market share 2023-2028 (%)
- 8.2 Comparison by End-user
- Chart on Comparison by End-user
- Data Table on Comparison by End-user
- 8.3 Energy - Market size and forecast 2023-2028
- Chart on Energy - Market size and forecast 2023-2028 ($ million)
- Data Table on Energy - Market size and forecast 2023-2028 ($ million)
- Chart on Energy - Year-over-year growth 2023-2028 (%)
- Data Table on Energy - Year-over-year growth 2023-2028 (%)
- 8.4 Processing industries - Market size and forecast 2023-2028
- Chart on Processing industries - Market size and forecast 2023-2028 ($ million)
- Data Table on Processing industries - Market size and forecast 2023-2028 ($ million)
- Chart on Processing industries - Year-over-year growth 2023-2028 (%)
- Data Table on Processing industries - Year-over-year growth 2023-2028 (%)
- 8.5 Transportation - Market size and forecast 2023-2028
- Chart on Transportation - Market size and forecast 2023-2028 ($ million)
- Data Table on Transportation - Market size and forecast 2023-2028 ($ million)
- Chart on Transportation - Year-over-year growth 2023-2028 (%)
- Data Table on Transportation - Year-over-year growth 2023-2028 (%)
- 8.6 Others - Market size and forecast 2023-2028
- Chart on Others - Market size and forecast 2023-2028 ($ million)
- Data Table on Others - Market size and forecast 2023-2028 ($ million)
- Chart on Others - Year-over-year growth 2023-2028 (%)
- Data Table on Others - Year-over-year growth 2023-2028 (%)
- 8.7 Market opportunity by End-user
- Market opportunity by End-user ($ million)
- Data Table on Market opportunity by End-user ($ million)
9 Customer Landscape
- 9.1 Customer landscape overview
- Analysis of price sensitivity, lifecycle, customer purchase basket, adoption rates, and purchase criteria
10 Geographic Landscape
- 10.1 Geographic segmentation
- Chart on Market share By Geographical Landscape 2023-2028 (%)
- Data Table on Market share By Geographical Landscape 2023-2028 (%)
- 10.2 Geographic comparison
- Chart on Geographic comparison
- Data Table on Geographic comparison
- 10.3 APAC - Market size and forecast 2023-2028
- Chart on APAC - Market size and forecast 2023-2028 ($ million)
- Data Table on APAC - Market size and forecast 2023-2028 ($ million)
- Chart on APAC - Year-over-year growth 2023-2028 (%)
- Data Table on APAC - Year-over-year growth 2023-2028 (%)
- 10.4 Europe - Market size and forecast 2023-2028
- Chart on Europe - Market size and forecast 2023-2028 ($ million)
- Data Table on Europe - Market size and forecast 2023-2028 ($ million)
- Chart on Europe - Year-over-year growth 2023-2028 (%)
- Data Table on Europe - Year-over-year growth 2023-2028 (%)
- 10.5 North America - Market size and forecast 2023-2028
- Chart on North America - Market size and forecast 2023-2028 ($ million)
- Data Table on North America - Market size and forecast 2023-2028 ($ million)
- Chart on North America - Year-over-year growth 2023-2028 (%)
- Data Table on North America - Year-over-year growth 2023-2028 (%)
- 10.6 South America - Market size and forecast 2023-2028
- Chart on South America - Market size and forecast 2023-2028 ($ million)
- Data Table on South America - Market size and forecast 2023-2028 ($ million)
- Chart on South America - Year-over-year growth 2023-2028 (%)
- Data Table on South America - Year-over-year growth 2023-2028 (%)
- 10.7 Middle East and Africa - Market size and forecast 2023-2028
- Chart on Middle East and Africa - Market size and forecast 2023-2028 ($ million)
- Data Table on Middle East and Africa - Market size and forecast 2023-2028 ($ million)
- Chart on Middle East and Africa - Year-over-year growth 2023-2028 (%)
- Data Table on Middle East and Africa - Year-over-year growth 2023-2028 (%)
- 10.8 US - Market size and forecast 2023-2028
- Chart on US - Market size and forecast 2023-2028 ($ million)
- Data Table on US - Market size and forecast 2023-2028 ($ million)
- Chart on US - Year-over-year growth 2023-2028 (%)
- Data Table on US - Year-over-year growth 2023-2028 (%)
- 10.9 China - Market size and forecast 2023-2028
- Chart on China - Market size and forecast 2023-2028 ($ million)
- Data Table on China - Market size and forecast 2023-2028 ($ million)
- Chart on China - Year-over-year growth 2023-2028 (%)
- Data Table on China - Year-over-year growth 2023-2028 (%)
- 10.10 Germany - Market size and forecast 2023-2028
- Chart on Germany - Market size and forecast 2023-2028 ($ million)
- Data Table on Germany - Market size and forecast 2023-2028 ($ million)
- Chart on Germany - Year-over-year growth 2023-2028 (%)
- Data Table on Germany - Year-over-year growth 2023-2028 (%)
- 10.11 Japan - Market size and forecast 2023-2028
- Chart on Japan - Market size and forecast 2023-2028 ($ million)
- Data Table on Japan - Market size and forecast 2023-2028 ($ million)
- Chart on Japan - Year-over-year growth 2023-2028 (%)
- Data Table on Japan - Year-over-year growth 2023-2028 (%)
- 10.12 UK - Market size and forecast 2023-2028
- Chart on UK - Market size and forecast 2023-2028 ($ million)
- Data Table on UK - Market size and forecast 2023-2028 ($ million)
- Chart on UK - Year-over-year growth 2023-2028 (%)
- Data Table on UK - Year-over-year growth 2023-2028 (%)
- 10.13 Market opportunity By Geographical Landscape
- Market opportunity By Geographical Landscape ($ million)
- Data Tables on Market opportunity By Geographical Landscape ($ million)
11 Drivers, Challenges, and Opportunity/Restraints
- 11.1 Market drivers
- 11.2 Market challenges
- 11.3 Impact of drivers and challenges
- Impact of drivers and challenges in 2023 and 2028
- 11.4 Market opportunities/restraints
12 Competitive Landscape
- 12.1 Overview
- 12.2 Competitive Landscape
- Overview on criticality of inputs and factors of differentiation
- 12.3 Landscape disruption
- Overview on factors of disruption
- 12.4 Industry risks
- Impact of key risks on business
13 Competitive Analysis
- 13.1 Companies profiled
- Companies covered
- 13.2 Market positioning of companies
- Matrix on companies position and classification
- 13.3 BS and B Innovations Ltd.
- BS and B Innovations Ltd. - Overview
- BS and B Innovations Ltd. - Product / Service
- BS and B Innovations Ltd. - Key offerings
- 13.4 Continental Disc Corp.
- Continental Disc Corp. - Overview
- Continental Disc Corp. - Product / Service
- Continental Disc Corp. - Key offerings
- 13.5 DonadonSDD Srl
- DonadonSDD Srl - Overview
- DonadonSDD Srl - Product / Service
- DonadonSDD Srl - Key offerings
- 13.6 Emerson Electric Co.
- Emerson Electric Co. - Overview
- Emerson Electric Co. - Business segments
- Emerson Electric Co. - Key news
- Emerson Electric Co. - Key offerings
- Emerson Electric Co. - Segment focus
- 13.7 Fike Corp.
- Fike Corp. - Overview
- Fike Corp. - Product / Service
- Fike Corp. - Key offerings
- 13.8 Graco Inc.
- Graco Inc. - Overview
- Graco Inc. - Product / Service
- Graco Inc. - Key news
- Graco Inc. - Key offerings
- 13.9 Halma Plc
- Halma Plc - Overview
- Halma Plc - Business segments
- Halma Plc - Key news
- Halma Plc - Key offerings
- Halma Plc - Segment focus
- 13.10 Heleon Group BV
- Heleon Group BV - Overview
- Heleon Group BV - Product / Service
- Heleon Group BV - Key offerings
- 13.11 Leser GmbH and Co. KG
- Leser GmbH and Co. KG - Overview
- Leser GmbH and Co. KG - Product / Service
- Leser GmbH and Co. KG - Key offerings
- 13.12 Mersen Corporate Services SAS
- Mersen Corporate Services SAS - Overview
- Mersen Corporate Services SAS - Business segments
- Mersen Corporate Services SAS - Key offerings
- Mersen Corporate Services SAS - Segment focus
- 13.13 Parker Hannifin Corp.
- Parker Hannifin Corp. - Overview
- Parker Hannifin Corp. - Business segments
- Parker Hannifin Corp. - Key news
- Parker Hannifin Corp. - Key offerings
- Parker Hannifin Corp. - Segment focus
- 13.14 Parr Instrument Co.
- Parr Instrument Co. - Overview
- Parr Instrument Co. - Product / Service
- Parr Instrument Co. - Key offerings
- 13.15 SGL Carbon SE
- SGL Carbon SE - Overview
- SGL Carbon SE - Business segments
- SGL Carbon SE - Key offerings
- SGL Carbon SE - Segment focus
- 13.16 V TEX Corp.
- V TEX Corp. - Overview
- V TEX Corp. - Product / Service
- V TEX Corp. - Key offerings
- 13.17 Wolff Group
- Wolff Group - Overview
- Wolff Group - Product / Service
- Wolff Group - Key offerings
14 Appendix
- 14.1 Scope of the report
- 14.2 Inclusions and exclusions checklist
- Inclusions checklist
- Exclusions checklist
- 14.3 Currency conversion rates for US$
- Currency conversion rates for US$
- 14.4 Research methodology
- Research methodology
- 14.5 Data procurement
- Information sources
- 14.6 Data validation
- Data validation
- 14.7 Validation techniques employed for market sizing
- Validation techniques employed for market sizing
- 14.8 Data synthesis
- Data synthesis
- 14.9 market analysis
- market analysis
- 14.10 List of abbreviations
- List of abbreviations

