|
|
市場調査レポート
商品コード
1559219
デジタイザの世界市場、2024年~2028年Global Digitizer Market 2024-2028 |
||||||

|
|||||||
カスタマイズ可能
|
|||||||


| デジタイザの世界市場、2024年~2028年 |
|
出版日: 2024年08月16日
発行: TechNavio
ページ情報: 英文 167 Pages
納期: 即納可能
|

全表示
- 概要
- 図表
- 目次
デジタイザ市場2024-2028
デジタイザ市場は2023-2028年に7,020万米ドル、予測期間中のCAGRは3.21%で成長すると予測されます。当レポートでは、デジタイザ市場の全体的な分析、市場規模・予測、動向、成長促進要因、課題、約25のベンダーを網羅したベンダー分析などを掲載しています。
現在の市場シナリオ、最新動向と促進要因、市場環境全体に関する最新分析を提供しています。市場は、製品のプレミアム化につながる革新的な製品の開拓、エンドユーザー産業における採用の増加、見本市や競合におけるデジタイザの使用の増加によって牽引されています。
| 市場範囲 | |
|---|---|
| 基準年 | 2024 |
| 終了年 | 2028 |
| 予測期間 | 2024-2028 |
| 成長モメンタム | 加速 |
| 前年比2024年 | 3.07% |
| CAGR | 3.21% |
| 増分額 | 7,020万米ドル |
本調査では、カスタマイズ可能なショートカットキーを備え、複数のデザインやアーティストソフトウェアと互換性のあるデジタイザーのイントロダクションが、今後数年間のデジタイザ市場の成長を促進する主な要因の1つであると指摘しています。また、柔軟なデジタイザーのイントロダクションやベンダーによる戦略的提携も、市場の大きな需要につながると思われます。
目次
第1章 エグゼクティブサマリー
- 市場概要
第2章 市場情勢
- 市場エコシステム
- 市場の特徴
- バリューチェーン分析
第3章 市場規模の評価
- 市場の定義
- 市場セグメント分析
- 市場規模 2023
- 市場の見通し 2023-2028
第4章 市場規模実績
- デジタイザの世界市場 2018-2022
- エンドユーザー別セグメント分析 2018-2022
- タイプ別セグメント分析 2018-2022
- 地域別セグメント分析 2018-2022
- 国別セグメント分析 2018-2022
第5章 ファイブフォース分析
- ファイブフォースの要約
- 買い手の交渉力
- 供給企業の交渉力
- 新規参入業者の脅威
- 代替品の脅威
- 競争の脅威
- 市況
第6章 市場セグメンテーション:エンドユーザー別
- 市場セグメンテーション
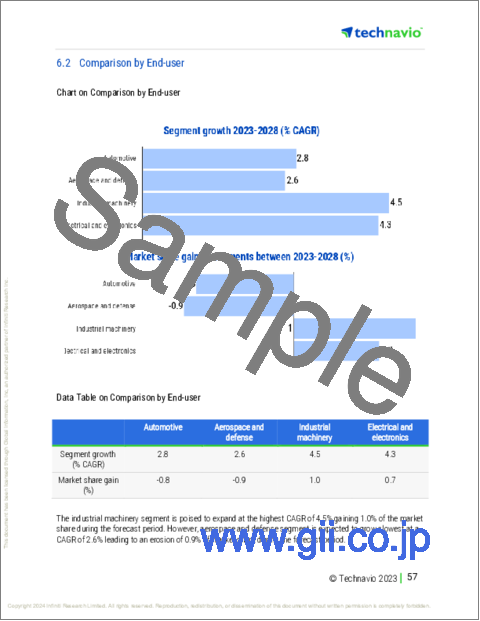
- 比較:エンドユーザー別
- 自動車:市場規模と予測 2023-2028
- 航空宇宙および防衛:市場規模と予測 2023-2028
- 産業機械:市場規模と予測 2023-2028
- 電気・電子:市場規模と予測 2023-2028
- 市場機会:エンドユーザー別
第7章 市場セグメンテーション:タイプ別
- 市場セグメンテーション
- 比較:タイプ別
- スクリーンなしデジタイザ:市場規模と予測 2023-2028
- スクリーン付きデジタイザ:市場規模と予測 2023-2028
- 市場機会:タイプ別
第8章 顧客情勢
- 顧客情勢の概要
第9章 地域別情勢
- 地域別セグメンテーション
- 地域別比較
- 北米:市場規模と予測 2023-2028
- 欧州:市場規模と予測 2023-2028
- アジア太平洋:市場規模と予測 2023-2028
- 中東・アフリカ:市場規模と予測 2023-2028
- 南米:市場規模と予測 2023-2028
- 米国:市場規模と予測 2023-2028
- 日本:市場規模と予測 2023-2028
- ドイツ:市場規模と予測 2023-2028
- 英国:市場規模と予測 2023-2028
- 中国:市場規模と予測 2023-2028
- 市場機会:地域情勢別
第10章 促進要因・課題・機会・抑制要因
- 市場促進要因
- 市場の課題
- 促進要因と課題の影響
- 市場の機会・抑制要因
第11章 競合情勢
- 概要
- 競合情勢
- 混乱の状況
- 業界のリスク
第12章 競合分析
- 企業プロファイル
- 企業の市場ポジショニング
- Adesso Inc.
- ADLINK Technology Inc.
- Eastman Kodak Co.
- GAOMON
- Hanvon Ugee Technology Co. Ltd.
- Immersion
- Parblo
- Samsung Electronics Co. Ltd.
- Shenzhen Hanbang Mechanical and Electrical Co. Ltd.
- Shenzhen Huion Trend Technology Co. Ltd.
- Shenzhen Upin Technology Co. Ltd.
- TurcomUSA
- UC Logic Technology Co.
- ViewSonic Corp.
- Wacom Co. Ltd.
第13章 付録
Exhibits:
- Exhibits1: Executive Summary - Chart on Market Overview
- Exhibits2: Executive Summary - Data Table on Market Overview
- Exhibits3: Executive Summary - Chart on Global Market Characteristics
- Exhibits4: Executive Summary - Chart on Market By Geographical Landscape
- Exhibits5: Executive Summary - Chart on Market Segmentation by End-user
- Exhibits6: Executive Summary - Chart on Market Segmentation by Type
- Exhibits7: Executive Summary - Chart on Incremental Growth
- Exhibits8: Executive Summary - Data Table on Incremental Growth
- Exhibits9: Executive Summary - Chart on Company Market Positioning
- Exhibits10: Parent Market
- Exhibits11: Data Table on - Parent Market
- Exhibits12: Market characteristics analysis
- Exhibits13: Value Chain Analysis
- Exhibits14: Offerings of companies included in the market definition
- Exhibits15: Market segments
- Exhibits16: Chart on Global - Market size and forecast 2023-2028 ($ million)
- Exhibits17: Data Table on Global - Market size and forecast 2023-2028 ($ million)
- Exhibits18: Chart on Global Market: Year-over-year growth 2023-2028 (%)
- Exhibits19: Data Table on Global Market: Year-over-year growth 2023-2028 (%)
- Exhibits20: Historic Market Size - Data Table on Global Digitizer Market 2018 - 2022 ($ million)
- Exhibits21: Historic Market Size - End-user Segment 2018 - 2022 ($ million)
- Exhibits22: Historic Market Size - Type Segment 2018 - 2022 ($ million)
- Exhibits23: Historic Market Size - Geography Segment 2018 - 2022 ($ million)
- Exhibits24: Historic Market Size - Country Segment 2018 - 2022 ($ million)
- Exhibits25: Five forces analysis - Comparison between 2023 and 2028
- Exhibits26: Bargaining power of buyers - Impact of key factors 2023 and 2028
- Exhibits27: Bargaining power of suppliers - Impact of key factors in 2023 and 2028
- Exhibits28: Threat of new entrants - Impact of key factors in 2023 and 2028
- Exhibits29: Threat of substitutes - Impact of key factors in 2023 and 2028
- Exhibits30: Threat of rivalry - Impact of key factors in 2023 and 2028
- Exhibits31: Chart on Market condition - Five forces 2023 and 2028
- Exhibits32: Chart on End-user - Market share 2023-2028 (%)
- Exhibits33: Data Table on End-user - Market share 2023-2028 (%)
- Exhibits34: Chart on Comparison by End-user
- Exhibits35: Data Table on Comparison by End-user
- Exhibits36: Chart on Automotive - Market size and forecast 2023-2028 ($ million)
- Exhibits37: Data Table on Automotive - Market size and forecast 2023-2028 ($ million)
- Exhibits38: Chart on Automotive - Year-over-year growth 2023-2028 (%)
- Exhibits39: Data Table on Automotive - Year-over-year growth 2023-2028 (%)
- Exhibits40: Chart on Aerospace and defense - Market size and forecast 2023-2028 ($ million)
- Exhibits41: Data Table on Aerospace and defense - Market size and forecast 2023-2028 ($ million)
- Exhibits42: Chart on Aerospace and defense - Year-over-year growth 2023-2028 (%)
- Exhibits43: Data Table on Aerospace and defense - Year-over-year growth 2023-2028 (%)
- Exhibits44: Chart on Industrial machinery - Market size and forecast 2023-2028 ($ million)
- Exhibits45: Data Table on Industrial machinery - Market size and forecast 2023-2028 ($ million)
- Exhibits46: Chart on Industrial machinery - Year-over-year growth 2023-2028 (%)
- Exhibits47: Data Table on Industrial machinery - Year-over-year growth 2023-2028 (%)
- Exhibits48: Chart on Electrical and electronics - Market size and forecast 2023-2028 ($ million)
- Exhibits49: Data Table on Electrical and electronics - Market size and forecast 2023-2028 ($ million)
- Exhibits50: Chart on Electrical and electronics - Year-over-year growth 2023-2028 (%)
- Exhibits51: Data Table on Electrical and electronics - Year-over-year growth 2023-2028 (%)
- Exhibits52: Market opportunity by End-user ($ million)
- Exhibits53: Data Table on Market opportunity by End-user ($ million)
- Exhibits54: Chart on Type - Market share 2023-2028 (%)
- Exhibits55: Data Table on Type - Market share 2023-2028 (%)
- Exhibits56: Chart on Comparison by Type
- Exhibits57: Data Table on Comparison by Type
- Exhibits58: Chart on Digitizer without screen - Market size and forecast 2023-2028 ($ million)
- Exhibits59: Data Table on Digitizer without screen - Market size and forecast 2023-2028 ($ million)
- Exhibits60: Chart on Digitizer without screen - Year-over-year growth 2023-2028 (%)
- Exhibits61: Data Table on Digitizer without screen - Year-over-year growth 2023-2028 (%)
- Exhibits62: Chart on Digitizer with screen - Market size and forecast 2023-2028 ($ million)
- Exhibits63: Data Table on Digitizer with screen - Market size and forecast 2023-2028 ($ million)
- Exhibits64: Chart on Digitizer with screen - Year-over-year growth 2023-2028 (%)
- Exhibits65: Data Table on Digitizer with screen - Year-over-year growth 2023-2028 (%)
- Exhibits66: Market opportunity by Type ($ million)
- Exhibits67: Data Table on Market opportunity by Type ($ million)
- Exhibits68: Analysis of price sensitivity, lifecycle, customer purchase basket, adoption rates, and purchase criteria
- Exhibits69: Chart on Market share By Geographical Landscape 2023-2028 (%)
- Exhibits70: Data Table on Market share By Geographical Landscape 2023-2028 (%)
- Exhibits71: Chart on Geographic comparison
- Exhibits72: Data Table on Geographic comparison
- Exhibits73: Chart on North America - Market size and forecast 2023-2028 ($ million)
- Exhibits74: Data Table on North America - Market size and forecast 2023-2028 ($ million)
- Exhibits75: Chart on North America - Year-over-year growth 2023-2028 (%)
- Exhibits76: Data Table on North America - Year-over-year growth 2023-2028 (%)
- Exhibits77: Chart on Europe - Market size and forecast 2023-2028 ($ million)
- Exhibits78: Data Table on Europe - Market size and forecast 2023-2028 ($ million)
- Exhibits79: Chart on Europe - Year-over-year growth 2023-2028 (%)
- Exhibits80: Data Table on Europe - Year-over-year growth 2023-2028 (%)
- Exhibits81: Chart on APAC - Market size and forecast 2023-2028 ($ million)
- Exhibits82: Data Table on APAC - Market size and forecast 2023-2028 ($ million)
- Exhibits83: Chart on APAC - Year-over-year growth 2023-2028 (%)
- Exhibits84: Data Table on APAC - Year-over-year growth 2023-2028 (%)
- Exhibits85: Chart on Middle East and Africa - Market size and forecast 2023-2028 ($ million)
- Exhibits86: Data Table on Middle East and Africa - Market size and forecast 2023-2028 ($ million)
- Exhibits87: Chart on Middle East and Africa - Year-over-year growth 2023-2028 (%)
- Exhibits88: Data Table on Middle East and Africa - Year-over-year growth 2023-2028 (%)
- Exhibits89: Chart on South America - Market size and forecast 2023-2028 ($ million)
- Exhibits90: Data Table on South America - Market size and forecast 2023-2028 ($ million)
- Exhibits91: Chart on South America - Year-over-year growth 2023-2028 (%)
- Exhibits92: Data Table on South America - Year-over-year growth 2023-2028 (%)
- Exhibits93: Chart on US - Market size and forecast 2023-2028 ($ million)
- Exhibits94: Data Table on US - Market size and forecast 2023-2028 ($ million)
- Exhibits95: Chart on US - Year-over-year growth 2023-2028 (%)
- Exhibits96: Data Table on US - Year-over-year growth 2023-2028 (%)
- Exhibits97: Chart on Japan - Market size and forecast 2023-2028 ($ million)
- Exhibits98: Data Table on Japan - Market size and forecast 2023-2028 ($ million)
- Exhibits99: Chart on Japan - Year-over-year growth 2023-2028 (%)
- Exhibits100: Data Table on Japan - Year-over-year growth 2023-2028 (%)
- Exhibits101: Chart on Germany - Market size and forecast 2023-2028 ($ million)
- Exhibits102: Data Table on Germany - Market size and forecast 2023-2028 ($ million)
- Exhibits103: Chart on Germany - Year-over-year growth 2023-2028 (%)
- Exhibits104: Data Table on Germany - Year-over-year growth 2023-2028 (%)
- Exhibits105: Chart on UK - Market size and forecast 2023-2028 ($ million)
- Exhibits106: Data Table on UK - Market size and forecast 2023-2028 ($ million)
- Exhibits107: Chart on UK - Year-over-year growth 2023-2028 (%)
- Exhibits108: Data Table on UK - Year-over-year growth 2023-2028 (%)
- Exhibits109: Chart on China - Market size and forecast 2023-2028 ($ million)
- Exhibits110: Data Table on China - Market size and forecast 2023-2028 ($ million)
- Exhibits111: Chart on China - Year-over-year growth 2023-2028 (%)
- Exhibits112: Data Table on China - Year-over-year growth 2023-2028 (%)
- Exhibits113: Market opportunity By Geographical Landscape ($ million)
- Exhibits114: Data Tables on Market opportunity By Geographical Landscape ($ million)
- Exhibits115: Impact of drivers and challenges in 2023 and 2028
- Exhibits116: Overview on criticality of inputs and factors of differentiation
- Exhibits117: Overview on factors of disruption
- Exhibits118: Impact of key risks on business
- Exhibits119: Companies covered
- Exhibits120: Matrix on companies position and classification
- Exhibits121: Adesso Inc. - Overview
- Exhibits122: Adesso Inc. - Product / Service
- Exhibits123: Adesso Inc. - Key offerings
- Exhibits124: ADLINK Technology Inc. - Overview
- Exhibits125: ADLINK Technology Inc. - Business segments
- Exhibits126: ADLINK Technology Inc. - Key offerings
- Exhibits127: ADLINK Technology Inc. - Segment focus
- Exhibits128: Eastman Kodak Co. - Overview
- Exhibits129: Eastman Kodak Co. - Business segments
- Exhibits130: Eastman Kodak Co. - Key news
- Exhibits131: Eastman Kodak Co. - Key offerings
- Exhibits132: Eastman Kodak Co. - Segment focus
- Exhibits133: GAOMON - Overview
- Exhibits134: GAOMON - Product / Service
- Exhibits135: GAOMON - Key offerings
- Exhibits136: Hanvon Ugee Technology Co. Ltd. - Overview
- Exhibits137: Hanvon Ugee Technology Co. Ltd. - Product / Service
- Exhibits138: Hanvon Ugee Technology Co. Ltd. - Key offerings
- Exhibits139: Immersion - Overview
- Exhibits140: Immersion - Product / Service
- Exhibits141: Immersion - Key offerings
- Exhibits142: Parblo - Overview
- Exhibits143: Parblo - Product / Service
- Exhibits144: Parblo - Key offerings
- Exhibits145: Samsung Electronics Co. Ltd. - Overview
- Exhibits146: Samsung Electronics Co. Ltd. - Business segments
- Exhibits147: Samsung Electronics Co. Ltd. - Key news
- Exhibits148: Samsung Electronics Co. Ltd. - Key offerings
- Exhibits149: Samsung Electronics Co. Ltd. - Segment focus
- Exhibits150: Shenzhen Hanbang Mechanical and Electrical Co. Ltd. - Overview
- Exhibits151: Shenzhen Hanbang Mechanical and Electrical Co. Ltd. - Product / Service
- Exhibits152: Shenzhen Hanbang Mechanical and Electrical Co. Ltd. - Key offerings
- Exhibits153: Shenzhen Huion Trend Technology Co. Ltd. - Overview
- Exhibits154: Shenzhen Huion Trend Technology Co. Ltd. - Product / Service
- Exhibits155: Shenzhen Huion Trend Technology Co. Ltd. - Key offerings
- Exhibits156: Shenzhen Upin Technology Co. Ltd. - Overview
- Exhibits157: Shenzhen Upin Technology Co. Ltd. - Product / Service
- Exhibits158: Shenzhen Upin Technology Co. Ltd. - Key offerings
- Exhibits159: TurcomUSA - Overview
- Exhibits160: TurcomUSA - Product / Service
- Exhibits161: TurcomUSA - Key offerings
- Exhibits162: UC Logic Technology Co. - Overview
- Exhibits163: UC Logic Technology Co. - Product / Service
- Exhibits164: UC Logic Technology Co. - Key offerings
- Exhibits165: ViewSonic Corp. - Overview
- Exhibits166: ViewSonic Corp. - Product / Service
- Exhibits167: ViewSonic Corp. - Key offerings
- Exhibits168: Wacom Co. Ltd. - Overview
- Exhibits169: Wacom Co. Ltd. - Business segments
- Exhibits170: Wacom Co. Ltd. - Key news
- Exhibits171: Wacom Co. Ltd. - Key offerings
- Exhibits172: Wacom Co. Ltd. - Segment focus
- Exhibits173: Inclusions checklist
- Exhibits174: Exclusions checklist
- Exhibits175: Currency conversion rates for US$
- Exhibits176: Research methodology
- Exhibits177: Information sources
- Exhibits178: Data validation
- Exhibits179: Validation techniques employed for market sizing
- Exhibits180: Data synthesis
- Exhibits181: 360 degree market analysis
- Exhibits182: List of abbreviations
Digitizer Market 2024-2028
The digitizer market is forecasted to grow by USD 70.2 mn during 2023-2028, accelerating at a CAGR of 3.21% during the forecast period. The report on the digitizer market provides a holistic analysis, market size and forecast, trends, growth drivers, and challenges, as well as vendor analysis covering around 25 vendors.
The report offers an up-to-date analysis regarding the current market scenario, the latest trends and drivers, and the overall market environment. The market is driven by development of innovative products leading to product premiumization, increased adoption in end-user industries, and increased use of digitizers at trade fairs and competitions.
| Market Scope | |
|---|---|
| Base Year | 2024 |
| End Year | 2028 |
| Series Year | 2024-2028 |
| Growth Momentum | Accelerate |
| YOY 2024 | 3.07% |
| CAGR | 3.21% |
| Incremental Value | $70.2 mn |
Technavio's digitizer market is segmented as below:
By End-user
- Automotive
- Aerospace and defense
- Industrial machinery
- Electrical and electronics
By Type
- Digitizer without screen
- Digitizer with screen
By Geographical Landscape
- North America
- Europe
- APAC
- Middle East and Africa
- South America
This study identifies the introduction of digitizers with customizable shortcut keys and compatible with multiple designs and artist software as one of the prime reasons driving the digitizer market growth during the next few years. Also, introduction of flexible digitizers and strategic alliances by vendors will lead to sizable demand in the market.
The report on the digitizer market covers the following areas:
- Digitizer market sizing
- Digitizer market forecast
- Digitizer market industry analysis
The vendor analysis is designed to help clients improve their market position, and in line with this, this report provides a detailed analysis of several leading digitizer market vendors that include Adesso Inc., ADLINK Technology Inc., Beijing Veikk E commerce Co. Ltd., Eastman Kodak Co., GAOMON, GTCO Cal Comp, Hanvon Ugee Technology Co. Ltd., Immersion, Parblo, Pyle USA Sound Around Inc, Samsung Electronics Co. Ltd., Shenzhen BOSTO Technology Co. Ltd., Shenzhen Hanbang Mechanical and Electrical Co. Ltd., Shenzhen Huion Trend Technology Co. Ltd., Shenzhen Upin Technology Co. Ltd., TurcomUSA, UC Logic Technology Co., ViewSonic Corp., and Wacom Co. Ltd.. Also, the digitizer market analysis report includes information on upcoming trends and challenges that will influence market growth. This is to help companies strategize and leverage all forthcoming growth opportunities.
The study was conducted using an objective combination of primary and secondary information including inputs from key participants in the industry. The report contains a comprehensive market and vendor landscape in addition to an analysis of the key vendors.
The publisher presents a detailed picture of the market by the way of study, synthesis, and summation of data from multiple sources by an analysis of key parameters such as profit, pricing, competition, and promotions. It presents various market facets by identifying the key industry influencers. The data presented is comprehensive, reliable, and a result of extensive research - both primary and secondary. The market research reports provide a complete competitive landscape and an in-depth vendor selection methodology and analysis using qualitative and quantitative research to forecast the accurate market growth.
Table of Contents
1 Executive Summary
- 1.1 Market overview
- Executive Summary - Chart on Market Overview
- Executive Summary - Data Table on Market Overview
- Executive Summary - Chart on Global Market Characteristics
- Executive Summary - Chart on Market By Geographical Landscape
- Executive Summary - Chart on Market Segmentation by End-user
- Executive Summary - Chart on Market Segmentation by Type
- Executive Summary - Chart on Incremental Growth
- Executive Summary - Data Table on Incremental Growth
- Executive Summary - Chart on Company Market Positioning
2 Market Landscape
- 2.1 Market ecosystem
- Parent Market
- Data Table on - Parent Market
- 2.2 Market characteristics
- Market characteristics analysis
- 2.3 Value chain analysis
- Value Chain Analysis
3 Market Sizing
- 3.1 Market definition
- Offerings of companies included in the market definition
- 3.2 Market segment analysis
- Market segments
- 3.3 Market size 2023
- 3.4 Market outlook: Forecast for 2023-2028
- Chart on Global - Market size and forecast 2023-2028 ($ million)
- Data Table on Global - Market size and forecast 2023-2028 ($ million)
- Chart on Global Market: Year-over-year growth 2023-2028 (%)
- Data Table on Global Market: Year-over-year growth 2023-2028 (%)
4 Historic Market Size
- 4.1 Global Digitizer Market 2018 - 2022
- Historic Market Size - Data Table on Global Digitizer Market 2018 - 2022 ($ million)
- 4.2 End-user segment analysis 2018 - 2022
- Historic Market Size - End-user Segment 2018 - 2022 ($ million)
- 4.3 Type segment analysis 2018 - 2022
- Historic Market Size - Type Segment 2018 - 2022 ($ million)
- 4.4 Geography segment analysis 2018 - 2022
- Historic Market Size - Geography Segment 2018 - 2022 ($ million)
- 4.5 Country segment analysis 2018 - 2022
- Historic Market Size - Country Segment 2018 - 2022 ($ million)
5 Five Forces Analysis
- 5.1 Five forces summary
- Five forces analysis - Comparison between 2023 and 2028
- 5.2 Bargaining power of buyers
- Bargaining power of buyers - Impact of key factors 2023 and 2028
- 5.3 Bargaining power of suppliers
- Bargaining power of suppliers - Impact of key factors in 2023 and 2028
- 5.4 Threat of new entrants
- Threat of new entrants - Impact of key factors in 2023 and 2028
- 5.5 Threat of substitutes
- Threat of substitutes - Impact of key factors in 2023 and 2028
- 5.6 Threat of rivalry
- Threat of rivalry - Impact of key factors in 2023 and 2028
- 5.7 Market condition
- Chart on Market condition - Five forces 2023 and 2028
6 Market Segmentation by End-user
- 6.1 Market segments
- Chart on End-user - Market share 2023-2028 (%)
- Data Table on End-user - Market share 2023-2028 (%)
- 6.2 Comparison by End-user
- Chart on Comparison by End-user
- Data Table on Comparison by End-user
- 6.3 Automotive - Market size and forecast 2023-2028
- Chart on Automotive - Market size and forecast 2023-2028 ($ million)
- Data Table on Automotive - Market size and forecast 2023-2028 ($ million)
- Chart on Automotive - Year-over-year growth 2023-2028 (%)
- Data Table on Automotive - Year-over-year growth 2023-2028 (%)
- 6.4 Aerospace and defense - Market size and forecast 2023-2028
- Chart on Aerospace and defense - Market size and forecast 2023-2028 ($ million)
- Data Table on Aerospace and defense - Market size and forecast 2023-2028 ($ million)
- Chart on Aerospace and defense - Year-over-year growth 2023-2028 (%)
- Data Table on Aerospace and defense - Year-over-year growth 2023-2028 (%)
- 6.5 Industrial machinery - Market size and forecast 2023-2028
- Chart on Industrial machinery - Market size and forecast 2023-2028 ($ million)
- Data Table on Industrial machinery - Market size and forecast 2023-2028 ($ million)
- Chart on Industrial machinery - Year-over-year growth 2023-2028 (%)
- Data Table on Industrial machinery - Year-over-year growth 2023-2028 (%)
- 6.6 Electrical and electronics - Market size and forecast 2023-2028
- Chart on Electrical and electronics - Market size and forecast 2023-2028 ($ million)
- Data Table on Electrical and electronics - Market size and forecast 2023-2028 ($ million)
- Chart on Electrical and electronics - Year-over-year growth 2023-2028 (%)
- Data Table on Electrical and electronics - Year-over-year growth 2023-2028 (%)
- 6.7 Market opportunity by End-user
- Market opportunity by End-user ($ million)
- Data Table on Market opportunity by End-user ($ million)
7 Market Segmentation by Type
- 7.1 Market segments
- Chart on Type - Market share 2023-2028 (%)
- Data Table on Type - Market share 2023-2028 (%)
- 7.2 Comparison by Type
- Chart on Comparison by Type
- Data Table on Comparison by Type
- 7.3 Digitizer without screen - Market size and forecast 2023-2028
- Chart on Digitizer without screen - Market size and forecast 2023-2028 ($ million)
- Data Table on Digitizer without screen - Market size and forecast 2023-2028 ($ million)
- Chart on Digitizer without screen - Year-over-year growth 2023-2028 (%)
- Data Table on Digitizer without screen - Year-over-year growth 2023-2028 (%)
- 7.4 Digitizer with screen - Market size and forecast 2023-2028
- Chart on Digitizer with screen - Market size and forecast 2023-2028 ($ million)
- Data Table on Digitizer with screen - Market size and forecast 2023-2028 ($ million)
- Chart on Digitizer with screen - Year-over-year growth 2023-2028 (%)
- Data Table on Digitizer with screen - Year-over-year growth 2023-2028 (%)
- 7.5 Market opportunity by Type
- Market opportunity by Type ($ million)
- Data Table on Market opportunity by Type ($ million)
8 Customer Landscape
- 8.1 Customer landscape overview
- Analysis of price sensitivity, lifecycle, customer purchase basket, adoption rates, and purchase criteria
9 Geographic Landscape
- 9.1 Geographic segmentation
- Chart on Market share By Geographical Landscape 2023-2028 (%)
- Data Table on Market share By Geographical Landscape 2023-2028 (%)
- 9.2 Geographic comparison
- Chart on Geographic comparison
- Data Table on Geographic comparison
- 9.3 North America - Market size and forecast 2023-2028
- Chart on North America - Market size and forecast 2023-2028 ($ million)
- Data Table on North America - Market size and forecast 2023-2028 ($ million)
- Chart on North America - Year-over-year growth 2023-2028 (%)
- Data Table on North America - Year-over-year growth 2023-2028 (%)
- 9.4 Europe - Market size and forecast 2023-2028
- Chart on Europe - Market size and forecast 2023-2028 ($ million)
- Data Table on Europe - Market size and forecast 2023-2028 ($ million)
- Chart on Europe - Year-over-year growth 2023-2028 (%)
- Data Table on Europe - Year-over-year growth 2023-2028 (%)
- 9.5 APAC - Market size and forecast 2023-2028
- Chart on APAC - Market size and forecast 2023-2028 ($ million)
- Data Table on APAC - Market size and forecast 2023-2028 ($ million)
- Chart on APAC - Year-over-year growth 2023-2028 (%)
- Data Table on APAC - Year-over-year growth 2023-2028 (%)
- 9.6 Middle East and Africa - Market size and forecast 2023-2028
- Chart on Middle East and Africa - Market size and forecast 2023-2028 ($ million)
- Data Table on Middle East and Africa - Market size and forecast 2023-2028 ($ million)
- Chart on Middle East and Africa - Year-over-year growth 2023-2028 (%)
- Data Table on Middle East and Africa - Year-over-year growth 2023-2028 (%)
- 9.7 South America - Market size and forecast 2023-2028
- Chart on South America - Market size and forecast 2023-2028 ($ million)
- Data Table on South America - Market size and forecast 2023-2028 ($ million)
- Chart on South America - Year-over-year growth 2023-2028 (%)
- Data Table on South America - Year-over-year growth 2023-2028 (%)
- 9.8 US - Market size and forecast 2023-2028
- Chart on US - Market size and forecast 2023-2028 ($ million)
- Data Table on US - Market size and forecast 2023-2028 ($ million)
- Chart on US - Year-over-year growth 2023-2028 (%)
- Data Table on US - Year-over-year growth 2023-2028 (%)
- 9.9 Japan - Market size and forecast 2023-2028
- Chart on Japan - Market size and forecast 2023-2028 ($ million)
- Data Table on Japan - Market size and forecast 2023-2028 ($ million)
- Chart on Japan - Year-over-year growth 2023-2028 (%)
- Data Table on Japan - Year-over-year growth 2023-2028 (%)
- 9.10 Germany - Market size and forecast 2023-2028
- Chart on Germany - Market size and forecast 2023-2028 ($ million)
- Data Table on Germany - Market size and forecast 2023-2028 ($ million)
- Chart on Germany - Year-over-year growth 2023-2028 (%)
- Data Table on Germany - Year-over-year growth 2023-2028 (%)
- 9.11 UK - Market size and forecast 2023-2028
- Chart on UK - Market size and forecast 2023-2028 ($ million)
- Data Table on UK - Market size and forecast 2023-2028 ($ million)
- Chart on UK - Year-over-year growth 2023-2028 (%)
- Data Table on UK - Year-over-year growth 2023-2028 (%)
- 9.12 China - Market size and forecast 2023-2028
- Chart on China - Market size and forecast 2023-2028 ($ million)
- Data Table on China - Market size and forecast 2023-2028 ($ million)
- Chart on China - Year-over-year growth 2023-2028 (%)
- Data Table on China - Year-over-year growth 2023-2028 (%)
- 9.13 Market opportunity By Geographical Landscape
- Market opportunity By Geographical Landscape ($ million)
- Data Tables on Market opportunity By Geographical Landscape ($ million)
10 Drivers, Challenges, and Opportunity/Restraints
- 10.1 Market drivers
- 10.2 Market challenges
- 10.3 Impact of drivers and challenges
- Impact of drivers and challenges in 2023 and 2028
- 10.4 Market opportunities/restraints
11 Competitive Landscape
- 11.1 Overview
- 11.2 Competitive Landscape
- Overview on criticality of inputs and factors of differentiation
- 11.3 Landscape disruption
- Overview on factors of disruption
- 11.4 Industry risks
- Impact of key risks on business
12 Competitive Analysis
- 12.1 Companies profiled
- Companies covered
- 12.2 Market positioning of companies
- Matrix on companies position and classification
- 12.3 Adesso Inc.
- Adesso Inc. - Overview
- Adesso Inc. - Product / Service
- Adesso Inc. - Key offerings
- 12.4 ADLINK Technology Inc.
- ADLINK Technology Inc. - Overview
- ADLINK Technology Inc. - Business segments
- ADLINK Technology Inc. - Key offerings
- ADLINK Technology Inc. - Segment focus
- 12.5 Eastman Kodak Co.
- Eastman Kodak Co. - Overview
- Eastman Kodak Co. - Business segments
- Eastman Kodak Co. - Key news
- Eastman Kodak Co. - Key offerings
- Eastman Kodak Co. - Segment focus
- 12.6 GAOMON
- GAOMON - Overview
- GAOMON - Product / Service
- GAOMON - Key offerings
- 12.7 Hanvon Ugee Technology Co. Ltd.
- Hanvon Ugee Technology Co. Ltd. - Overview
- Hanvon Ugee Technology Co. Ltd. - Product / Service
- Hanvon Ugee Technology Co. Ltd. - Key offerings
- 12.8 Immersion
- Immersion - Overview
- Immersion - Product / Service
- Immersion - Key offerings
- 12.9 Parblo
- Parblo - Overview
- Parblo - Product / Service
- Parblo - Key offerings
- 12.10 Samsung Electronics Co. Ltd.
- Samsung Electronics Co. Ltd. - Overview
- Samsung Electronics Co. Ltd. - Business segments
- Samsung Electronics Co. Ltd. - Key news
- Samsung Electronics Co. Ltd. - Key offerings
- Samsung Electronics Co. Ltd. - Segment focus
- 12.11 Shenzhen Hanbang Mechanical and Electrical Co. Ltd.
- Shenzhen Hanbang Mechanical and Electrical Co. Ltd. - Overview
- Shenzhen Hanbang Mechanical and Electrical Co. Ltd. - Product / Service
- Shenzhen Hanbang Mechanical and Electrical Co. Ltd. - Key offerings
- 12.12 Shenzhen Huion Trend Technology Co. Ltd.
- Shenzhen Huion Trend Technology Co. Ltd. - Overview
- Shenzhen Huion Trend Technology Co. Ltd. - Product / Service
- Shenzhen Huion Trend Technology Co. Ltd. - Key offerings
- 12.13 Shenzhen Upin Technology Co. Ltd.
- Shenzhen Upin Technology Co. Ltd. - Overview
- Shenzhen Upin Technology Co. Ltd. - Product / Service
- Shenzhen Upin Technology Co. Ltd. - Key offerings
- 12.14 TurcomUSA
- TurcomUSA - Overview
- TurcomUSA - Product / Service
- TurcomUSA - Key offerings
- 12.15 UC Logic Technology Co.
- UC Logic Technology Co. - Overview
- UC Logic Technology Co. - Product / Service
- UC Logic Technology Co. - Key offerings
- 12.16 ViewSonic Corp.
- ViewSonic Corp. - Overview
- ViewSonic Corp. - Product / Service
- ViewSonic Corp. - Key offerings
- 12.17 Wacom Co. Ltd.
- Wacom Co. Ltd. - Overview
- Wacom Co. Ltd. - Business segments
- Wacom Co. Ltd. - Key news
- Wacom Co. Ltd. - Key offerings
- Wacom Co. Ltd. - Segment focus
13 Appendix
- 13.1 Scope of the report
- 13.2 Inclusions and exclusions checklist
- Inclusions checklist
- Exclusions checklist
- 13.3 Currency conversion rates for US$
- Currency conversion rates for US$
- 13.4 Research methodology
- Research methodology
- 13.5 Data procurement
- Information sources
- 13.6 Data validation
- Data validation
- 13.7 Validation techniques employed for market sizing
- Validation techniques employed for market sizing
- 13.8 Data synthesis
- Data synthesis
- 13.9 360 degree market analysis
- 360 degree market analysis
- 13.10 List of abbreviations
- List of abbreviations

