|
|
市場調査レポート
商品コード
1557426
水素電解槽の世界市場 2024-2028Global Hydrogen Electrolyzers Market 2024-2028 |
||||||
|
|||||||
カスタマイズ可能
|
|||||||

| 水素電解槽の世界市場 2024-2028 |
|
出版日: 2024年08月13日
発行: TechNavio
ページ情報: 英文 172 Pages
納期: 即納可能
|

全表示
- 概要
- 図表
- 目次
水素電解槽市場は2023-2028年に9,490万米ドル、予測期間中のCAGRは5.65%で成長すると予測されます。
当レポートでは、水素電解槽市場の全体的な分析、市場規模・予測、動向、成長促進要因、課題、約25のベンダーを網羅したベンダー分析などを掲載しています。
現在の市場シナリオ、最新動向と促進要因、市場環境全体に関する最新分析を提供しています。市場は、自然エネルギーと水素電解槽の統合、燃料電池自動車の採用拡大、産業部門からの水素電解槽需要の高まりによって牽引されています。
| 市場範囲 | |
|---|---|
| 基準年 | 2024 |
| 終了年 | 2028 |
| 予測期間 | 2024-2028 |
| 成長モメンタム | 加速 |
| 前年比2024年 | 5.24% |
| CAGR | 5.65% |
| 増分額 | 9,490万米ドル |
本調査では、今後数年間の水素電解槽市場の成長を促進する主な理由の一つとして、クリーン水素生成に関する戦略的パートナーシップの増加を挙げています。また、製油所でのクリーン水素利用への注目の高まりや、据置型電力分野での燃料電池の利用増加も、市場の大きな需要につながると思われます。
目次
第1章 エグゼクティブサマリー
- 市場概要
第2章 市場情勢
- 市場エコシステム
- 市場の特徴
- バリューチェーン分析
第3章 市場規模の評価
- 市場の定義
- 市場セグメント分析
- 市場規模 2023
- 市場の見通し 2023-2028
第4章 市場規模実績
- 水素電解槽の世界市場 2018-2022
- 容量別セグメント分析 2018-2022
- タイプ別セグメント分析 2018-2022
- 地域別セグメント分析 2018-2022
- 国別セグメント分析 2018-2022
第5章 ファイブフォース分析
- ファイブフォースの要約
- 買い手の交渉力
- 供給企業の交渉力
- 新規参入業者の脅威
- 代替品の脅威
- 競争の脅威
- 市況
第6章 市場セグメンテーション:容量別
- 市場セグメンテーション
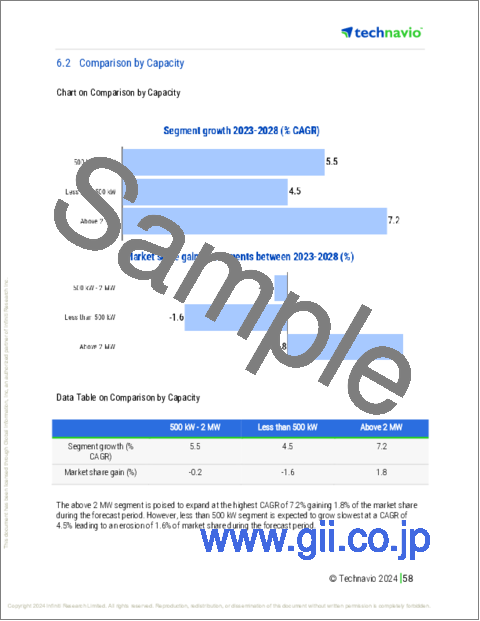
- 比較:容量別
- 500kW~2 MW:市場規模と予測 2023-2028
- 500kW未満:市場規模と予測 2023-2028
- 2MW以上:市場規模と予測 2023-2028
- 市場機会:容量別
第7章 市場セグメンテーション:タイプ別
- 市場セグメンテーション
- 比較:タイプ別
- アルカリ電解装置:市場規模と予測 2023-2028
- PEM電解装置:市場規模と予測 2023-2028
- 市場機会:タイプ別
第8章 顧客情勢
- 顧客情勢の概要
第9章 地域別情勢
- 地域別セグメンテーション
- 地域別比較
- 北米:市場規模と予測 2023-2028
- 欧州:市場規模と予測 2023-2028
- アジア太平洋:市場規模と予測 2023-2028
- 中東・アフリカ:市場規模と予測 2023-2028
- 南米:市場規模と予測 2023-2028
- 米国:市場規模と予測 2023-2028
- ドイツ:市場規模と予測 2023-2028
- スウェーデン:市場規模と予測 2023-2028
- 日本:市場規模と予測 2023-2028
- カナダ:市場規模と予測 2023-2028
- 市場機会:地域情勢別
第10章 促進要因・課題・機会・抑制要因
- 市場促進要因
- 市場の課題
- 促進要因と課題の影響
- 市場の機会・抑制要因
第11章 競合情勢
- 概要
- 競合情勢
- 混乱の状況
- 業界のリスク
第12章 競合分析
- 企業プロファイル
- 企業の市場ポジショニング
- Asahi Kasei Corp.
- Cockerill JingLi Hydrogen
- Enapter S.r.l.
- Frames Energy Systems BV
- Gaztransport and Technigaz SA
- Giner Inc.
- Kobe Steel Ltd.
- McPhy Energy SA
- Nel ASA
- Shandong Saikesaisi Hydrogen Energy Co., Ltd.
- Siemens AG
- SwissHydrogen SA
- Teledyne Technologies Inc.
- TianJin Mainland Hydrogen Equipment
- Yangzhou Zhongdian hydrogen production
第13章 付録
Exhibits:
- Exhibits1: Executive Summary - Chart on Market Overview
- Exhibits2: Executive Summary - Data Table on Market Overview
- Exhibits3: Executive Summary - Chart on Global Market Characteristics
- Exhibits4: Executive Summary - Chart on Market By Geographical Landscape
- Exhibits5: Executive Summary - Chart on Market Segmentation by Capacity
- Exhibits6: Executive Summary - Chart on Market Segmentation by Type
- Exhibits7: Executive Summary - Chart on Incremental Growth
- Exhibits8: Executive Summary - Data Table on Incremental Growth
- Exhibits9: Executive Summary - Chart on Company Market Positioning
- Exhibits10: Parent Market
- Exhibits11: Data Table on - Parent Market
- Exhibits12: Market characteristics analysis
- Exhibits13: Value Chain Analysis
- Exhibits14: Offerings of companies included in the market definition
- Exhibits15: Market segments
- Exhibits16: Chart on Global - Market size and forecast 2023-2028 ($ million)
- Exhibits17: Data Table on Global - Market size and forecast 2023-2028 ($ million)
- Exhibits18: Chart on Global Market: Year-over-year growth 2023-2028 (%)
- Exhibits19: Data Table on Global Market: Year-over-year growth 2023-2028 (%)
- Exhibits20: Historic Market Size - Data Table on Global Hydrogen Electrolyzers Market 2018 - 2022 ($ million)
- Exhibits21: Historic Market Size - Capacity Segment 2018 - 2022 ($ million)
- Exhibits22: Historic Market Size - Type Segment 2018 - 2022 ($ million)
- Exhibits23: Historic Market Size - Geography Segment 2018 - 2022 ($ million)
- Exhibits24: Historic Market Size - Country Segment 2018 - 2022 ($ million)
- Exhibits25: Five forces analysis - Comparison between 2023 and 2028
- Exhibits26: Bargaining power of buyers - Impact of key factors 2023 and 2028
- Exhibits27: Bargaining power of suppliers - Impact of key factors in 2023 and 2028
- Exhibits28: Threat of new entrants - Impact of key factors in 2023 and 2028
- Exhibits29: Threat of substitutes - Impact of key factors in 2023 and 2028
- Exhibits30: Threat of rivalry - Impact of key factors in 2023 and 2028
- Exhibits31: Chart on Market condition - Five forces 2023 and 2028
- Exhibits32: Chart on Capacity - Market share 2023-2028 (%)
- Exhibits33: Data Table on Capacity - Market share 2023-2028 (%)
- Exhibits34: Chart on Comparison by Capacity
- Exhibits35: Data Table on Comparison by Capacity
- Exhibits36: Chart on 500 kW - 2 MW - Market size and forecast 2023-2028 ($ million)
- Exhibits37: Data Table on 500 kW - 2 MW - Market size and forecast 2023-2028 ($ million)
- Exhibits38: Chart on 500 kW - 2 MW - Year-over-year growth 2023-2028 (%)
- Exhibits39: Data Table on 500 kW - 2 MW - Year-over-year growth 2023-2028 (%)
- Exhibits40: Chart on Less than 500 kW - Market size and forecast 2023-2028 ($ million)
- Exhibits41: Data Table on Less than 500 kW - Market size and forecast 2023-2028 ($ million)
- Exhibits42: Chart on Less than 500 kW - Year-over-year growth 2023-2028 (%)
- Exhibits43: Data Table on Less than 500 kW - Year-over-year growth 2023-2028 (%)
- Exhibits44: Chart on Above 2 MW - Market size and forecast 2023-2028 ($ million)
- Exhibits45: Data Table on Above 2 MW - Market size and forecast 2023-2028 ($ million)
- Exhibits46: Chart on Above 2 MW - Year-over-year growth 2023-2028 (%)
- Exhibits47: Data Table on Above 2 MW - Year-over-year growth 2023-2028 (%)
- Exhibits48: Market opportunity by Capacity ($ million)
- Exhibits49: Data Table on Market opportunity by Capacity ($ million)
- Exhibits50: Chart on Type - Market share 2023-2028 (%)
- Exhibits51: Data Table on Type - Market share 2023-2028 (%)
- Exhibits52: Chart on Comparison by Type
- Exhibits53: Data Table on Comparison by Type
- Exhibits54: Chart on Alkaline electrolyzers - Market size and forecast 2023-2028 ($ million)
- Exhibits55: Data Table on Alkaline electrolyzers - Market size and forecast 2023-2028 ($ million)
- Exhibits56: Chart on Alkaline electrolyzers - Year-over-year growth 2023-2028 (%)
- Exhibits57: Data Table on Alkaline electrolyzers - Year-over-year growth 2023-2028 (%)
- Exhibits58: Chart on PEM electrolyzers - Market size and forecast 2023-2028 ($ million)
- Exhibits59: Data Table on PEM electrolyzers - Market size and forecast 2023-2028 ($ million)
- Exhibits60: Chart on PEM electrolyzers - Year-over-year growth 2023-2028 (%)
- Exhibits61: Data Table on PEM electrolyzers - Year-over-year growth 2023-2028 (%)
- Exhibits62: Market opportunity by Type ($ million)
- Exhibits63: Data Table on Market opportunity by Type ($ million)
- Exhibits64: Analysis of price sensitivity, lifecycle, customer purchase basket, adoption rates, and purchase criteria
- Exhibits65: Chart on Market share By Geographical Landscape 2023-2028 (%)
- Exhibits66: Data Table on Market share By Geographical Landscape 2023-2028 (%)
- Exhibits67: Chart on Geographic comparison
- Exhibits68: Data Table on Geographic comparison
- Exhibits69: Chart on North America - Market size and forecast 2023-2028 ($ million)
- Exhibits70: Data Table on North America - Market size and forecast 2023-2028 ($ million)
- Exhibits71: Chart on North America - Year-over-year growth 2023-2028 (%)
- Exhibits72: Data Table on North America - Year-over-year growth 2023-2028 (%)
- Exhibits73: Chart on Europe - Market size and forecast 2023-2028 ($ million)
- Exhibits74: Data Table on Europe - Market size and forecast 2023-2028 ($ million)
- Exhibits75: Chart on Europe - Year-over-year growth 2023-2028 (%)
- Exhibits76: Data Table on Europe - Year-over-year growth 2023-2028 (%)
- Exhibits77: Chart on APAC - Market size and forecast 2023-2028 ($ million)
- Exhibits78: Data Table on APAC - Market size and forecast 2023-2028 ($ million)
- Exhibits79: Chart on APAC - Year-over-year growth 2023-2028 (%)
- Exhibits80: Data Table on APAC - Year-over-year growth 2023-2028 (%)
- Exhibits81: Chart on Middle East and Africa - Market size and forecast 2023-2028 ($ million)
- Exhibits82: Data Table on Middle East and Africa - Market size and forecast 2023-2028 ($ million)
- Exhibits83: Chart on Middle East and Africa - Year-over-year growth 2023-2028 (%)
- Exhibits84: Data Table on Middle East and Africa - Year-over-year growth 2023-2028 (%)
- Exhibits85: Chart on South America - Market size and forecast 2023-2028 ($ million)
- Exhibits86: Data Table on South America - Market size and forecast 2023-2028 ($ million)
- Exhibits87: Chart on South America - Year-over-year growth 2023-2028 (%)
- Exhibits88: Data Table on South America - Year-over-year growth 2023-2028 (%)
- Exhibits89: Chart on US - Market size and forecast 2023-2028 ($ million)
- Exhibits90: Data Table on US - Market size and forecast 2023-2028 ($ million)
- Exhibits91: Chart on US - Year-over-year growth 2023-2028 (%)
- Exhibits92: Data Table on US - Year-over-year growth 2023-2028 (%)
- Exhibits93: Chart on Germany - Market size and forecast 2023-2028 ($ million)
- Exhibits94: Data Table on Germany - Market size and forecast 2023-2028 ($ million)
- Exhibits95: Chart on Germany - Year-over-year growth 2023-2028 (%)
- Exhibits96: Data Table on Germany - Year-over-year growth 2023-2028 (%)
- Exhibits97: Chart on Sweden - Market size and forecast 2023-2028 ($ million)
- Exhibits98: Data Table on Sweden - Market size and forecast 2023-2028 ($ million)
- Exhibits99: Chart on Sweden - Year-over-year growth 2023-2028 (%)
- Exhibits100: Data Table on Sweden - Year-over-year growth 2023-2028 (%)
- Exhibits101: Chart on Japan - Market size and forecast 2023-2028 ($ million)
- Exhibits102: Data Table on Japan - Market size and forecast 2023-2028 ($ million)
- Exhibits103: Chart on Japan - Year-over-year growth 2023-2028 (%)
- Exhibits104: Data Table on Japan - Year-over-year growth 2023-2028 (%)
- Exhibits105: Chart on Canada - Market size and forecast 2023-2028 ($ million)
- Exhibits106: Data Table on Canada - Market size and forecast 2023-2028 ($ million)
- Exhibits107: Chart on Canada - Year-over-year growth 2023-2028 (%)
- Exhibits108: Data Table on Canada - Year-over-year growth 2023-2028 (%)
- Exhibits109: Market opportunity By Geographical Landscape ($ million)
- Exhibits110: Data Tables on Market opportunity By Geographical Landscape ($ million)
- Exhibits111: Impact of drivers and challenges in 2023 and 2028
- Exhibits112: Overview on criticality of inputs and factors of differentiation
- Exhibits113: Overview on factors of disruption
- Exhibits114: Impact of key risks on business
- Exhibits115: Companies covered
- Exhibits116: Matrix on companies position and classification
- Exhibits117: Asahi Kasei Corp. - Overview
- Exhibits118: Asahi Kasei Corp. - Business segments
- Exhibits119: Asahi Kasei Corp. - Key news
- Exhibits120: Asahi Kasei Corp. - Key offerings
- Exhibits121: Asahi Kasei Corp. - Segment focus
- Exhibits122: Cockerill JingLi Hydrogen - Overview
- Exhibits123: Cockerill JingLi Hydrogen - Product / Service
- Exhibits124: Cockerill JingLi Hydrogen - Key offerings
- Exhibits125: Enapter S.r.l. - Overview
- Exhibits126: Enapter S.r.l. - Product / Service
- Exhibits127: Enapter S.r.l. - Key offerings
- Exhibits128: Frames Energy Systems BV - Overview
- Exhibits129: Frames Energy Systems BV - Product / Service
- Exhibits130: Frames Energy Systems BV - Key offerings
- Exhibits131: Gaztransport and Technigaz SA - Overview
- Exhibits132: Gaztransport and Technigaz SA - Business segments
- Exhibits133: Gaztransport and Technigaz SA - Key news
- Exhibits134: Gaztransport and Technigaz SA - Key offerings
- Exhibits135: Gaztransport and Technigaz SA - Segment focus
- Exhibits136: Giner Inc. - Overview
- Exhibits137: Giner Inc. - Product / Service
- Exhibits138: Giner Inc. - Key offerings
- Exhibits139: Kobe Steel Ltd. - Overview
- Exhibits140: Kobe Steel Ltd. - Business segments
- Exhibits141: Kobe Steel Ltd. - Key news
- Exhibits142: Kobe Steel Ltd. - Key offerings
- Exhibits143: Kobe Steel Ltd. - Segment focus
- Exhibits144: McPhy Energy SA - Overview
- Exhibits145: McPhy Energy SA - Product / Service
- Exhibits146: McPhy Energy SA - Key news
- Exhibits147: McPhy Energy SA - Key offerings
- Exhibits148: Nel ASA - Overview
- Exhibits149: Nel ASA - Business segments
- Exhibits150: Nel ASA - Key offerings
- Exhibits151: Nel ASA - Segment focus
- Exhibits152: Shandong Saikesaisi Hydrogen Energy Co., Ltd. - Overview
- Exhibits153: Shandong Saikesaisi Hydrogen Energy Co., Ltd. - Product / Service
- Exhibits154: Shandong Saikesaisi Hydrogen Energy Co., Ltd. - Key offerings
- Exhibits155: Siemens AG - Overview
- Exhibits156: Siemens AG - Business segments
- Exhibits157: Siemens AG - Key news
- Exhibits158: Siemens AG - Key offerings
- Exhibits159: Siemens AG - Segment focus
- Exhibits160: SwissHydrogen SA - Overview
- Exhibits161: SwissHydrogen SA - Product / Service
- Exhibits162: SwissHydrogen SA - Key offerings
- Exhibits163: Teledyne Technologies Inc. - Overview
- Exhibits164: Teledyne Technologies Inc. - Business segments
- Exhibits165: Teledyne Technologies Inc. - Key news
- Exhibits166: Teledyne Technologies Inc. - Key offerings
- Exhibits167: Teledyne Technologies Inc. - Segment focus
- Exhibits168: TianJin Mainland Hydrogen Equipment - Overview
- Exhibits169: TianJin Mainland Hydrogen Equipment - Product / Service
- Exhibits170: TianJin Mainland Hydrogen Equipment - Key offerings
- Exhibits171: Yangzhou Zhongdian hydrogen production - Overview
- Exhibits172: Yangzhou Zhongdian hydrogen production - Product / Service
- Exhibits173: Yangzhou Zhongdian hydrogen production - Key offerings
- Exhibits174: Inclusions checklist
- Exhibits175: Exclusions checklist
- Exhibits176: Currency conversion rates for US$
- Exhibits177: Research methodology
- Exhibits178: Information sources
- Exhibits179: Data validation
- Exhibits180: Validation techniques employed for market sizing
- Exhibits181: Data synthesis
- Exhibits182: 360 degree market analysis
- Exhibits183: List of abbreviations
The hydrogen electrolyzers market is forecasted to grow by USD 94.9 mn during 2023-2028, accelerating at a CAGR of 5.65% during the forecast period. The report on the hydrogen electrolyzers market provides a holistic analysis, market size and forecast, trends, growth drivers, and challenges, as well as vendor analysis covering around 25 vendors.
The report offers an up-to-date analysis regarding the current market scenario, the latest trends and drivers, and the overall market environment. The market is driven by integration of renewables with hydrogen electrolyzers, growing adoption of fuel cell-powered vehicles, and rising demand for hydrogen electrolyzers from industrial sector.
Technavio's hydrogen electrolyzers market is segmented as below:
| Market Scope | |
|---|---|
| Base Year | 2024 |
| End Year | 2028 |
| Series Year | 2024-2028 |
| Growth Momentum | Accelerate |
| YOY 2024 | 5.24% |
| CAGR | 5.65% |
| Incremental Value | $94.9 mn |
By Capacity
- 500 kW - 2 MW
- Less than 500 kW
- Above 2 MW
By Type
- Alkaline electrolyzers
- PEM electrolyzers
By Geographical Landscape
- North America
- Europe
- APAC
- Middle East and Africa
- South America
This study identifies the increasing strategic partnerships for clean hydrogen generation as one of the prime reasons driving the hydrogen electrolyzers market growth during the next few years. Also, growing focus on using clean hydrogen in refineries and rising usage of fuel cells in stationary power sector will lead to sizable demand in the market.
The report on the hydrogen electrolyzers market covers the following areas:
- Hydrogen electrolyzers market sizing
- Hydrogen electrolyzers market forecast
- Hydrogen electrolyzers market industry analysis
The robust vendor analysis is designed to help clients improve their market position, and in line with this, this report provides a detailed analysis of several leading hydrogen electrolyzers market vendors that include Asahi Kasei Corp., Cockerill JingLi Hydrogen, Cummins Inc., ELTRA GmbH, Enapter S.r.l., Frames Energy Systems BV, Gaztransport and Technigaz SA, Giner Inc., Hitachi Zosen Corp., Idroenergy Spa, ITM Power PLC, Kobe Steel Ltd., McPhy Energy SA, Nel ASA, Shandong Saikesaisi Hydrogen Energy Co., Ltd., Siemens AG, SwissHydrogen SA, Teledyne Technologies Inc., TianJin Mainland Hydrogen Equipment, and Yangzhou Zhongdian hydrogen production. Also, the hydrogen electrolyzers market analysis report includes information on upcoming trends and challenges that will influence market growth. This is to help companies strategize and leverage all forthcoming growth opportunities.
The study was conducted using an objective combination of primary and secondary information including inputs from key participants in the industry. The report contains a comprehensive market and vendor landscape in addition to an analysis of the key vendors.
The publisher presents a detailed picture of the market by the way of study, synthesis, and summation of data from multiple sources by an analysis of key parameters such as profit, pricing, competition, and promotions. It presents various market facets by identifying the key industry influencers. The data presented is comprehensive, reliable, and a result of extensive research - both primary and secondary. The market research reports provide a complete competitive landscape and an in-depth vendor selection methodology and analysis using qualitative and quantitative research to forecast the accurate market growth.
Table of Contents
1 Executive Summary
- 1.1 Market overview
- Executive Summary - Chart on Market Overview
- Executive Summary - Data Table on Market Overview
- Executive Summary - Chart on Global Market Characteristics
- Executive Summary - Chart on Market By Geographical Landscape
- Executive Summary - Chart on Market Segmentation by Capacity
- Executive Summary - Chart on Market Segmentation by Type
- Executive Summary - Chart on Incremental Growth
- Executive Summary - Data Table on Incremental Growth
- Executive Summary - Chart on Company Market Positioning
2 Market Landscape
- 2.1 Market ecosystem
- Parent Market
- Data Table on - Parent Market
- 2.2 Market characteristics
- Market characteristics analysis
- 2.3 Value chain analysis
- Value Chain Analysis
3 Market Sizing
- 3.1 Market definition
- Offerings of companies included in the market definition
- 3.2 Market segment analysis
- Market segments
- 3.3 Market size 2023
- 3.4 Market outlook: Forecast for 2023-2028
- Chart on Global - Market size and forecast 2023-2028 ($ million)
- Data Table on Global - Market size and forecast 2023-2028 ($ million)
- Chart on Global Market: Year-over-year growth 2023-2028 (%)
- Data Table on Global Market: Year-over-year growth 2023-2028 (%)
4 Historic Market Size
- 4.1 Global Hydrogen Electrolyzers Market 2018 - 2022
- Historic Market Size - Data Table on Global Hydrogen Electrolyzers Market 2018 - 2022 ($ million)
- 4.2 Capacity segment analysis 2018 - 2022
- Historic Market Size - Capacity Segment 2018 - 2022 ($ million)
- 4.3 Type segment analysis 2018 - 2022
- Historic Market Size - Type Segment 2018 - 2022 ($ million)
- 4.4 Geography segment analysis 2018 - 2022
- Historic Market Size - Geography Segment 2018 - 2022 ($ million)
- 4.5 Country segment analysis 2018 - 2022
- Historic Market Size - Country Segment 2018 - 2022 ($ million)
5 Five Forces Analysis
- 5.1 Five forces summary
- Five forces analysis - Comparison between 2023 and 2028
- 5.2 Bargaining power of buyers
- Bargaining power of buyers - Impact of key factors 2023 and 2028
- 5.3 Bargaining power of suppliers
- Bargaining power of suppliers - Impact of key factors in 2023 and 2028
- 5.4 Threat of new entrants
- Threat of new entrants - Impact of key factors in 2023 and 2028
- 5.5 Threat of substitutes
- Threat of substitutes - Impact of key factors in 2023 and 2028
- 5.6 Threat of rivalry
- Threat of rivalry - Impact of key factors in 2023 and 2028
- 5.7 Market condition
- Chart on Market condition - Five forces 2023 and 2028
6 Market Segmentation by Capacity
- 6.1 Market segments
- Chart on Capacity - Market share 2023-2028 (%)
- Data Table on Capacity - Market share 2023-2028 (%)
- 6.2 Comparison by Capacity
- Chart on Comparison by Capacity
- Data Table on Comparison by Capacity
- 6.3 500 kW - 2 MW - Market size and forecast 2023-2028
- Chart on 500 kW - 2 MW - Market size and forecast 2023-2028 ($ million)
- Data Table on 500 kW - 2 MW - Market size and forecast 2023-2028 ($ million)
- Chart on 500 kW - 2 MW - Year-over-year growth 2023-2028 (%)
- Data Table on 500 kW - 2 MW - Year-over-year growth 2023-2028 (%)
- 6.4 Less than 500 kW - Market size and forecast 2023-2028
- Chart on Less than 500 kW - Market size and forecast 2023-2028 ($ million)
- Data Table on Less than 500 kW - Market size and forecast 2023-2028 ($ million)
- Chart on Less than 500 kW - Year-over-year growth 2023-2028 (%)
- Data Table on Less than 500 kW - Year-over-year growth 2023-2028 (%)
- 6.5 Above 2 MW - Market size and forecast 2023-2028
- Chart on Above 2 MW - Market size and forecast 2023-2028 ($ million)
- Data Table on Above 2 MW - Market size and forecast 2023-2028 ($ million)
- Chart on Above 2 MW - Year-over-year growth 2023-2028 (%)
- Data Table on Above 2 MW - Year-over-year growth 2023-2028 (%)
- 6.6 Market opportunity by Capacity
- Market opportunity by Capacity ($ million)
- Data Table on Market opportunity by Capacity ($ million)
7 Market Segmentation by Type
- 7.1 Market segments
- Chart on Type - Market share 2023-2028 (%)
- Data Table on Type - Market share 2023-2028 (%)
- 7.2 Comparison by Type
- Chart on Comparison by Type
- Data Table on Comparison by Type
- 7.3 Alkaline electrolyzers - Market size and forecast 2023-2028
- Chart on Alkaline electrolyzers - Market size and forecast 2023-2028 ($ million)
- Data Table on Alkaline electrolyzers - Market size and forecast 2023-2028 ($ million)
- Chart on Alkaline electrolyzers - Year-over-year growth 2023-2028 (%)
- Data Table on Alkaline electrolyzers - Year-over-year growth 2023-2028 (%)
- 7.4 PEM electrolyzers - Market size and forecast 2023-2028
- Chart on PEM electrolyzers - Market size and forecast 2023-2028 ($ million)
- Data Table on PEM electrolyzers - Market size and forecast 2023-2028 ($ million)
- Chart on PEM electrolyzers - Year-over-year growth 2023-2028 (%)
- Data Table on PEM electrolyzers - Year-over-year growth 2023-2028 (%)
- 7.5 Market opportunity by Type
- Market opportunity by Type ($ million)
- Data Table on Market opportunity by Type ($ million)
8 Customer Landscape
- 8.1 Customer landscape overview
- Analysis of price sensitivity, lifecycle, customer purchase basket, adoption rates, and purchase criteria
9 Geographic Landscape
- 9.1 Geographic segmentation
- Chart on Market share By Geographical Landscape 2023-2028 (%)
- Data Table on Market share By Geographical Landscape 2023-2028 (%)
- 9.2 Geographic comparison
- Chart on Geographic comparison
- Data Table on Geographic comparison
- 9.3 North America - Market size and forecast 2023-2028
- Chart on North America - Market size and forecast 2023-2028 ($ million)
- Data Table on North America - Market size and forecast 2023-2028 ($ million)
- Chart on North America - Year-over-year growth 2023-2028 (%)
- Data Table on North America - Year-over-year growth 2023-2028 (%)
- 9.4 Europe - Market size and forecast 2023-2028
- Chart on Europe - Market size and forecast 2023-2028 ($ million)
- Data Table on Europe - Market size and forecast 2023-2028 ($ million)
- Chart on Europe - Year-over-year growth 2023-2028 (%)
- Data Table on Europe - Year-over-year growth 2023-2028 (%)
- 9.5 APAC - Market size and forecast 2023-2028
- Chart on APAC - Market size and forecast 2023-2028 ($ million)
- Data Table on APAC - Market size and forecast 2023-2028 ($ million)
- Chart on APAC - Year-over-year growth 2023-2028 (%)
- Data Table on APAC - Year-over-year growth 2023-2028 (%)
- 9.6 Middle East and Africa - Market size and forecast 2023-2028
- Chart on Middle East and Africa - Market size and forecast 2023-2028 ($ million)
- Data Table on Middle East and Africa - Market size and forecast 2023-2028 ($ million)
- Chart on Middle East and Africa - Year-over-year growth 2023-2028 (%)
- Data Table on Middle East and Africa - Year-over-year growth 2023-2028 (%)
- 9.7 South America - Market size and forecast 2023-2028
- Chart on South America - Market size and forecast 2023-2028 ($ million)
- Data Table on South America - Market size and forecast 2023-2028 ($ million)
- Chart on South America - Year-over-year growth 2023-2028 (%)
- Data Table on South America - Year-over-year growth 2023-2028 (%)
- 9.8 US - Market size and forecast 2023-2028
- Chart on US - Market size and forecast 2023-2028 ($ million)
- Data Table on US - Market size and forecast 2023-2028 ($ million)
- Chart on US - Year-over-year growth 2023-2028 (%)
- Data Table on US - Year-over-year growth 2023-2028 (%)
- 9.9 Germany - Market size and forecast 2023-2028
- Chart on Germany - Market size and forecast 2023-2028 ($ million)
- Data Table on Germany - Market size and forecast 2023-2028 ($ million)
- Chart on Germany - Year-over-year growth 2023-2028 (%)
- Data Table on Germany - Year-over-year growth 2023-2028 (%)
- 9.10 Sweden - Market size and forecast 2023-2028
- Chart on Sweden - Market size and forecast 2023-2028 ($ million)
- Data Table on Sweden - Market size and forecast 2023-2028 ($ million)
- Chart on Sweden - Year-over-year growth 2023-2028 (%)
- Data Table on Sweden - Year-over-year growth 2023-2028 (%)
- 9.11 Japan - Market size and forecast 2023-2028
- Chart on Japan - Market size and forecast 2023-2028 ($ million)
- Data Table on Japan - Market size and forecast 2023-2028 ($ million)
- Chart on Japan - Year-over-year growth 2023-2028 (%)
- Data Table on Japan - Year-over-year growth 2023-2028 (%)
- 9.12 Canada - Market size and forecast 2023-2028
- Chart on Canada - Market size and forecast 2023-2028 ($ million)
- Data Table on Canada - Market size and forecast 2023-2028 ($ million)
- Chart on Canada - Year-over-year growth 2023-2028 (%)
- Data Table on Canada - Year-over-year growth 2023-2028 (%)
- 9.13 Market opportunity By Geographical Landscape
- Market opportunity By Geographical Landscape ($ million)
- Data Tables on Market opportunity By Geographical Landscape ($ million)
10 Drivers, Challenges, and Opportunity/Restraints
- 10.1 Market drivers
- 10.2 Market challenges
- 10.3 Impact of drivers and challenges
- Impact of drivers and challenges in 2023 and 2028
- 10.4 Market opportunities/restraints
11 Competitive Landscape
- 11.1 Overview
- 11.2 Competitive Landscape
- Overview on criticality of inputs and factors of differentiation
- 11.3 Landscape disruption
- Overview on factors of disruption
- 11.4 Industry risks
- Impact of key risks on business
12 Competitive Analysis
- 12.1 Companies profiled
- Companies covered
- 12.2 Market positioning of companies
- Matrix on companies position and classification
- 12.3 Asahi Kasei Corp.
- Asahi Kasei Corp. - Overview
- Asahi Kasei Corp. - Business segments
- Asahi Kasei Corp. - Key news
- Asahi Kasei Corp. - Key offerings
- Asahi Kasei Corp. - Segment focus
- 12.4 Cockerill JingLi Hydrogen
- Cockerill JingLi Hydrogen - Overview
- Cockerill JingLi Hydrogen - Product / Service
- Cockerill JingLi Hydrogen - Key offerings
- 12.5 Enapter S.r.l.
- Enapter S.r.l. - Overview
- Enapter S.r.l. - Product / Service
- Enapter S.r.l. - Key offerings
- 12.6 Frames Energy Systems BV
- Frames Energy Systems BV - Overview
- Frames Energy Systems BV - Product / Service
- Frames Energy Systems BV - Key offerings
- 12.7 Gaztransport and Technigaz SA
- Gaztransport and Technigaz SA - Overview
- Gaztransport and Technigaz SA - Business segments
- Gaztransport and Technigaz SA - Key news
- Gaztransport and Technigaz SA - Key offerings
- Gaztransport and Technigaz SA - Segment focus
- 12.8 Giner Inc.
- Giner Inc. - Overview
- Giner Inc. - Product / Service
- Giner Inc. - Key offerings
- 12.9 Kobe Steel Ltd.
- Kobe Steel Ltd. - Overview
- Kobe Steel Ltd. - Business segments
- Kobe Steel Ltd. - Key news
- Kobe Steel Ltd. - Key offerings
- Kobe Steel Ltd. - Segment focus
- 12.10 McPhy Energy SA
- McPhy Energy SA - Overview
- McPhy Energy SA - Product / Service
- McPhy Energy SA - Key news
- McPhy Energy SA - Key offerings
- 12.11 Nel ASA
- Nel ASA - Overview
- Nel ASA - Business segments
- Nel ASA - Key offerings
- Nel ASA - Segment focus
- 12.12 Shandong Saikesaisi Hydrogen Energy Co., Ltd.
- Shandong Saikesaisi Hydrogen Energy Co., Ltd. - Overview
- Shandong Saikesaisi Hydrogen Energy Co., Ltd. - Product / Service
- Shandong Saikesaisi Hydrogen Energy Co., Ltd. - Key offerings
- 12.13 Siemens AG
- Siemens AG - Overview
- Siemens AG - Business segments
- Siemens AG - Key news
- Siemens AG - Key offerings
- Siemens AG - Segment focus
- 12.14 SwissHydrogen SA
- SwissHydrogen SA - Overview
- SwissHydrogen SA - Product / Service
- SwissHydrogen SA - Key offerings
- 12.15 Teledyne Technologies Inc.
- Teledyne Technologies Inc. - Overview
- Teledyne Technologies Inc. - Business segments
- Teledyne Technologies Inc. - Key news
- Teledyne Technologies Inc. - Key offerings
- Teledyne Technologies Inc. - Segment focus
- 12.16 TianJin Mainland Hydrogen Equipment
- TianJin Mainland Hydrogen Equipment - Overview
- TianJin Mainland Hydrogen Equipment - Product / Service
- TianJin Mainland Hydrogen Equipment - Key offerings
- 12.17 Yangzhou Zhongdian hydrogen production
- Yangzhou Zhongdian hydrogen production - Overview
- Yangzhou Zhongdian hydrogen production - Product / Service
- Yangzhou Zhongdian hydrogen production - Key offerings
13 Appendix
- 13.1 Scope of the report
- 13.2 Inclusions and exclusions checklist
- Inclusions checklist
- Exclusions checklist
- 13.3 Currency conversion rates for US$
- Currency conversion rates for US$
- 13.4 Research methodology
- Research methodology
- 13.5 Data procurement
- Information sources
- 13.6 Data validation
- Data validation
- 13.7 Validation techniques employed for market sizing
- Validation techniques employed for market sizing
- 13.8 Data synthesis
- Data synthesis
- 13.9 360 degree market analysis
- 360 degree market analysis
- 13.10 List of abbreviations
- List of abbreviations

