|
|
市場調査レポート
商品コード
1530185
水素電解槽の市場規模、シェア、動向分析レポート:技術別、用途別、定格出力別、地域別、セグメント予測、2024年~2030年Hydrogen Electrolyzer Market Size, Share & Trends Analysis Report By Technology (Alkaline, Solid Oxide Electrolyzer), By Application, By Power Rating, By Region, And Segment Forecasts, 2024 - 2030 |
||||||
|
|||||||
カスタマイズ可能
|
|||||||

| 水素電解槽の市場規模、シェア、動向分析レポート:技術別、用途別、定格出力別、地域別、セグメント予測、2024年~2030年 |
|
出版日: 2024年07月12日
発行: Grand View Research
ページ情報: 英文 120 Pages
納期: 2~10営業日
|

全表示
- 概要
- 図表
- 目次
水素電解槽の市場規模・動向
世界の水素電解槽市場は、2023年に5億1,780万米ドルと推定され、2024~2030年にかけて98.1%のCAGRで成長すると予測されています。この市場は、サステイナブルエネルギーソリューションへの記念碑的なシフトの最前線に立っています。この評価は、気候変動との闘いと世界の炭素排出量削減の差し迫った必要性に後押しされ、グリーンエネルギーへの移行における主要参入企業として水素の重要性が浮上していることを強調するものです。
世界各国政府は、水素を含むクリーンエネルギー技術の導入を促進するため、厳格な政策を実施し、インセンティブを提供するようになっています。このような規制の後押しと、水素インフラに対する官民の大規模な投資とが相まって、市場の急速な成長が見込まれています。再生可能エネルギー源からグリーン水素を製造する上で重要な役割を果たす水素電解槽は、この世界のエネルギー転換において不可欠なツールとして支持を集めています。
技術の進歩が市場を大きく後押しし、水素製造をより効率的でコスト効率の高いものにしています。材料、設計、エンジニアリングの絶え間ない改善により、電解槽の性能と拡大性が向上し、輸送、工業プロセス、エネルギー貯蔵など、さまざまなセグメントでの採用が促進されています。風力発電や太陽光発電のような再生可能エネルギー源と水素製造の統合は、特に大きな変革をもたらしています。
余剰の再生可能エネルギーを水素製造に利用することで、エネルギー貯蔵や送電網の安定性に関する課題が効果的に解決され、より強靭でサステイナブルエネルギーシステムへの道が開かれます。水素と再生可能エネルギーのこの相乗効果は、クリーンエネルギー技術の広範な採用を支援するだけでなく、カーボンニュートラルの未来を実現する上で水素電解槽が果たす重要な役割を強化します。市場が進化し続ける中、水素電解槽は世界のエネルギー展望の中心的存在となり、イノベーションを促進し、環境的にサステイナブルエネルギー生態系を育成する態勢を整えています。
水素電解槽の世界市場レポートセグメンテーション
本レポートでは、世界、地域、国別レベルでの収益成長を予測し、2018~2030年の各サブセグメントにおける最新動向の分析を提供しています。この調査において、Grand View Research, Inc.は世界の水素電解槽市場を技術、用途、定格出力、地域に基づいてセグメント化しています。
目次
第1章 調査手法と範囲
第2章 エグゼクティブサマリー
第3章 水素電解槽市場の変数、動向、範囲
- 市場系統の展望
- 浸透と成長の展望のマッピング
- 業界バリューチェーン分析
- 技術フレームワーク
- 規制の枠組み
- 標準とコンプライアンス
- 規制影響分析
- 市場力学
- 市場促進要因分析
- 市場抑制要因分析
- 市場課題分析
- 市場機会分析
- ビジネス環境分析
- 業界分析-ポーターのファイブフォース分析
- 業界分析-PESTLE分析
- 水素電解槽の新たな動向と技術
第4章 水素電解槽市場:技術別、推定・動向分析
- 定義と範囲
- 技術変動分析と市場シェア、2023年と2030年
- アルカリ電解装置(AE)
- プロトン交換膜(PEM)
- 固体酸化物電解装置
- 陰イオン交換膜(AEM)
第5章 水素電解槽市場:用途別、推定・動向分析
- 定義と範囲
- 用途変動分析と市場シェア、2023年と2030年
- エネルギー
- モビリティ
- 産業
- グリッドインジェクション
第6章 水素電解槽市場:定格出力別、推定・動向分析
- 定義と範囲
- 定格出力変動分析と市場シェア、2023年と2030年
- 500kW以下
- 500~2,000KW
- 2,000KW以上
第7章 水素電解槽市場:地域別、推定・動向分析
- 主要ポイント
- 地域変動分析と市場シェア、2023年と2030年
- 北米
- 市場推定・予測、2018~2030年
- 米国
- カナダ
- メキシコ
- 欧州
- 市場推定・予測、2018~2030年
- ドイツ
- 英国
- フランス
- イタリア
- ノルウェー
- ロシア
- アジア太平洋
- 市場推定・予測、2018~2030年
- 中国
- インド
- 日本
- オーストラリア
- 中南米
- 市場推定・予測、2018~2030年
- ブラジル
- アルゼンチン
- 中東・アフリカ
- 市場推定・予測、2018~2030年
- カタール
- サウジアラビア
- 南アフリカ
- クウェート
第8章 競合情勢
- 主要参入企業と最近の動向、そして業界への影響
- 主要企業/競合の分類(主要イノベーター、市場リーダー、新興企業)
- 主要コンポーネントサプライヤーとチャネルパートナーの一覧
- 企業の市場シェアとポジション分析、2023年
- 企業ヒートマップ分析
- 競合ダッシュボード分析
- 戦略マッピング
- 拡大
- コラボレーション/パートナーシップ/契約
- 新しい用途におけるリリース
- 合併と買収
- 研究開発
- その他
- 潜在顧客リスト、材料別
第9章 企業リスト/プロファイル
- thyssenkrupp nucera
- John Cockerill
- Nel ASA
- Plug Power Inc.
- Siemens Energy
- Enapter S.r.l.
- Cummins Inc.
- ITM Power
- McPhy Energy S.A.
- Topsoe
第10章 戦略的推奨事項/アナリストの視点
List of Tables
- Table 1 Hydrogen Electrolyzer Market estimates and forecasts, 2018 - 2030 (USD Million, MW)
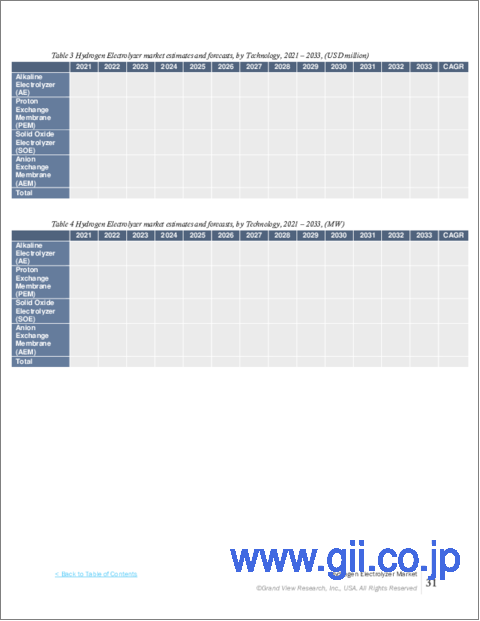
- Table 2 Hydrogen Electrolyzer Market estimates and forecasts by Technology, 2018 - 2030 (USD Million, MW)
- Table 3 Hydrogen Electrolyzer Market estimates and forecasts in Alkaline Electrolyzer (AE), 2018 - 2030 (USD Million, MW)
- Table 4 Hydrogen Electrolyzer Market estimates and forecasts in Proton Exchange Membrane (PEM), 2018 - 2030 (USD Million, MW)
- Table 5 Hydrogen Electrolyzer Market estimates and forecasts in Solid Oxide Electrolyzer (SOE), 2018 - 2030 (USD Million, MW)
- Table 6 Hydrogen Electrolyzer Market estimates and forecasts in Anion Exchange Membrane (AEM), 2018 - 2030 (USD Million, MW)
- Table 7 Hydrogen Electrolyzer Market estimates and forecasts by Application, 2018 - 2030 (USD Million)
- Table 8 Hydrogen Electrolyzer Market estimates and forecasts in Energy, 2018 - 2030 (USD Million, MW)
- Table 9 Hydrogen Electrolyzer Market estimates and forecasts in Power Generation, 2018 - 2030 (USD Million, MW)
- Table 10 Hydrogen Electrolyzer Market estimates and forecasts in CHP, 2018 - 2030 (USD Million, MW)
- Table 11 Hydrogen Electrolyzer Market estimates and forecasts in Mobility, 2018 - 2030 (USD Million, MW)
- Table 12 Hydrogen Electrolyzer Market estimates and forecasts in Industrial, 2018 - 2030 (USD Million, MW)
- Table 13 Hydrogen Electrolyzer Market estimates and forecasts in Chemical, 2018 - 2030 (USD Million, MW)
- Table 14 Hydrogen Electrolyzer Market estimates and forecasts in Industries, 2018 - 2030 (USD Million, MW)
- Table 15 Hydrogen Electrolyzer Market estimates and forecasts in Grid Injection, 2018 - 2030 (USD Million, MW)
- Table 16 Hydrogen Electrolyzer Market estimates and forecasts by Power Generation, 2018 - 2030 (USD Million, MW)
- Table 17 Hydrogen Electrolyzer Market estimates and forecasts in <500 kW, 2018 - 2030 (USD Million, MW)
- Table 18 Hydrogen Electrolyzer Market estimates and forecasts in 500-2,000 kW, 2018 - 2030 (USD Million, MW)
- Table 19 Hydrogen Electrolyzer Market estimates and forecasts in >2,000 kW, 2018 - 2030 (USD Million, MW)
- Table 20 North America Hydrogen Electrolyzer Market estimates and forecasts, 2018 - 2030 (USD Million, MW)
- Table 21 North America Hydrogen Electrolyzer Market estimates and forecasts, by Technology, 2018 - 2030 (USD Million, MW)
- Table 22 North America Hydrogen Electrolyzer Market estimates and forecasts, by Application, 2018 - 2030 (USD Million, MW)
- Table 23 North America Hydrogen Electrolyzer Market estimates and forecasts, by Power Generation, 2018 - 2030 (USD Million, MW)
- Table 24 U.S. Hydrogen Electrolyzer Market estimates and forecasts, 2018 - 2030 (USD Million, MW)
- Table 25 U.S. Hydrogen Electrolyzer Market estimates and forecasts, by Technology, 2018 - 2030 (USD Million, MW)
- Table 26 U.S. Hydrogen Electrolyzer Market estimates and forecasts, by Application, 2018 - 2030 (USD Million, MW)
- Table 27 U.S. Hydrogen Electrolyzer Market estimates and forecasts, by Power Generation, 2018 - 2030 (USD Million, MW)
- Table 28 Canada Hydrogen Electrolyzer Market estimates and forecasts, 2018 - 2030 (USD Million, MW)
- Table 29 Canada Hydrogen Electrolyzer Market estimates and forecasts, by Technology, 2018 - 2030 (USD Million, MW)
- Table 30 Canada Hydrogen Electrolyzer Market estimates and forecasts, by Application, 2018 - 2030 (USD Million, MW)
- Table 31 Canada Hydrogen Electrolyzer Market estimates and forecasts, by Power Generation, 2018 - 2030 (USD Million, MW)
- Table 32 Mexico Hydrogen Electrolyzer Market estimates and forecasts, 2018 - 2030 (USD Million, MW)
- Table 33 Mexico Hydrogen Electrolyzer Market estimates and forecasts, by Technology, 2018 - 2030 (USD Million, MW)
- Table 34 Mexico Hydrogen Electrolyzer Market estimates and forecasts, by Application, 2018 - 2030 (USD Million, MW)
- Table 35 Mexico Hydrogen Electrolyzer Market estimates and forecasts, by Power Generation, 2018 - 2030 (USD Million, MW)
- Table 36 Europe Hydrogen Electrolyzer Market estimates and forecasts, 2018 - 2030 (USD Million, MW)
- Table 37 Europe Hydrogen Electrolyzer Market estimates and forecasts, by Technology, 2018 - 2030 (USD Million, MW)
- Table 38 Europe Hydrogen Electrolyzer Market estimates and forecasts, by Application, 2018 - 2030 (USD Million, MW)
- Table 39 Europe Hydrogen Electrolyzer Market estimates and forecasts, by Power Generation, 2018 - 2030 (USD Million, MW)
- Table 40 Germany Hydrogen Electrolyzer Market estimates and forecasts, 2018 - 2030 (USD Million, MW)
- Table 41 Germany Hydrogen Electrolyzer Market estimates and forecasts, by Technology, 2018 - 2030 (USD Million, MW)
- Table 42 Germany Hydrogen Electrolyzer Market estimates and forecasts, by Application, 2018 - 2030 (USD Million, MW)
- Table 43 Germany Hydrogen Electrolyzer Market estimates and forecasts, by Power Generation, 2018 - 2030 (USD Million, MW)
- Table 44 Italy Hydrogen Electrolyzer Market estimates and forecasts, 2018 - 2030 (USD Million, MW)
- Table 45 Italy Hydrogen Electrolyzer Market estimates and forecasts, by Technology, 2018 - 2030 (USD Million, MW)
- Table 46 Italy Hydrogen Electrolyzer Market estimates and forecasts, by Application, 2018 - 2030 (USD Million, MW)
- Table 47 Italy Hydrogen Electrolyzer Market estimates and forecasts, by Power Generation, 2018 - 2030 (USD Million, MW)
- Table 48 France Hydrogen Electrolyzer Market estimates and forecasts, 2018 - 2030 (USD Million, MW)
- Table 49 France Hydrogen Electrolyzer Market estimates and forecasts, by Technology, 2018 - 2030 (USD Million, MW)
- Table 50 France Hydrogen Electrolyzer Market estimates and forecasts, by Application, 2018 - 2030 (USD Million, MW)
- Table 51 France Hydrogen Electrolyzer Market estimates and forecasts, by Power Generation, 2018 - 2030 (USD Million, MW)
- Table 52 UK Hydrogen Electrolyzer Market estimates and forecasts, 2018 - 2030 (USD Million, MW)
- Table 53 UK Hydrogen Electrolyzer Market estimates and forecasts, by Technology, 2018 - 2030 (USD Million, MW)
- Table 54 UK Hydrogen Electrolyzer Market estimates and forecasts, by Application, 2018 - 2030 (USD Million, MW)
- Table 55 UK Hydrogen Electrolyzer Market estimates and forecasts, by Power Generation, 2018 - 2030 (USD Million, MW)
- Table 56 Russia Hydrogen Electrolyzer Market estimates and forecasts, 2018 - 2030 (USD Million, MW)
- Table 57 Russia Hydrogen Electrolyzer Market estimates and forecasts, by Technology, 2018 - 2030 (USD Million, MW)
- Table 58 Russia Storage Tank Market estimates and forecasts, by Application, 2018 - 2030 (USD Million, MW)
- Table 59 Russia Storage Tank Market estimates and forecasts, by Power Generation, 2018 - 2030 (USD Million, MW)
- Table 60 Asia Pacific Hydrogen Electrolyzer Market estimates and forecasts, 2018 - 2030 (USD Million, MW)
- Table 61 Asia Pacific Hydrogen Electrolyzer Market estimates and forecasts, by Technology, 2018 - 2030 (USD Million, MW)
- Table 62 Asia Pacific Hydrogen Electrolyzer Market estimates and forecasts, by Application, 2018 - 2030 (USD Million, MW)
- Table 63 Asia Pacific Hydrogen Electrolyzer Market estimates and forecasts, by Power Generation, 2018 - 2030 (USD Million, MW)
- Table 64 China Hydrogen Electrolyzer Market estimates and forecasts, 2018 - 2030 (USD Million, MW)
- Table 65 China Hydrogen Electrolyzer Market estimates and forecasts, by Technology, 2018 - 2030 (USD Million, MW)
- Table 66 China Hydrogen Electrolyzer Market estimates and forecasts, by Application, 2018 - 2030 (USD Million, MW)
- Table 67 China Hydrogen Electrolyzer Market estimates and forecasts, by Power Generation, 2018 - 2030 (USD Million, MW)
- Table 68 India Hydrogen Electrolyzer Market estimates and forecasts, 2018 - 2030 (USD Million, MW)
- Table 69 India Hydrogen Electrolyzer Market estimates and forecasts, by Technology, 2018 - 2030 (USD Million, MW)
- Table 70 India Hydrogen Electrolyzer Market estimates and forecasts, by Application, 2018 - 2030 (USD Million, MW)
- Table 71 India Hydrogen Electrolyzer Market estimates and forecasts, by Power Generation, 2018 - 2030 (USD Million, MW)
- Table 72 Japan Hydrogen Electrolyzer Market estimates and forecasts, 2018 - 2030 (USD Million, MW)
- Table 73 Japan Hydrogen Electrolyzer Market estimates and forecasts, by Technology, 2018 - 2030 (USD Million, MW)
- Table 74 Japan Hydrogen Electrolyzer Market estimates and forecasts, by Application, 2018 - 2030 (USD Million, MW)
- Table 75 Japan Hydrogen Electrolyzer Market estimates and forecasts, by Power Generation, 2018 - 2030 (USD Million, MW)
- Table 76 South Korea Hydrogen Electrolyzer Market estimates and forecasts, 2018 - 2030 (USD Million, MW)
- Table 77 South Korea Hydrogen Electrolyzer Market estimates and forecasts, by Technology, 2018 - 2030 (USD Million, MW)
- Table 78 South Korea Hydrogen Electrolyzer Market estimates and forecasts, by Application, 2018 - 2030 (USD Million, MW)
- Table 79 South Korea Hydrogen Electrolyzer Market estimates and forecasts, by Power Generation, 2018 - 2030 (USD Million, MW)
- Table 80 Australia Hydrogen Electrolyzer Market estimates and forecasts, 2018 - 2030 (USD Million, MW)
- Table 81 Australia Hydrogen Electrolyzer Market estimates and forecasts, by Technology, 2018 - 2030 (USD Million, MW)
- Table 82 Australia Hydrogen Electrolyzer Market estimates and forecasts, by Application, 2018 - 2030 (USD Million, MW)
- Table 83 Australia Hydrogen Electrolyzer Market estimates and forecasts, by Power Generation, 2018 - 2030 (USD Million, MW)
- Table 84 Central & South America Hydrogen Electrolyzer Market estimates and forecasts, 2018 - 2030 (USD Million, MW)
- Table 85 Central & South America Hydrogen Electrolyzer Market estimates and forecasts, by Technology, 2018 - 2030 (USD Million, MW)
- Table 86 Central & South America Hydrogen Electrolyzer Market estimates and forecasts, by Application, 2018 - 2030 (USD Million, MW)
- Table 87 Central & South America Hydrogen Electrolyzer Market estimates and forecasts, by Power Generation, 2018 - 2030 (USD Million, MW)
- Table 88 Brazil Hydrogen Electrolyzer Market estimates and forecasts, 2018 - 2030 (USD Million, MW)
- Table 89 Brazil Hydrogen Electrolyzer Market estimates and forecasts, by Technology, 2018 - 2030 (USD Million, MW)
- Table 90 Brazil Hydrogen Electrolyzer Market estimates and forecasts, by Application, 2018 - 2030 (USD Million, MW)
- Table 91 Brazil Hydrogen Electrolyzer Market estimates and forecasts, by Power Generation, 2018 - 2030 (USD Million, MW)
- Table 92 Argentina Hydrogen Electrolyzer Market estimates and forecasts, 2018 - 2030 (USD Million, MW)
- Table 93 Argentina Hydrogen Electrolyzer Market estimates and forecasts, by Technology, 2018 - 2030 (USD Million, MW)
- Table 94 Argentina Hydrogen Electrolyzer Market estimates and forecasts, by Application, 2018 - 2030 (USD Million, MW)
- Table 95 Argentina Hydrogen Electrolyzer Market estimates and forecasts, by Power Generation, 2018 - 2030 (USD Million, MW)
- Table 96 Middle East & Africa Hydrogen Electrolyzer Market estimates and forecasts, 2018 - 2030 (USD Million, MW)
- Table 97 Middle East & Africa Hydrogen Electrolyzer Market estimates and forecasts, by Technology, 2018 - 2030 (USD Million, MW)
- Table 98 Middle East & Africa Hydrogen Electrolyzer Market estimates and forecasts, by Application, 2018 - 2030 (USD Million, MW)
- Table 99 Middle East & Africa Hydrogen Electrolyzer Market estimates and forecasts, by Power Generation, 2018 - 2030 (USD Million, MW)
- Table 100 Saudi Arabia Hydrogen Electrolyzer Market estimates and forecasts, 2018 - 2030 (USD Million, MW)
- Table 101 Saudi Arabia Hydrogen Electrolyzer Market estimates and forecasts, by Technology, 2018 - 2030 (USD Million, MW)
- Table 102 Saudi Arabia Hydrogen Electrolyzer Market estimates and forecasts, by Application, 2018 - 2030 (USD Million, MW)
- Table 103 Saudi Arabia Hydrogen Electrolyzer Market estimates and forecasts, by Power Generation, 2018 - 2030 (USD Million, MW)
- Table 104 Kuwait Hydrogen Electrolyzer Market estimates and forecasts, 2018 - 2030 (USD Million, MW)
- Table 105 Kuwait Hydrogen Electrolyzer Market estimates and forecasts, by Technology, 2018 - 2030 (USD Million, MW)
- Table 106 Kuwait Storage Tank Market estimates and forecasts, by Application, 2018 - 2030 (USD Million, MW)
- Table 107 Kuwait Storage Tank Market estimates and forecasts, by Power Generation, 2018 - 2030 (USD Million, MW)
- Table 108 South Africa Hydrogen Electrolyzer Market estimates and forecasts, 2018 - 2030 (USD Million, MW)
- Table 109 South Africa Hydrogen Electrolyzer Market estimates and forecasts, by Technology, 2018 - 2030 (USD Million, MW)
- Table 110 South Africa Hydrogen Electrolyzer Market estimates and forecasts, by Application, 2018 - 2030 (USD Million, MW)
- Table 111 South Africa Hydrogen Electrolyzer Market estimates and forecasts, by Power Generation, 2018 - 2030 (USD Million, MW)
List of Figures
- Fig. 1 Market segmentation
- Fig. 2 Information procurement
- Fig. 3 Data Analysis Models
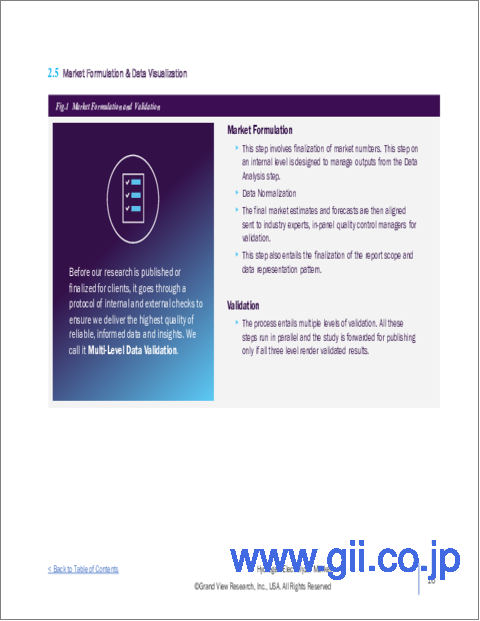
- Fig. 4 Market Formulation and Validation
- Fig. 5 Market snapshot
- Fig. 6 Segmental outlook
- Fig. 7 Competitive outlook
- Fig. 8 Hydrogen Electrolyzer Market, 2018-2030 (USD Million)
- Fig. 9 Value chain analysis
- Fig. 10 Market dynamics
- Fig. 11 Porter's Analysis
- Fig. 12 PESTEL Analysis
- Fig. 13 Hydrogen Electrolyzer Market, by Technology: Key takeaways
- Fig. 14 Hydrogen Electrolyzer Market, by Technology: Market share, 2023 & 2030
- Fig. 15 Alkaline Electrolyzer (AE) Hydrogen Electrolyzer Market Estimates & Forecasts, 2018 - 2030 (USD Million, MW)
- Fig. 16 Proton Exchange Membrane (PEM) Hydrogen Electrolyzer Market Estimates & Forecasts, 2018 - 2030 (USD Million, MW)
- Fig. 17 Solid Oxide Electrolyzer (SOE) Hydrogen Electrolyzer Market Estimates & Forecasts, 2018 - 2030 (USD Million, MW)
- Fig. 18 Anion Exchange Membrane (AEM) Hydrogen Electrolyzer Market Estimates & Forecasts, 2018 - 2030 (USD Million, MW)
- Fig. 19 Hydrogen Electrolyzer Market, by Application: Key takeaways
- Fig. 20 Hydrogen Electrolyzer Market, by Application: Market share, 2023 & 2030
- Fig. 21 Energy Hydrogen Electrolyzer Market Estimates & Forecasts, 2018 - 2030 (USD Million, MW)
- Fig. 22 Power Generation Hydrogen Electrolyzer Market Estimates & Forecasts, 2018 - 2030 (USD Million, MW)
- Fig. 23 CHP Hydrogen Electrolyzer Market Estimates & Forecasts, 2018 - 2030 (USD Million, MW)
- Fig. 24 Mobility Steel Hydrogen Electrolyzer Market Estimates & Forecasts, 2018 - 2030 (USD Million, MW)
- Fig. 25 Industrial Hydrogen Electrolyzer Market Estimates & Forecasts, 2018 - 2030 (USD Million, MW)
- Fig. 26 Chemical Hydrogen Electrolyzer Market Estimates & Forecasts, 2018 - 2030 (USD Million, MW)
- Fig. 27 Industries Hydrogen Electrolyzer Market Estimates & Forecasts, 2018 - 2030 (USD Million, MW)
- Fig. 28 Grid Injection Steel Hydrogen Electrolyzer Market Estimates & Forecasts, 2018 - 2030 (USD Million, MW)
- Fig. 29 Hydrogen Electrolyzer Market, by Power Generation: Key takeaways
- Fig. 30 Hydrogen Electrolyzer Market, by Power Generation: Market share, 2023 & 2030
- Fig. 31 <500 KW Hydrogen Electrolyzer Market Estimates & Forecasts, 2018 - 2030 (USD Million, MW)
- Fig. 32 500-2,000 KW Hydrogen Electrolyzer Market Estimates & Forecasts, 2018 - 2030 (USD Million, MW)
- Fig. 33 >2,000 KW Hydrogen Electrolyzer Market Estimates & Forecasts, 2018 - 2030 (USD Million, MW)
- Fig. 34 North America Market Estimates and Forecasts, 2018 - 2030 (USD Million, MW)
- Fig. 35 U.S. Market Estimates and Forecasts, 2018 - 2030 (USD Million, MW)
- Fig. 36 Canada Market Estimates and Forecasts, 2018 - 2030 (USD Million, MW)
- Fig. 37 Mexico Market Estimates and Forecasts, 2018 - 2030 (USD Million, MW)
- Fig. 38 Europe Market Estimates and Forecasts, 2018 - 2030 (USD Million, MW)
- Fig. 39 Germany Market Estimates and Forecasts, 2018 - 2030 (USD Million, MW)
- Fig. 40 France Market Estimates and Forecasts, 2018 - 2030 (USD Million, MW)
- Fig. 41 Russia Market Estimates and Forecasts, 2018 - 2030 (USD Million, MW)
- Fig. 42 UK Market Estimates and Forecasts, 2018 - 2030 (USD Million, MW)
- Fig. 43 Norway Market Estimates and Forecasts, 2018 - 2030 (USD Million, MW)
- Fig. 44 Italy Market Estimates and Forecasts, 2018 - 2030 (USD Million, MW)
- Fig. 45 Asia Pacific Market Estimates and Forecasts, 2018 - 2030 (USD Million, MW)
- Fig. 46 China Market Estimates and Forecasts, 2018 - 2030 (USD Million, MW)
- Fig. 47 Japan Market Estimates and Forecasts, 2018 - 2030 (USD Million, MW)
- Fig. 48 India Market Estimates and Forecasts, 2018 - 2030 (USD Million, MW)
- Fig. 49 Australia Market Estimates and Forecasts, 2018 - 2030 (USD Million, MW)
- Fig. 50 Central & South America Market Estimates and Forecasts, 2018 - 2030 (USD Million, MW)
- Fig. 51 Brazil Market Estimates and Forecasts, 2018 - 2030 (USD Million, MW)
- Fig. 52 Argentina Market Estimates and Forecasts, 2018 - 2030 (USD Million, MW)
- Fig. 53 Middle East & Africa Market Estimates and Forecasts, 2018 - 2030 (USD Million, MW)
- Fig. 54 Qatar Market Estimates and Forecasts, 2018 - 2030 (USD Million, MW)
- Fig. 55 Saudi Arabia Market Estimates and Forecasts, 2018 - 2030 (USD Million, MW)
- Fig. 56 Kuwait Market Estimates and Forecasts, 2018 - 2030 (USD Million, MW)
- Fig. 57 South Africa Market Estimates and Forecasts, 2018 - 2030 (USD Million, MW)
Hydrogen Electrolyzer Market Size & Trends
The global hydrogen electrolyzer market was estimated at USD 517.80 million in 2023 and is expected to grow at a CAGR of 98.1% from 2024 to 2030. This market stands at the forefront of a monumental shift towards sustainable energy solutions. This valuation underscores the emerging importance of hydrogen as a key player in the transition to green energy, driven by the pressing need to combat climate change and reduce global carbon emissions.
Governments around the world are increasingly implementing stringent policies and offering incentives to promote the adoption of clean energy technologies, including hydrogen. This regulatory push, combined with significant public and private investments in hydrogen infrastructure, is setting the stage for rapid market growth. Hydrogen electrolyzers, which play a critical role in producing green hydrogen from renewable energy sources, are gaining traction as indispensable tools in this global energy transition.
Technological advancements are significantly bolstering the market, making hydrogen production more efficient and cost-effective. Continuous improvements in materials, design, and engineering are enhancing the performance and scalability of electrolyzers, facilitating their adoption across various sectors such as transportation, industrial processes, and energy storage. The integration of hydrogen production with renewable energy sources, like wind and solar power, is particularly transformative.
By utilizing excess renewable energy to produce hydrogen, challenges related to energy storage and grid stability are effectively addressed, paving the way for a more resilient and sustainable energy system. This synergy between hydrogen and renewable energy not only supports the broader adoption of clean energy technologies but also reinforces the crucial role of hydrogen electrolyzers in achieving a carbon-neutral future. As the market continues to evolve, hydrogen electrolyzers are poised to become central to the global energy landscape, driving innovation and fostering an environmentally sustainable energy ecosystem.
Global Hydrogen Electrolyzer Market Report Segmentation
This report forecasts revenue growth at global, regional, and country levels and provides an analysis of the latest trends in each of the sub-segments from 2018 to 2030. For this study, Grand View Research has segmented the global hydrogen electrolyzer market based on the technology, application, power rating, and region:
- Technology Outlook (Revenue, USD Million, 2018 - 2030)
- Alkaline Electrolyzer (AE)
- Proton Exchange Membrane (PEM)
- Solid Oxide Electrolyzer (SOE)
- Anion Exchange Membrane (AEM)
- Application Outlook (Revenue, USD Million, 2018 - 2030)
- Energy
Power Generation
CHP
- Mobility
- Industrial
Chemical
Industries
- Grid Injection
- Power Generation Outlook (Revenue, USD Million, 2018 - 2030)
- <500 kW
- 500-2,000 kW
- >2,000 kW
- Regional Outlook (Revenue, USD Million, 2018 - 2030)
- North America
U.S.
Canada
Mexico
- Europe
Germany
France
UK
Russia
Norway
Italy
- Asia Pacific
China
Japan
India
Australia
- Central & South America
Brazil
Argentina
- Middle East & Africa
Qatar
Saudi Arabia
South Africa
Kuwait
Table of Contents
Chapter 1. Methodology and Scope
- 1.1. Market Segmentation & Scope
- 1.2. Market Definition
- 1.3. Information Procurement
- 1.3.1. Purchased Database
- 1.3.2. GVR's Internal Database
- 1.3.3. Secondary Projects & Third-Party Perspectives
- 1.3.4. Primary Research
- 1.4. Information Analysis
- 1.4.1. Data Analysis Models
- 1.5. Market Formulation & Data Visualization
- 1.6. Data Validation & Publishing
- 1.7. List of Abbreviations
Chapter 2. Executive Summary
- 2.1. Market Outlook, 2023 (USD Million)
- 2.2. Segmental Outlook
- 2.3. Competitive Landscape Snapshot
Chapter 3. Hydrogen Electrolyzer Market Variables, Trends, and Scope
- 3.1. Market Lineage Outlook
- 3.2. Penetration & Growth Prospects Mapping
- 3.3. Industry Value Chain Analysis
- 3.4. Technology Framework
- 3.5. Regulatory Framework
- 3.5.1. Standards & Compliances
- 3.5.2. Regulatory Impact Analysis
- 3.6. Market Dynamics
- 3.6.1. Market Driver Analysis
- 3.6.2. Market Restraint Analysis
- 3.6.3. Market Challenges Analysis
- 3.6.4. Market Opportunity Analysis
- 3.7. Business Environment Analysis
- 3.7.1. Industry analysis - porter's five forces analysis
- 3.7.2. Industry analysis - Pestle analysis
- 3.8. Emerging trends & technologies in the Hydrogen Electrolyzer
Chapter 4. Hydrogen Electrolyzer Market: Technology estimates & trend analysis
- 4.1. Definition & scope
- 4.2. Technology movement analysis & market share, 2023 & 2030
- 4.3. Alkaline Electrolyzer (AE)
- 4.3.1. Market estimates and forecasts, 2018 - 2030 (USD Million, MW)
- 4.4. Proton Exchange Membrane (PEM)
- 4.4.1. Market estimates and forecasts, 2018 - 2030 (USD Million, MW)
- 4.5. Solid Oxide Electrolyzer
- 4.5.1. Market estimates and forecasts, 2018 - 2030 (USD Million, MW)
- 4.6. Anion Exchange Membrane (AEM)
- 4.6.1. Market estimates and forecasts, 2018 - 2030 (USD Million, MW)
Chapter 5. Hydrogen Electrolyzer Market: Application Estimates & Trend Analysis
- 5.1. Definition & Scope
- 5.2. Application Movement Analysis & Market Share, 2023 & 2030
- 5.3. Energy
- 5.3.1. Market estimates and forecasts, 2018 - 2030 (USD Million, MW)
- 5.3.2. Power Generation
- 5.3.2.1. Market estimates and forecasts, 2018 - 2030 (USD Million, MW)
- 5.3.3. CHP
- 5.3.3.2. Market estimates and forecasts, 2018 - 2030 (USD Million, MW)
- 5.4. Mobility
- 5.4.1. Market estimates and forecasts, 2018 - 2030 (USD Million, MW)
- 5.5. Industrial
- 5.5.1. Market estimates and forecasts, 2018 - 2030 (USD Million, MW)
- 5.5.2. Chemical
- 5.5.2.1. Market estimates and forecasts, 2018 - 2030 (USD Million, MW)
- 5.5.3. Industries
- 5.5.3.1. Market estimates and forecasts, 2018 - 2030 (USD Million, MW)
- 5.6. Grid Injection
- 5.6.1. Market estimates and forecasts, 2018 - 2030 (USD Million, MW)
Chapter 6. Hydrogen Electrolyzer Market: Power Generation Estimates & Trend Analysis
- 6.1. Definition & Scope
- 6.2. Power Generation Movement Analysis & Market Share, 2023 & 2030
- 6.3. <500 KW
- 6.3.1. Market estimates and forecasts, 2018 - 2030 (USD Million, MW)
- 6.4. 500-2,000 KW
- 6.4.1. Market estimates and forecasts, 2018 - 2030 (USD Million, MW)
- 6.5. >2,000 KW
- 6.5.1. Market estimates and forecasts, 2018 - 2030 (USD Million, MW)
Chapter 7. Hydrogen Electrolyzer Market: Regional Estimates & Trend Analysis
- 7.1. Key Takeaways
- 7.2. Regional Movement Analysis & Market Share, 2023 & 2030
- 7.3. North America
- 7.3.1. Market estimates and forecasts, 2018 - 2030 (USD Million, MW)
- 7.3.2. Market estimates and forecasts, by Technology, 2018 - 2030 (USD Million, MW)
- 7.3.3. Market estimates and forecasts, by Application, 2018 - 2030 (USD Million, MW)
- 7.3.4. Market estimates and forecasts, by Power Generation, 2018 - 2030 (USD Million, MW)
- 7.3.5. U.S.
- 7.3.5.1. Market estimates and forecasts, 2018 - 2030 (USD Million, MW)
- 7.3.5.2. Market estimates and forecasts, by Technology, 2018 - 2030 (USD Million, MW)
- 7.3.5.3. Market estimates and forecasts, by Application, 2018 - 2030 (USD Million, MW)
- 7.3.5.4. Market estimates and forecasts, by Power Generation, 2018 - 2030 (USD Million, MW)
- 7.3.6. Canada
- 7.3.6.1. Market estimates and forecasts, 2018 - 2030 (USD Million, MW)
- 7.3.6.2. Market estimates and forecasts, by Technology, 2018 - 2030 (USD Million, MW)
- 7.3.6.3. Market estimates and forecasts, by Application, 2018 - 2030 (USD Million, MW)
- 7.3.6.4. Market estimates and forecasts, by Power Generation, 2018 - 2030 (USD Million, MW)
- 7.3.7. Mexico
- 7.3.7.1. Market estimates and forecasts, 2018 - 2030 (USD Million, MW)
- 7.3.7.2. Market estimates and forecasts, by Technology, 2018 - 2030 (USD Million, MW)
- 7.3.7.3. Market estimates and forecasts, by Application, 2018 - 2030 (USD Million, MW)
- 7.3.7.4. Market estimates and forecasts, by Power Generation, 2018 - 2030 (USD Million, MW)
- 7.4. Europe
- 7.4.1. Market estimates and forecasts, 2018 - 2030 (USD Million, MW)
- 7.4.2. Market estimates and forecasts, by Technology, 2018 - 2030 (USD Million, MW)
- 7.4.3. Market estimates and forecasts, by Application, 2018 - 2030 (USD Million, MW)
- 7.4.4. Market estimates and forecasts, by Power Generation, 2018 - 2030 (USD Million, MW)
- 7.4.5. Germany
- 7.4.5.1. Market estimates and forecasts, 2018 - 2030 (USD Million, MW)
- 7.4.5.2. Market estimates and forecasts, by Technology, 2018 - 2030 (USD Million, MW)
- 7.4.5.3. Market estimates and forecasts, by Application, 2018 - 2030 (USD Million, MW)
- 7.4.5.4. Market estimates and forecasts, by Power Generation, 2018 - 2030 (USD Million, MW)
- 7.4.6. U.K.
- 7.4.6.1. Market estimates and forecasts, 2018 - 2030 (USD Million, MW)
- 7.4.6.2. Market estimates and forecasts, by Technology, 2018 - 2030 (USD Million, MW)
- 7.4.6.3. Market estimates and forecasts, by Application, 2018 - 2030 (USD Million, MW)
- 7.4.6.4. Market estimates and forecasts, by Power Generation, 2018 - 2030 (USD Million, MW)
- 7.4.7. France
- 7.4.7.1. Market estimates and forecasts, 2018 - 2030 (USD Million, MW)
- 7.4.7.2. Market estimates and forecasts, by Technology, 2018 - 2030 (USD Million, MW)
- 7.4.7.3. Market estimates and forecasts, by Application, 2018 - 2030 (USD Million, MW)
- 7.4.7.4. Market estimates and forecasts, by Power Generation, 2018 - 2030 (USD Million, MW)
- 7.4.8. Italy
- 7.4.8.1. Market estimates and forecasts, 2018 - 2030 (USD Million, MW)
- 7.4.8.2. Market estimates and forecasts, by Technology, 2018 - 2030 (USD Million, MW)
- 7.4.8.3. Market estimates and forecasts, by Application, 2018 - 2030 (USD Million, MW)
- 7.4.8.4. Market estimates and forecasts, by Power Generation, 2018 - 2030 (USD Million, MW)
- 7.4.9. Norway
- 7.4.9.1. Market estimates and forecasts, 2018 - 2030 (USD Million, MW)
- 7.4.9.2. Market estimates and forecasts, by Technology, 2018 - 2030 (USD Million, MW)
- 7.4.9.3. Market estimates and forecasts, by Application, 2018 - 2030 (USD Million, MW)
- 7.4.9.4. Market estimates and forecasts, by Power Generation, 2018 - 2030 (USD Million, MW)
- 7.4.10. Russia
- 7.4.10.1. Market estimates and forecasts, 2018 - 2030 (USD Million, MW)
- 7.4.10.2. Market estimates and forecasts, by Technology, 2018 - 2030 (USD Million, MW)
- 7.4.10.3. Market estimates and forecasts, by Application, 2018 - 2030 (USD Million, MW)
- 7.4.10.4. Market estimates and forecasts, by Power Generation, 2018 - 2030 (USD Million, MW)
- 7.5. Asia Pacific
- 7.5.1. Market estimates and forecasts, 2018 - 2030 (USD Million, MW)
- 7.5.2. Market estimates and forecasts, by Technology, 2018 - 2030 (USD Million, MW)
- 7.5.3. Market estimates and forecasts, by Application, 2018 - 2030 (USD Million, MW)
- 7.5.4. Market estimates and forecasts, by Power Generation, 2018 - 2030 (USD Million, MW)
- 7.5.5. China
- 7.5.4.1. Market estimates and forecasts, 2018 - 2030 (USD Million, MW)
- 7.5.4.2. Market estimates and forecasts, by Technology, 2018 - 2030 (USD Million, MW)
- 7.5.4.3. Market estimates and forecasts, by Application, 2018 - 2030 (USD Million, MW)
- 7.5.4.4. Market estimates and forecasts, by Power Generation, 2018 - 2030 (USD Million, MW)
- 7.5.6. India
- 7.5.5.1. Market estimates and forecasts, 2018 - 2030 (USD Million, MW)
- 7.5.5.2. Market estimates and forecasts, by Technology, 2018 - 2030 (USD Million, MW)
- 7.5.5.3. Market estimates and forecasts, by Application, 2018 - 2030 (USD Million, MW)
- 7.5.5.4. Market estimates and forecasts, by Power Generation, 2018 - 2030 (USD Million, MW)
- 7.5.6. Japan
- 7.5.6.1. Market estimates and forecasts, 2018 - 2030 (USD Million, MW)
- 7.5.6.2. Market estimates and forecasts, by Technology, 2018 - 2030 (USD Million, MW)
- 7.5.6.3. Market estimates and forecasts, by Application, 2018 - 2030 (USD Million, MW)
- 7.5.6.4. Market estimates and forecasts, by Power Generation, 2018 - 2030 (USD Million, MW)
- 7.5.7. Australia
- 7.5.7.1. Market estimates and forecasts, 2018 - 2030 (USD Million, MW)
- 7.5.7.2. Market estimates and forecasts, by Technology, 2018 - 2030 (USD Million, MW)
- 7.5.7.3. Market estimates and forecasts, by Application, 2018 - 2030 (USD Million, MW)
- 7.5.7.4. Market estimates and forecasts, by Power Generation, 2018 - 2030 (USD Million, MW)
- 7.6. Central & South America
- 7.6.1. Market estimates and forecasts, 2018 - 2030 (USD Million, MW)
- 7.6.2. Market estimates and forecasts, by Technology, 2018 - 2030 (USD Million, MW)
- 7.6.3. Market estimates and forecasts, by Application, 2018 - 2030 (USD Million, MW)
- 7.6.4. Market estimates and forecasts, by Power Generation, 2018 - 2030 (USD Million, MW)
- 7.6.5. Brazil
- 7.6.5.1. Market estimates and forecasts, 2018 - 2030 (USD Million, MW)
- 7.6.5.2. Market estimates and forecasts, by Technology, 2018 - 2030 (USD Million, MW)
- 7.6.5.3. Market estimates and forecasts, by Application, 2018 - 2030 (USD Million, MW)
- 7.6.5.4. Market estimates and forecasts, by Power Generation, 2018 - 2030 (USD Million, MW)
- 7.6.6. Argentina
- 7.6.6.1. Market estimates and forecasts, 2018 - 2030 (USD Million, MW)
- 7.6.6.2. Market estimates and forecasts, by Technology, 2018 - 2030 (USD Million, MW)
- 7.6.6.3. Market estimates and forecasts, by Application, 2018 - 2030 (USD Million, MW)
- 7.6.6.4. Market estimates and forecasts, by Power Generation, 2018 - 2030 (USD Million, MW)
- 7.7. Middle East & Africa
- 7.7.1. Market estimates and forecasts, 2018 - 2030 (USD Million, MW)
- 7.7.2. Market estimates and forecasts, by Technology, 2018 - 2030 (USD Million, MW)
- 7.7.3. Market estimates and forecasts, by Application, 2018 - 2030 (USD Million, MW)
- 7.7.4. Market estimates and forecasts, by Power Generation, 2018 - 2030 (USD Million, MW)
- 7.7.5. Qatar
- 7.7.5.1. Market estimates and forecasts, 2018 - 2030 (USD Million, MW)
- 7.7.5.2. Market estimates and forecasts, by Technology, 2018 - 2030 (USD Million, MW)
- 7.7.5.3. Market estimates and forecasts, by Application, 2018 - 2030 (USD Million, MW)
- 7.7.5.4. Market estimates and forecasts, by Power Generation, 2018 - 2030 (USD Million, MW)
- 7.7.6. Saudi Arabia
- 7.7.6.1. Market estimates and forecasts, 2018 - 2030 (USD Million, MW)
- 7.7.6.2. Market estimates and forecasts, by Technology, 2018 - 2030 (USD Million, MW)
- 7.7.6.3. Market estimates and forecasts, by Application, 2018 - 2030 (USD Million, MW)
- 7.7.6.4. Market estimates and forecasts, by Power Generation, 2018 - 2030 (USD Million, MW)
- 7.7.7. South Africa
- 7.7.7.1. Market estimates and forecasts, 2018 - 2030 (USD Million, MW)
- 7.7.7.2. Market estimates and forecasts, by Technology, 2018 - 2030 (USD Million, MW)
- 7.7.7.3. Market estimates and forecasts, by Application, 2018 - 2030 (USD Million, MW)
- 7.7.7.4. Market estimates and forecasts, by Power Generation, 2018 - 2030 (USD Million, MW)
- 7.7.8. Kuwait
- 7.7.8.1. Market estimates and forecasts, 2018 - 2030 (USD Million, MW)
- 7.7.8.2. Market estimates and forecasts, by Technology, 2018 - 2030 (USD Million, MW)
- 7.7.8.3. Market estimates and forecasts, by Application, 2018 - 2030 (USD Million, MW)
- 7.7.8.4. Market estimates and forecasts, by Power Generation, 2018 - 2030 (USD Million, MW)
Chapter 8. Competitive Landscape
- 8.1. Key Players & Recent Developments & Their Impact on the Industry
- 8.2. Key Company/Competition Categorization (Key innovators, Market leaders, emerging players)
- 8.3. List of key Component Suppliers and Channel Partners
- 8.4. Company Market Share & Position Analysis, 2023
- 8.5. Company Heat Map Analysis
- 8.6. Competitive Dashboard Analysis
- 8.7. Strategy Mapping
- 8.7.1. Expansion
- 8.7.2. Collaboration/ Partnerships/ Agreements
- 8.7.3. New Application launches
- 8.7.4. Mergers & Acquisitions
- 8.7.5. Research & Development
- 8.7.6. Others
- 8.8. List of Potential Customers, by Material
Chapter 9. Company Listing / Profiles
- 9.1. thyssenkrupp nucera
- 9.1.1. Company Overview
- 9.1.2. Financial Performance
- 9.1.3. Product Benchmarking
- 9.2. John Cockerill
- 9.2.1. Company Overview
- 9.2.2. Financial Performance
- 9.2.3. Product Benchmarking
- 9.3. Nel ASA
- 9.3.1. Company Overview
- 9.3.2. Financial Performance
- 9.3.3. Product Benchmarking
- 9.4. Plug Power Inc.
- 9.4.1. Company Overview
- 9.4.2. Financial Performance
- 9.4.3. Product Benchmarking
- 9.5. Siemens Energy
- 9.5.1. Company Overview
- 9.5.2. Financial Performance
- 9.5.3. Product Benchmarking
- 9.6. Enapter S.r.l.
- 9.6.1. Company Overview
- 9.6.2. Financial Performance
- 9.6.3. Product Benchmarking
- 9.7. Cummins Inc.
- 9.7.1. Company Overview
- 9.7.2. Financial Performance
- 9.7.3. Product Benchmarking
- 9.8. ITM Power
- 9.8.1. Company Overview
- 9.8.2. Financial Performance
- 9.8.3. Product Benchmarking
- 9.9. McPhy Energy S.A.
- 9.9.1. Company Overview
- 9.9.2. Financial Performance
- 9.9.3. Product Benchmarking
- 9.10. Topsoe
- 9.10.1. Company Overview
- 9.10.2. Financial Performance
- 9.10.3. Product Benchmarking
