|
|
市場調査レポート
商品コード
1666732
ガスタービンの世界市場 2025~2029年Global Gas Turbine Market 2025-2029 |
||||||

|
|||||||
カスタマイズ可能
|
|||||||

| ガスタービンの世界市場 2025~2029年 |
|
出版日: 2025年02月21日
発行: TechNavio
ページ情報: 英文 246 Pages
納期: 即納可能
|

全表示
- 概要
- 目次
ガスタービン市場は2024~2029年に33億3,570万米ドル、予測期間中のCAGRは2.2%で成長すると予測されます。
当レポートでは、ガスタービン市場の全体的な分析、市場規模・予測、動向、成長促進要因、課題、約25のベンダーを網羅したベンダー分析などを掲載しています。
現在の市場シナリオ、最新動向と促進要因、市場環境全体に関する最新分析を提供しています。ガスタービンの効率性と堅牢性の向上、分散型発電基盤の成長、天然ガスパイプラインネットワークの拡大が市場を牽引しています。
| 市場範囲 | |
|---|---|
| 基準年 | 2025年 |
| 終了年 | 2029年 |
| 予測期間 | 2025~2029年 |
| 成長モメンタム | 加速 |
| 前年比2025年 | 2.1% |
| CAGR | 2.2% |
| 増分額 | 33億3,570万米ドル |
本調査は、業界の主要参加者からのインプットを含め、一次情報と二次情報を客観的に組み合わせて実施しました。レポートには、主要企業の分析に加え、包括的な市場規模データ、地域分析によるセグメント、ベンダー情勢が含まれています。レポートには過去データと予測データがあります。
本調査では、今後数年間のガスタービン市場の成長を促進する主な理由の一つとして、航空転用ガスタービンにおける代替燃料使用の増加を挙げています。また、Fクラスガスタービンの急速な需要減退とGTCCおよびIGCC技術の開発は、市場の大きな需要につながります。
目次
第1章 エグゼクティブサマリー
- 市場概要
第2章 Technavio別分析
- 価格・ライフサイクル・顧客購入バスケット・採用率・購入基準の分析
- インプットの重要性と差別化の要因
- 混乱の要因
- 促進要因と課題の影響
第3章 市場情勢
- 市場エコシステム
- 市場の特徴
- バリューチェーン分析
第4章 市場規模
- 市場の定義
- 市場セグメント分析
- 市場規模 2024年
- 市場展望 2024~2029年
第5章 市場規模実績
- ガスタービンの世界市場 2019~2023年
- 製品別セグメント分析 2019~2023年
- 技術別セグメント分析 2019~2023年
- エンドユーザー別セグメント分析 2019~2023年
- 容量別セグメント分析 2019~2023年
- 地域別セグメント分析 2019~2023年
- 国別セグメント分析 2019~2023年
第6章 定性分析
- AIの影響:ガスタービンの世界市場
第7章 ファイブフォース分析
- ファイブフォースの要約
- 買い手の交渉力
- 供給企業の交渉力
- 新規参入業者の脅威
- 代替品の脅威
- 競争の脅威
- 市況
第8章 市場セグメンテーション:製品別
- 市場セグメント
- 比較:製品別
- 大型ガスタービン:市場規模と予測 2024~2029年
- 航空機転用ガスタービン:市場規模と予測 2024~2029年
- 市場機会:製品別
第9章 市場セグメンテーション:技術別
- 市場セグメント
- 比較:技術別
- CCGT:市場規模と予測 2024~2029年
- OCGT:市場規模と予測 2024~2029年
- 市場機会:技術別
第10章 市場セグメンテーション:エンドユーザー別
- 市場セグメント
- 比較:エンドユーザー別
- エネルギー・公共事業:市場規模と予測 2024~2029年
- 石油・ガス:市場規模と予測 2024~2029年
- 航空宇宙・防衛:市場規模と予測 2024~2029年
- 製造業:市場規模と予測 2024~2029年
- 海洋:市場規模と予測 2024~2029年
- 市場機会:エンドユーザー別
第11章 市場セグメンテーション:容量別
- 市場セグメント
- 比較:容量別
- 300MW以上:市場規模と予測 2024~2029年
- 40~120 MW:市場規模と予測 2024~2029年
- 120~300 MW:市場規模と予測 2024~2029年
- 1~40 MW:市場規模と予測 2024~2029年
- 市場機会:容量別
第12章 顧客情勢
- 顧客情勢の概要
第13章 地域別情勢
- 地域別セグメンテーション
- 地域別比較
- アジア太平洋:市場規模と予測 2024~2029年
- 北米:市場規模と予測 2024~2029年
- 欧州:市場規模と予測 2024~2029年
- 中東・アフリカ:市場規模と予測 2024~2029年
- 南米:市場規模と予測 2024~2029年
- 米国:市場規模と予測 2024~2029年
- 中国:市場規模と予測 2024~2029年
- 日本:市場規模と予測 2024~2029年
- インド:市場規模と予測 2024~2029年
- カナダ:市場規模と予測 2024~2029年
- 英国:市場規模と予測 2024~2029年
- 韓国:市場規模と予測 2024~2029年
- ドイツ:市場規模と予測 2024~2029年
- ブラジル:市場規模と予測 2024~2029年
- アラブ首長国連邦:市場規模と予測 2024~2029年
- 市場機会:地域情勢別
第14章 促進要因・課題・機会・抑制要因
- 市場促進要因
- 市場の課題
- 促進要因と課題の影響
- 市場の機会・抑制要因
第15章 競合情勢
- 概要
- 競合情勢
- 混乱の状況
- 業界のリスク
第16章 競合分析
- 企業プロファイル
- 企業ランキング指数
- 企業の市場ポジショニング
- Ansaldo Energia Spa
- Bharat Heavy Electricals Ltd.
- Capstone Green Energy Corp.
- Caterpillar Inc.
- Destinus Energy
- GE Vernova Inc.
- Harbin Turbine Co. Ltd.
- IHI Corp.
- Kawasaki Heavy Industries Ltd.
- MAN Energy Solutions SE
- Mitsubishi Power Ltd.
- Rolls Royce Holdings Plc
- Shanghai Electric Group Co.
- Siemens Energy AG
- Wartsila Corp.
第17章 付録
The gas turbine market is forecasted to grow by USD 3335.7 million during 2024-2029, accelerating at a CAGR of 2.2% during the forecast period. The report on the gas turbine market provides a holistic analysis, market size and forecast, trends, growth drivers, and challenges, as well as vendor analysis covering around 25 vendors.
The report offers an up-to-date analysis regarding the current market scenario, the latest trends and drivers, and the overall market environment. The market is driven by enhanced efficiency and robustness of gas turbines, growth of distributed power generation base, and expanding natural gas pipeline networks.
| Market Scope | |
|---|---|
| Base Year | 2025 |
| End Year | 2029 |
| Series Year | 2025-2029 |
| Growth Momentum | Accelerate |
| YOY 2025 | 2.1% |
| CAGR | 2.2% |
| Incremental Value | $3335.7 mn |
The study was conducted using an objective combination of primary and secondary information including inputs from key participants in the industry. The report contains a comprehensive market size data, segment with regional analysis and vendor landscape in addition to an analysis of the key companies. Reports have historic and forecast data.
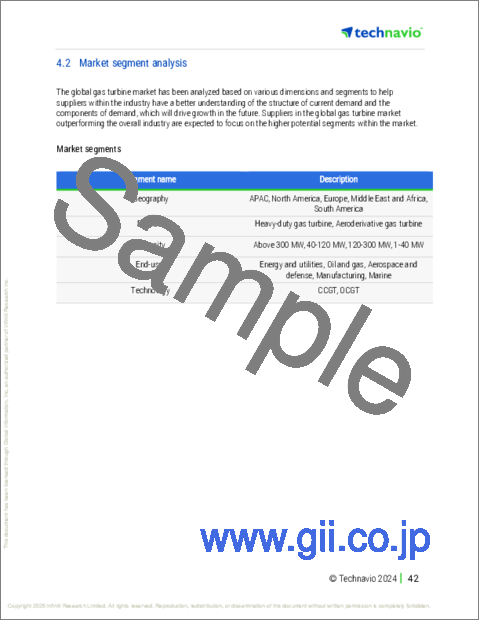
Technavio's gas turbine market is segmented as below:
By Product
- Heavy-duty gas turbine
- Aeroderivative gas turbine
By Technology
- CCGT
- OCGT
By End-user
- Energy and utilities
- Oil and gas
- Aerospace and defense
- Manufacturing
- Marine
By Capacity
- Above 300 MW
- 40-120 MW
- 120-300 MW
- 1-40 MW
By Geographical Landscape
- APAC
- North America
- Europe
- Middle East and Africa
- South America
This study identifies the growing use of alternative types of fuel in aeroderivative gas turbines as one of the prime reasons driving the gas turbine market growth during the next few years. Also, rapid decline in demand for f-class gas turbines and development of GTCC and IGCC technologies will lead to sizable demand in the market.
The report on the gas turbine market covers the following areas:
- Gas Turbine Market sizing
- Gas Turbine Market forecast
- Gas Turbine Market industry analysis
The robust vendor analysis is designed to help clients improve their market position, and in line with this, this report provides a detailed analysis of several leading gas turbine market vendors that include Ansaldo Energia Spa, Bharat Heavy Electricals Ltd., Capstone Green Energy Corp., Caterpillar Inc., Destinus Energy, Doosan Heavy Industries and Construction Co. Ltd., GE Vernova Inc., Harbin Turbine Co. Ltd., IHI Corp., Kawasaki Heavy Industries Ltd., MAN Energy Solutions SE, MAPNA Group Co., Mitsubishi Power Ltd., Motor Sich JSC, MTU Aero Engines AG, Rolls Royce Holdings PLC, Shanghai Electric Group Co., Siemens Energy AG, Solar Turbines Inc., and Wartsila Corp.. Also, the gas turbine market analysis report includes information on upcoming trends and challenges that will influence market growth. This is to help companies strategize and leverage all forthcoming growth opportunities.
The publisher presents a detailed picture of the market by the way of study, synthesis, and summation of data from multiple sources by an analysis of key parameters such as profit, pricing, competition, and promotions. It presents various market facets by identifying the key industry influencers. The data presented is comprehensive, reliable, and a result of extensive primary and secondary research. The market research reports provide a complete competitive landscape and an in-depth vendor selection methodology and analysis using qualitative and quantitative research to forecast accurate market growth.
Table of Contents
1 Executive Summary
- 1.1 Market overview
- Executive Summary - Chart on Market Overview
- Executive Summary - Data Table on Market Overview
- Executive Summary - Chart on Global Market Characteristics
- Executive Summary - Chart on Market By Geographical Landscape
- Executive Summary - Chart on Market Segmentation by Product
- Executive Summary - Chart on Market Segmentation by Technology
- Executive Summary - Chart on Market Segmentation by End-user
- Executive Summary - Chart on Market Segmentation by Capacity
- Executive Summary - Chart on Incremental Growth
- Executive Summary - Data Table on Incremental Growth
- Executive Summary - Chart on Company Market Positioning
2 Technavio Analysis
- 2.1 Analysis of price sensitivity, lifecycle, customer purchase basket, adoption rates, and purchase criteria
- Analysis of price sensitivity, lifecycle, customer purchase basket, adoption rates, and purchase criteria
- 2.2 Criticality of inputs and Factors of differentiation
- Overview on criticality of inputs and factors of differentiation
- 2.3 Factors of disruption
- Overview on factors of disruption
- 2.4 Impact of drivers and challenges
- Impact of drivers and challenges in 2024 and 2029
3 Market Landscape
- 3.1 Market ecosystem
- Parent Market
- Data Table on - Parent Market
- 3.2 Market characteristics
- Market characteristics analysis
- 3.3 Value chain analysis
- Value chain analysis
4 Market Sizing
- 4.1 Market definition
- Offerings of companies included in the market definition
- 4.2 Market segment analysis
- Market segments
- 4.3 Market size 2024
- 4.4 Market outlook: Forecast for 2024-2029
- Chart on Global - Market size and forecast 2024-2029 ($ million)
- Data Table on Global - Market size and forecast 2024-2029 ($ million)
- Chart on Global Market: Year-over-year growth 2024-2029 (%)
- Data Table on Global Market: Year-over-year growth 2024-2029 (%)
5 Historic Market Size
- 5.1 Global Gas Turbine Market 2019 - 2023
- Historic Market Size - Data Table on Global Gas Turbine Market 2019 - 2023 ($ million)
- 5.2 Product segment analysis 2019 - 2023
- Historic Market Size - Product Segment 2019 - 2023 ($ million)
- 5.3 Technology segment analysis 2019 - 2023
- Historic Market Size - Technology Segment 2019 - 2023 ($ million)
- 5.4 End-user segment analysis 2019 - 2023
- Historic Market Size - End-user Segment 2019 - 2023 ($ million)
- 5.5 Capacity segment analysis 2019 - 2023
- Historic Market Size - Capacity Segment 2019 - 2023 ($ million)
- 5.6 Geography segment analysis 2019 - 2023
- Historic Market Size - Geography Segment 2019 - 2023 ($ million)
- 5.7 Country segment analysis 2019 - 2023
- Historic Market Size - Country Segment 2019 - 2023 ($ million)
6 Qualitative Analysis
- 6.1 Impact of AI on the Global Gas Turbine Market
7 Five Forces Analysis
- 7.1 Five forces summary
- Five forces analysis - Comparison between 2024 and 2029
- 7.2 Bargaining power of buyers
- Bargaining power of buyers - Impact of key factors 2024 and 2029
- 7.3 Bargaining power of suppliers
- Bargaining power of suppliers - Impact of key factors in 2024 and 2029
- 7.4 Threat of new entrants
- Threat of new entrants - Impact of key factors in 2024 and 2029
- 7.5 Threat of substitutes
- Threat of substitutes - Impact of key factors in 2024 and 2029
- 7.6 Threat of rivalry
- Threat of rivalry - Impact of key factors in 2024 and 2029
- 7.7 Market condition
- Chart on Market condition - Five forces 2024 and 2029
8 Market Segmentation by Product
- 8.1 Market segments
- Chart on Product - Market share 2024-2029 (%)
- Data Table on Product - Market share 2024-2029 (%)
- 8.2 Comparison by Product
- Chart on Comparison by Product
- Data Table on Comparison by Product
- 8.3 Heavy-duty gas turbine - Market size and forecast 2024-2029
- Chart on Heavy-duty gas turbine - Market size and forecast 2024-2029 ($ million)
- Data Table on Heavy-duty gas turbine - Market size and forecast 2024-2029 ($ million)
- Chart on Heavy-duty gas turbine - Year-over-year growth 2024-2029 (%)
- Data Table on Heavy-duty gas turbine - Year-over-year growth 2024-2029 (%)
- 8.4 Aeroderivative gas turbine - Market size and forecast 2024-2029
- Chart on Aeroderivative gas turbine - Market size and forecast 2024-2029 ($ million)
- Data Table on Aeroderivative gas turbine - Market size and forecast 2024-2029 ($ million)
- Chart on Aeroderivative gas turbine - Year-over-year growth 2024-2029 (%)
- Data Table on Aeroderivative gas turbine - Year-over-year growth 2024-2029 (%)
- 8.5 Market opportunity by Product
- Market opportunity by Product ($ million)
- Data Table on Market opportunity by Product ($ million)
9 Market Segmentation by Technology
- 9.1 Market segments
- Chart on Technology - Market share 2024-2029 (%)
- Data Table on Technology - Market share 2024-2029 (%)
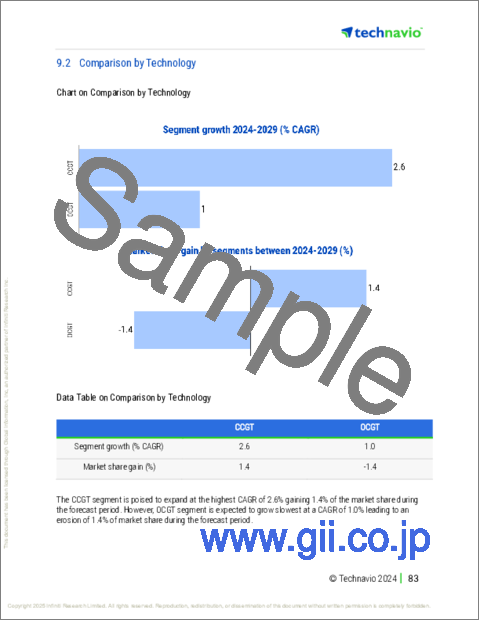
- 9.2 Comparison by Technology
- Chart on Comparison by Technology
- Data Table on Comparison by Technology
- 9.3 CCGT - Market size and forecast 2024-2029
- Chart on CCGT - Market size and forecast 2024-2029 ($ million)
- Data Table on CCGT - Market size and forecast 2024-2029 ($ million)
- Chart on CCGT - Year-over-year growth 2024-2029 (%)
- Data Table on CCGT - Year-over-year growth 2024-2029 (%)
- 9.4 OCGT - Market size and forecast 2024-2029
- Chart on OCGT - Market size and forecast 2024-2029 ($ million)
- Data Table on OCGT - Market size and forecast 2024-2029 ($ million)
- Chart on OCGT - Year-over-year growth 2024-2029 (%)
- Data Table on OCGT - Year-over-year growth 2024-2029 (%)
- 9.5 Market opportunity by Technology
- Market opportunity by Technology ($ million)
- Data Table on Market opportunity by Technology ($ million)
10 Market Segmentation by End-user
- 10.1 Market segments
- Chart on End-user - Market share 2024-2029 (%)
- Data Table on End-user - Market share 2024-2029 (%)
- 10.2 Comparison by End-user
- Chart on Comparison by End-user
- Data Table on Comparison by End-user
- 10.3 Energy and utilities - Market size and forecast 2024-2029
- Chart on Energy and utilities - Market size and forecast 2024-2029 ($ million)
- Data Table on Energy and utilities - Market size and forecast 2024-2029 ($ million)
- Chart on Energy and utilities - Year-over-year growth 2024-2029 (%)
- Data Table on Energy and utilities - Year-over-year growth 2024-2029 (%)
- 10.4 Oil and gas - Market size and forecast 2024-2029
- Chart on Oil and gas - Market size and forecast 2024-2029 ($ million)
- Data Table on Oil and gas - Market size and forecast 2024-2029 ($ million)
- Chart on Oil and gas - Year-over-year growth 2024-2029 (%)
- Data Table on Oil and gas - Year-over-year growth 2024-2029 (%)
- 10.5 Aerospace and defense - Market size and forecast 2024-2029
- Chart on Aerospace and defense - Market size and forecast 2024-2029 ($ million)
- Data Table on Aerospace and defense - Market size and forecast 2024-2029 ($ million)
- Chart on Aerospace and defense - Year-over-year growth 2024-2029 (%)
- Data Table on Aerospace and defense - Year-over-year growth 2024-2029 (%)
- 10.6 Manufacturing - Market size and forecast 2024-2029
- Chart on Manufacturing - Market size and forecast 2024-2029 ($ million)
- Data Table on Manufacturing - Market size and forecast 2024-2029 ($ million)
- Chart on Manufacturing - Year-over-year growth 2024-2029 (%)
- Data Table on Manufacturing - Year-over-year growth 2024-2029 (%)
- 10.7 Marine - Market size and forecast 2024-2029
- Chart on Marine - Market size and forecast 2024-2029 ($ million)
- Data Table on Marine - Market size and forecast 2024-2029 ($ million)
- Chart on Marine - Year-over-year growth 2024-2029 (%)
- Data Table on Marine - Year-over-year growth 2024-2029 (%)
- 10.8 Market opportunity by End-user
- Market opportunity by End-user ($ million)
- Data Table on Market opportunity by End-user ($ million)
11 Market Segmentation by Capacity
- 11.1 Market segments
- Chart on Capacity - Market share 2024-2029 (%)
- Data Table on Capacity - Market share 2024-2029 (%)
- 11.2 Comparison by Capacity
- Chart on Comparison by Capacity
- Data Table on Comparison by Capacity
- 11.3 Above 300 MW - Market size and forecast 2024-2029
- Chart on Above 300 MW - Market size and forecast 2024-2029 ($ million)
- Data Table on Above 300 MW - Market size and forecast 2024-2029 ($ million)
- Chart on Above 300 MW - Year-over-year growth 2024-2029 (%)
- Data Table on Above 300 MW - Year-over-year growth 2024-2029 (%)
- 40-120 MW - Market size and forecast 2024-2029
- Chart on 40-120 MW - Market size and forecast 2024-2029 ($ million)
- Data Table on 40-120 MW - Market size and forecast 2024-2029 ($ million)
- Chart on 40-120 MW - Year-over-year growth 2024-2029 (%)
- Data Table on 40-120 MW - Year-over-year growth 2024-2029 (%)
- 120-300 MW - Market size and forecast 2024-2029
- Chart on 120-300 MW - Market size and forecast 2024-2029 ($ million)
- Data Table on 120-300 MW - Market size and forecast 2024-2029 ($ million)
- Chart on 120-300 MW - Year-over-year growth 2024-2029 (%)
- Data Table on 120-300 MW - Year-over-year growth 2024-2029 (%)
- 1-40 MW - Market size and forecast 2024-2029
- Chart on 1-40 MW - Market size and forecast 2024-2029 ($ million)
- Data Table on 1-40 MW - Market size and forecast 2024-2029 ($ million)
- Chart on 1-40 MW - Year-over-year growth 2024-2029 (%)
- Data Table on 1-40 MW - Year-over-year growth 2024-2029 (%)
- 11.7 Market opportunity by Capacity
- Market opportunity by Capacity ($ million)
- Data Table on Market opportunity by Capacity ($ million)
12 Customer Landscape
- 12.1 Customer landscape overview
- Analysis of price sensitivity, lifecycle, customer purchase basket, adoption rates, and purchase criteria
13 Geographic Landscape
- 13.1 Geographic segmentation
- Chart on Market share By Geographical Landscape 2024-2029 (%)
- Data Table on Market share By Geographical Landscape 2024-2029 (%)
- 13.2 Geographic comparison
- Chart on Geographic comparison
- Data Table on Geographic comparison
- 13.3 APAC - Market size and forecast 2024-2029
- Chart on APAC - Market size and forecast 2024-2029 ($ million)
- Data Table on APAC - Market size and forecast 2024-2029 ($ million)
- Chart on APAC - Year-over-year growth 2024-2029 (%)
- Data Table on APAC - Year-over-year growth 2024-2029 (%)
- 13.4 North America - Market size and forecast 2024-2029
- Chart on North America - Market size and forecast 2024-2029 ($ million)
- Data Table on North America - Market size and forecast 2024-2029 ($ million)
- Chart on North America - Year-over-year growth 2024-2029 (%)
- Data Table on North America - Year-over-year growth 2024-2029 (%)
- 13.5 Europe - Market size and forecast 2024-2029
- Chart on Europe - Market size and forecast 2024-2029 ($ million)
- Data Table on Europe - Market size and forecast 2024-2029 ($ million)
- Chart on Europe - Year-over-year growth 2024-2029 (%)
- Data Table on Europe - Year-over-year growth 2024-2029 (%)
- 13.6 Middle East and Africa - Market size and forecast 2024-2029
- Chart on Middle East and Africa - Market size and forecast 2024-2029 ($ million)
- Data Table on Middle East and Africa - Market size and forecast 2024-2029 ($ million)
- Chart on Middle East and Africa - Year-over-year growth 2024-2029 (%)
- Data Table on Middle East and Africa - Year-over-year growth 2024-2029 (%)
- 13.7 South America - Market size and forecast 2024-2029
- Chart on South America - Market size and forecast 2024-2029 ($ million)
- Data Table on South America - Market size and forecast 2024-2029 ($ million)
- Chart on South America - Year-over-year growth 2024-2029 (%)
- Data Table on South America - Year-over-year growth 2024-2029 (%)
- 13.8 US - Market size and forecast 2024-2029
- Chart on US - Market size and forecast 2024-2029 ($ million)
- Data Table on US - Market size and forecast 2024-2029 ($ million)
- Chart on US - Year-over-year growth 2024-2029 (%)
- Data Table on US - Year-over-year growth 2024-2029 (%)
- 13.9 China - Market size and forecast 2024-2029
- Chart on China - Market size and forecast 2024-2029 ($ million)
- Data Table on China - Market size and forecast 2024-2029 ($ million)
- Chart on China - Year-over-year growth 2024-2029 (%)
- Data Table on China - Year-over-year growth 2024-2029 (%)
- 13.10 Japan - Market size and forecast 2024-2029
- Chart on Japan - Market size and forecast 2024-2029 ($ million)
- Data Table on Japan - Market size and forecast 2024-2029 ($ million)
- Chart on Japan - Year-over-year growth 2024-2029 (%)
- Data Table on Japan - Year-over-year growth 2024-2029 (%)
- 13.11 India - Market size and forecast 2024-2029
- Chart on India - Market size and forecast 2024-2029 ($ million)
- Data Table on India - Market size and forecast 2024-2029 ($ million)
- Chart on India - Year-over-year growth 2024-2029 (%)
- Data Table on India - Year-over-year growth 2024-2029 (%)
- 13.12 Canada - Market size and forecast 2024-2029
- Chart on Canada - Market size and forecast 2024-2029 ($ million)
- Data Table on Canada - Market size and forecast 2024-2029 ($ million)
- Chart on Canada - Year-over-year growth 2024-2029 (%)
- Data Table on Canada - Year-over-year growth 2024-2029 (%)
- 13.13 UK - Market size and forecast 2024-2029
- Chart on UK - Market size and forecast 2024-2029 ($ million)
- Data Table on UK - Market size and forecast 2024-2029 ($ million)
- Chart on UK - Year-over-year growth 2024-2029 (%)
- Data Table on UK - Year-over-year growth 2024-2029 (%)
- 13.14 South Korea - Market size and forecast 2024-2029
- Chart on South Korea - Market size and forecast 2024-2029 ($ million)
- Data Table on South Korea - Market size and forecast 2024-2029 ($ million)
- Chart on South Korea - Year-over-year growth 2024-2029 (%)
- Data Table on South Korea - Year-over-year growth 2024-2029 (%)
- 13.15 Germany - Market size and forecast 2024-2029
- Chart on Germany - Market size and forecast 2024-2029 ($ million)
- Data Table on Germany - Market size and forecast 2024-2029 ($ million)
- Chart on Germany - Year-over-year growth 2024-2029 (%)
- Data Table on Germany - Year-over-year growth 2024-2029 (%)
- 13.16 Brazil - Market size and forecast 2024-2029
- Chart on Brazil - Market size and forecast 2024-2029 ($ million)
- Data Table on Brazil - Market size and forecast 2024-2029 ($ million)
- Chart on Brazil - Year-over-year growth 2024-2029 (%)
- Data Table on Brazil - Year-over-year growth 2024-2029 (%)
- 13.17 UAE - Market size and forecast 2024-2029
- Chart on UAE - Market size and forecast 2024-2029 ($ million)
- Data Table on UAE - Market size and forecast 2024-2029 ($ million)
- Chart on UAE - Year-over-year growth 2024-2029 (%)
- Data Table on UAE - Year-over-year growth 2024-2029 (%)
- 13.18 Market opportunity By Geographical Landscape
- Market opportunity By Geographical Landscape ($ million)
- Data Tables on Market opportunity By Geographical Landscape ($ million)
14 Drivers, Challenges, and Opportunity/Restraints
- 14.1 Market drivers
- 14.2 Market challenges
- 14.3 Impact of drivers and challenges
- Impact of drivers and challenges in 2024 and 2029
- 14.4 Market opportunities/restraints
15 Competitive Landscape
- 15.1 Overview
- 15.2 Competitive Landscape
- Overview on criticality of inputs and factors of differentiation
- 15.3 Landscape disruption
- Overview on factors of disruption
- 15.4 Industry risks
- Impact of key risks on business
16 Competitive Analysis
- 16.1 Companies profiled
- Companies covered
- 16.2 Company ranking index
- Company ranking index
- 16.3 Market positioning of companies
- Matrix on companies position and classification
- 16.4 Ansaldo Energia Spa
- Ansaldo Energia Spa - Overview
- Ansaldo Energia Spa - Product / Service
- Ansaldo Energia Spa - Key offerings
- SWOT
- 16.5 Bharat Heavy Electricals Ltd.
- Bharat Heavy Electricals Ltd. - Overview
- Bharat Heavy Electricals Ltd. - Business segments
- Bharat Heavy Electricals Ltd. - Key news
- Bharat Heavy Electricals Ltd. - Key offerings
- Bharat Heavy Electricals Ltd. - Segment focus
- SWOT
- 16.6 Capstone Green Energy Corp.
- Capstone Green Energy Corp. - Overview
- Capstone Green Energy Corp. - Business segments
- Capstone Green Energy Corp. - Key news
- Capstone Green Energy Corp. - Key offerings
- Capstone Green Energy Corp. - Segment focus
- SWOT
- 16.7 Caterpillar Inc.
- Caterpillar Inc. - Overview
- Caterpillar Inc. - Business segments
- Caterpillar Inc. - Key news
- Caterpillar Inc. - Key offerings
- Caterpillar Inc. - Segment focus
- SWOT
- 16.8 Destinus Energy
- Destinus Energy - Overview
- Destinus Energy - Product / Service
- Destinus Energy - Key offerings
- SWOT
- 16.9 GE Vernova Inc.
- GE Vernova Inc. - Overview
- GE Vernova Inc. - Business segments
- GE Vernova Inc. - Key offerings
- GE Vernova Inc. - Segment focus
- SWOT
- 16.10 Harbin Turbine Co. Ltd.
- Harbin Turbine Co. Ltd. - Overview
- Harbin Turbine Co. Ltd. - Product / Service
- Harbin Turbine Co. Ltd. - Key offerings
- SWOT
- 16.11 IHI Corp.
- IHI Corp. - Overview
- IHI Corp. - Business segments
- IHI Corp. - Key offerings
- IHI Corp. - Segment focus
- SWOT
- 16.12 Kawasaki Heavy Industries Ltd.
- Kawasaki Heavy Industries Ltd. - Overview
- Kawasaki Heavy Industries Ltd. - Business segments
- Kawasaki Heavy Industries Ltd. - Key news
- Kawasaki Heavy Industries Ltd. - Key offerings
- Kawasaki Heavy Industries Ltd. - Segment focus
- SWOT
- 16.13 MAN Energy Solutions SE
- MAN Energy Solutions SE - Overview
- MAN Energy Solutions SE - Product / Service
- MAN Energy Solutions SE - Key offerings
- SWOT
- 16.14 Mitsubishi Power Ltd.
- Mitsubishi Power Ltd. - Overview
- Mitsubishi Power Ltd. - Product / Service
- Mitsubishi Power Ltd. - Key offerings
- SWOT
- 16.15 Rolls Royce Holdings Plc
- Rolls Royce Holdings Plc - Overview
- Rolls Royce Holdings Plc - Business segments
- Rolls Royce Holdings Plc - Key news
- Rolls Royce Holdings Plc - Key offerings
- Rolls Royce Holdings Plc - Segment focus
- SWOT
- 16.16 Shanghai Electric Group Co.
- Shanghai Electric Group Co. - Overview
- Shanghai Electric Group Co. - Product / Service
- Shanghai Electric Group Co. - Key offerings
- SWOT
- 16.17 Siemens Energy AG
- Siemens Energy AG - Overview
- Siemens Energy AG - Business segments
- Siemens Energy AG - Key news
- Siemens Energy AG - Key offerings
- Siemens Energy AG - Segment focus
- SWOT
- 16.18 Wartsila Corp.
- Wartsila Corp. - Overview
- Wartsila Corp. - Business segments
- Wartsila Corp. - Key news
- Wartsila Corp. - Key offerings
- Wartsila Corp. - Segment focus
- SWOT
17 Appendix
- 17.1 Scope of the report
- 17.2 Inclusions and exclusions checklist
- Inclusions checklist
- Exclusions checklist
- 17.3 Currency conversion rates for US$
- Currency conversion rates for US$
- 17.4 Research methodology
- Research methodology
- 17.5 Data procurement
- Information sources
- 17.6 Data validation
- Data validation
- 17.7 Validation techniques employed for market sizing
- Validation techniques employed for market sizing
- 17.8 Data synthesis
- Data synthesis
- 17.9 360 degree market analysis
- 360 degree market analysis
- 17.10 List of abbreviations
- List of abbreviations

