|
|
市場調査レポート
商品コード
1144555
ラベルフリー検出(LFD)の世界市場 2022-2026Global Label-free Detection (LFD) Market 2022-2026 |
||||||
|
|
|||||||
|
● お客様のご希望に応じて、既存データの加工や未掲載情報(例:国別セグメント)の追加などの対応が可能です。 詳細はお問い合わせください。 |
|||||||


| ラベルフリー検出(LFD)の世界市場 2022-2026 |
|
出版日: 2022年10月12日
発行: TechNavio
ページ情報: 英文 120 Pages
納期: 即納可能
|
- 全表示
- 概要
- 図表
- 目次
当レポートではラベルフリー検出(LFD)の市場規模は、2022年から2026年の間に3億6260万米ドルの増加が見込まれ、予測期間中に7.79%のCAGRで成長すると予測しています。当レポートでは、ラベルフリー検出(LFD)市場の全体分析、市場規模と予測、動向、成長促進要因・課題、さらに約25のベンダーを網羅したベンダー分析を行っています。
現在の世界の市場動向と促進要因、市場環境全体に関する最新の分析を提供しています。
市場は、創薬プログラムの増加、新興国における研究開発受託機関(CRO)の増加、LFDの優位性などによって牽引されています。
本調査では、新製品の発売が、今後数年間のラベルフリー検出(LFD)市場の成長を促進する主要な理由の1つであると特定しています。また、個別化医療の需要やCOVID-19を検査するためのLFDの普及が進んでいることも、市場の大きな需要につながるでしょう。
目次
第1章 エグゼクティブサマリー
- 市場概要
第2章 市場情勢
- 市場エコシステム
第3章 市場規模
- 市場の定義
- 市場セグメント分析
- 市場規模 2021
- 市場の見通し:2021-2026年の予測
第4章 ファイブフォース分析
- ファイブフォースの要約
- 買い手の交渉力
- 供給企業の交渉力
- 新規参入業者の脅威
- 代替品の脅威
- 競争の脅威
- 市況
第5章 エンドユーザー別市場セグメンテーション
- 市場内訳
- エンドユーザー別比較
- 製薬およびバイオテクノロジー企業 - 市場規模と予測 2021-2026
- 受託調査機関(CRO) - 市場規模と予測 2021-2026
- 学術および調査機関 - 市場規模と予測 2021-2026
- エンドユーザー別の市場機会
第6章 製品別の市場セグメンテーション
- 市場内訳
- 製品別比較
- 生化学アッセイ - 市場規模と予測 2021-2026
- 細胞ベースのアッセイ - 市場規模と予測 2021-2026
- 製品別の市場機会
第7章 顧客情勢
- 顧客情勢の概要
第8章 地域別情勢
- 地域別セグメンテーション
- 地域別比較
- 北米 - 市場規模と予測 2021-2026
- 欧州 - 市場規模と予測 2021-2026
- アジア - 市場規模と予測 2021-2026
- その他の地域(ROW) - 市場規模と予測 2021-2026
- 米国 - 市場規模と予測 2021-2026
- ドイツ - 市場規模と予測 2021-2026
- 中国 - 市場規模と予測 2021-2026
- 英国 - 市場規模と予測 2021-2026
- フランス - 市場規模と予測 2021-2026
- 地域情勢別の市場機会
第9章 促進要因、課題、および動向
- 市場促進要因
- 市場の課題
- 促進要因と課題の影響
- 市場動向
第10章 ベンダー情勢
- 概要
- ベンダー情勢
- 混乱の状況
- 業界のリスク
第11章 ベンダー分析
- 対象ベンダー
- ベンダーの市場ポジショニング
- Agilent Technologies Inc.
- Bio Rad Laboratories Inc.
- Corning Inc.
- Danaher Corp.
- General Electric Co.
- HORIBA Ltd.
- PerkinElmer Inc.
- Sartorius AG
- Spectris Plc
- Thermo Fisher Scientific Inc.
第12章 付録
Exhibits:
- Exhibits1: Executive Summary - Chart on Market Overview
- Exhibits2: Executive Summary - Data Table on Market Overview
- Exhibits3: Executive Summary - Chart on Global Market Characteristics
- Exhibits4: Executive Summary - Chart on Market By Geographical Landscape
- Exhibits5: Executive Summary - Chart on Market Segmentation by End-user
- Exhibits6: Executive Summary - Chart on Market Segmentation by Product
- Exhibits7: Executive Summary - Chart on Incremental Growth
- Exhibits8: Executive Summary - Data Table on Incremental Growth
- Exhibits9: Executive Summary - Chart on Vendor Market Positioning
- Exhibits10: Parent market
- Exhibits11: Market Characteristics
- Exhibits12: Offerings of vendors included in the market definition
- Exhibits13: Market segments
- Exhibits14: Chart on Global - Market size and forecast 2021-2026 ($ million)
- Exhibits15: Data Table on Global - Market size and forecast 2021-2026 ($ million)
- Exhibits16: Chart on Global Market: Year-over-year growth 2021-2026 (%)
- Exhibits17: Data Table on Global Market: Year-over-year growth 2021-2026 (%)
- Exhibits18: Five forces analysis - Comparison between 2021 and 2026
- Exhibits19: Chart on Bargaining power of buyers - Impact of key factors 2021 and 2026
- Exhibits20: Bargaining power of suppliers - Impact of key factors in 2021 and 2026
- Exhibits21: Threat of new entrants - Impact of key factors in 2021 and 2026
- Exhibits22: Threat of substitutes - Impact of key factors in 2021 and 2026
- Exhibits23: Threat of rivalry - Impact of key factors in 2021 and 2026
- Exhibits24: Chart on Market condition - Five forces 2021 and 2026
- Exhibits25: Chart on End-user - Market share 2021-2026 (%)
- Exhibits26: Data Table on End-user - Market share 2021-2026 (%)
- Exhibits27: Chart on Comparison by End-user
- Exhibits28: Data Table on Comparison by End-user
- Exhibits29: Chart on Pharmaceutical and biotechnology companies - Market size and forecast 2021-2026 ($ million)
- Exhibits30: Data Table on Pharmaceutical and biotechnology companies - Market size and forecast 2021-2026 ($ million)
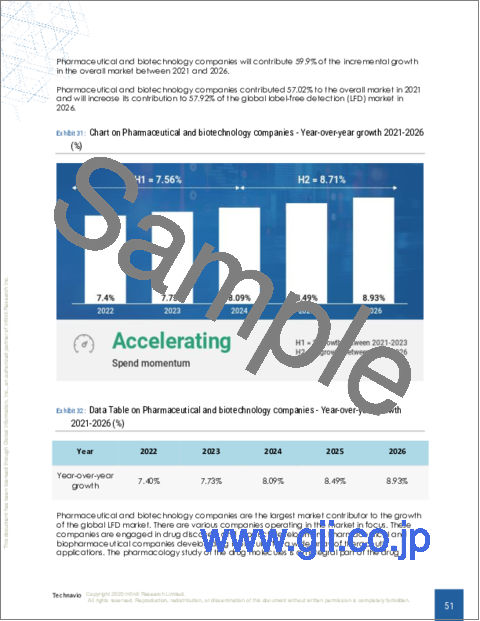
- Exhibits31: Chart on Pharmaceutical and biotechnology companies - Year-over-year growth 2021-2026 (%)
- Exhibits32: Data Table on Pharmaceutical and biotechnology companies - Year-over-year growth 2021-2026 (%)
- Exhibits33: Chart on Contract research organizations (CROs) - Market size and forecast 2021-2026 ($ million)
- Exhibits34: Data Table on Contract research organizations (CROs) - Market size and forecast 2021-2026 ($ million)
- Exhibits35: Chart on Contract research organizations (CROs) - Year-over-year growth 2021-2026 (%)
- Exhibits36: Data Table on Contract research organizations (CROs) - Year-over-year growth 2021-2026 (%)
- Exhibits37: Chart on Academic and research institutes - Market size and forecast 2021-2026 ($ million)
- Exhibits38: Data Table on Academic and research institutes - Market size and forecast 2021-2026 ($ million)
- Exhibits39: Chart on Academic and research institutes - Year-over-year growth 2021-2026 (%)
- Exhibits40: Data Table on Academic and research institutes - Year-over-year growth 2021-2026 (%)
- Exhibits41: Market opportunity by End-user ($ million)
- Exhibits42: Chart on Product - Market share 2021-2026 (%)
- Exhibits43: Data Table on Product - Market share 2021-2026 (%)
- Exhibits44: Chart on Comparison by Product
- Exhibits45: Data Table on Comparison by Product
- Exhibits46: Chart on Biochemical assays - Market size and forecast 2021-2026 ($ million)
- Exhibits47: Data Table on Biochemical assays - Market size and forecast 2021-2026 ($ million)
- Exhibits48: Chart on Biochemical assays - Year-over-year growth 2021-2026 (%)
- Exhibits49: Data Table on Biochemical assays - Year-over-year growth 2021-2026 (%)
- Exhibits50: Chart on Cell-based assays - Market size and forecast 2021-2026 ($ million)
- Exhibits51: Data Table on Cell-based assays - Market size and forecast 2021-2026 ($ million)
- Exhibits52: Chart on Cell-based assays - Year-over-year growth 2021-2026 (%)
- Exhibits53: Data Table on Cell-based assays - Year-over-year growth 2021-2026 (%)
- Exhibits54: Market opportunity by Product ($ million)
- Exhibits55: Analysis of price sensitivity, lifecycle, customer purchase basket, adoption rates, and purchase criteria
- Exhibits56: Chart on Market share By Geographical Landscape 2021-2026 (%)
- Exhibits57: Data Table on Market share By Geographical Landscape 2021-2026 (%)
- Exhibits58: Chart on Geographic comparison
- Exhibits59: Data Table on Geographic comparison
- Exhibits60: Chart on North America - Market size and forecast 2021-2026 ($ million)
- Exhibits61: Data Table on North America - Market size and forecast 2021-2026 ($ million)
- Exhibits62: Chart on North America - Year-over-year growth 2021-2026 (%)
- Exhibits63: Data Table on North America - Year-over-year growth 2021-2026 (%)
- Exhibits64: Chart on Europe - Market size and forecast 2021-2026 ($ million)
- Exhibits65: Data Table on Europe - Market size and forecast 2021-2026 ($ million)
- Exhibits66: Chart on Europe - Year-over-year growth 2021-2026 (%)
- Exhibits67: Data Table on Europe - Year-over-year growth 2021-2026 (%)
- Exhibits68: Chart on Asia - Market size and forecast 2021-2026 ($ million)
- Exhibits69: Data Table on Asia - Market size and forecast 2021-2026 ($ million)
- Exhibits70: Chart on Asia - Year-over-year growth 2021-2026 (%)
- Exhibits71: Data Table on Asia - Year-over-year growth 2021-2026 (%)
- Exhibits72: Chart on Rest of World (ROW) - Market size and forecast 2021-2026 ($ million)
- Exhibits73: Data Table on Rest of World (ROW) - Market size and forecast 2021-2026 ($ million)
- Exhibits74: Chart on Rest of World (ROW) - Year-over-year growth 2021-2026 (%)
- Exhibits75: Data Table on Rest of World (ROW) - Year-over-year growth 2021-2026 (%)
- Exhibits76: Chart on US - Market size and forecast 2021-2026 ($ million)
- Exhibits77: Data Table on US - Market size and forecast 2021-2026 ($ million)
- Exhibits78: Chart on US - Year-over-year growth 2021-2026 (%)
- Exhibits79: Data Table on US - Year-over-year growth 2021-2026 (%)
- Exhibits80: Chart on Germany - Market size and forecast 2021-2026 ($ million)
- Exhibits81: Data Table on Germany - Market size and forecast 2021-2026 ($ million)
- Exhibits82: Chart on Germany - Year-over-year growth 2021-2026 (%)
- Exhibits83: Data Table on Germany - Year-over-year growth 2021-2026 (%)
- Exhibits84: Chart on China - Market size and forecast 2021-2026 ($ million)
- Exhibits85: Data Table on China - Market size and forecast 2021-2026 ($ million)
- Exhibits86: Chart on China - Year-over-year growth 2021-2026 (%)
- Exhibits87: Data Table on China - Year-over-year growth 2021-2026 (%)
- Exhibits88: Chart on UK - Market size and forecast 2021-2026 ($ million)
- Exhibits89: Data Table on UK - Market size and forecast 2021-2026 ($ million)
- Exhibits90: Chart on UK - Year-over-year growth 2021-2026 (%)
- Exhibits91: Data Table on UK - Year-over-year growth 2021-2026 (%)
- Exhibits92: Chart on France - Market size and forecast 2021-2026 ($ million)
- Exhibits93: Data Table on France - Market size and forecast 2021-2026 ($ million)
- Exhibits94: Chart on France - Year-over-year growth 2021-2026 (%)
- Exhibits95: Data Table on France - Year-over-year growth 2021-2026 (%)
- Exhibits96: Market opportunity By Geographical Landscape ($ million)
- Exhibits97: Impact of drivers and challenges in 2021 and 2026
- Exhibits98: Overview on Criticality of inputs and Factors of differentiation
- Exhibits99: Overview on factors of disruption
- Exhibits100: Impact of key risks on business
- Exhibits101: Vendors covered
- Exhibits102: Matrix on vendor position and classification
- Exhibits103: Agilent Technologies Inc. - Overview
- Exhibits104: Agilent Technologies Inc. - Business segments
- Exhibits105: Agilent Technologies Inc. - Key news
- Exhibits106: Agilent Technologies Inc. - Key offerings
- Exhibits107: Agilent Technologies Inc. - Segment focus
- Exhibits108: Bio Rad Laboratories Inc. - Overview
- Exhibits109: Bio Rad Laboratories Inc. - Business segments
- Exhibits110: Bio Rad Laboratories Inc. - Key news
- Exhibits111: Bio Rad Laboratories Inc. - Key offerings
- Exhibits112: Bio Rad Laboratories Inc. - Segment focus
- Exhibits113: Corning Inc. - Overview
- Exhibits114: Corning Inc. - Business segments
- Exhibits115: Corning Inc. - Key offerings
- Exhibits116: Corning Inc. - Segment focus
- Exhibits117: Danaher Corp. - Overview
- Exhibits118: Danaher Corp. - Business segments
- Exhibits119: Danaher Corp. - Key news
- Exhibits120: Danaher Corp. - Key offerings
- Exhibits121: Danaher Corp. - Segment focus
- Exhibits122: General Electric Co. - Overview
- Exhibits123: General Electric Co. - Business segments
- Exhibits124: General Electric Co. - Key news
- Exhibits125: General Electric Co. - Key offerings
- Exhibits126: General Electric Co. - Segment focus
- Exhibits127: HORIBA Ltd. - Overview
- Exhibits128: HORIBA Ltd. - Business segments
- Exhibits129: HORIBA Ltd. - Key news
- Exhibits130: HORIBA Ltd. - Key offerings
- Exhibits131: HORIBA Ltd. - Segment focus
- Exhibits132: PerkinElmer Inc. - Overview
- Exhibits133: PerkinElmer Inc. - Business segments
- Exhibits134: PerkinElmer Inc. - Key news
- Exhibits135: PerkinElmer Inc. - Key offerings
- Exhibits136: PerkinElmer Inc. - Segment focus
- Exhibits137: Sartorius AG - Overview
- Exhibits138: Sartorius AG - Business segments
- Exhibits139: Sartorius AG - Key news
- Exhibits140: Sartorius AG - Key offerings
- Exhibits141: Sartorius AG - Segment focus
- Exhibits142: Spectris Plc - Overview
- Exhibits143: Spectris Plc - Business segments
- Exhibits144: Spectris Plc - Key news
- Exhibits145: Spectris Plc - Key offerings
- Exhibits146: Spectris Plc - Segment focus
- Exhibits147: Thermo Fisher Scientific Inc. - Overview
- Exhibits148: Thermo Fisher Scientific Inc. - Business segments
- Exhibits149: Thermo Fisher Scientific Inc. - Key news
- Exhibits150: Thermo Fisher Scientific Inc. - Key offerings
- Exhibits151: Thermo Fisher Scientific Inc. - Segment focus
- Exhibits152: Inclusions checklist
- Exhibits153: Exclusions checklist
- Exhibits154: Currency conversion rates for US$
- Exhibits155: Research methodology
- Exhibits156: Validation techniques employed for market sizing
- Exhibits157: Information sources
- Exhibits158: List of abbreviations
Technavio has been monitoring the label-free detection (LFD) market and it is poised to grow by $362.6 mn during 2022-2026, accelerating at a CAGR of 7.79% during the forecast period. Our report on the label-free detection (LFD) market provides a holistic analysis, market size and forecast, trends, growth drivers, and challenges, as well as vendor analysis covering around 25 vendors.
The report offers an up-to-date analysis regarding the current global market scenario, the latest trends and drivers, and the overall market environment. The market is driven by rising in drug discovery programs, an increase in contract research organizations (CROs) in developing countries, and the advantages of LFD.
The label-free detection (LFD) market analysis includes end-user, product segment, and geographic landscape.
Technavio's label-free detection (LFD) market is segmented as below:
By End-user
- Pharmaceutical and biotechnology companies
- Contract research organizations (CROs)
- Academic and research institutes
By Product
- Biochemical assays
- Cell-based assays
By Geographical Landscape
- North America
- Europe
- Asia
- Rest of World (ROW)
This study identifies the new product launches as one of the prime reasons driving the label-free detection (LFD) market growth during the next few years. Also, the demand for personalized medicine and the growing prevalence of LFD for testing Covid-19 will lead to sizable demand in the market.
Technavio presents a detailed picture of the market by the way of study, synthesis, and summation of data from multiple sources through an analysis of key parameters. Our report on the label-free detection (LFD) market covers the following areas:
- Label-free detection (LFD) market sizing
- Label-free detection (LFD) market forecast
- Label-free detection (LFD) market industry analysis
Technavio's robust vendor analysis is designed to help clients improve their market position, and in line with this, this report provides a detailed analysis of several leading label-free detection (LFD) market vendors that include Affinite Instruments, Agilent Technologies Inc., AMETEK Inc., Attana AB, Bio Rad Laboratories Inc., BioNavis Ltd., BiOptix Analytical LLC, Bruker Corp., Corning Inc., Danaher Corp., HORIBA Ltd., OLS OMNI Life Science GmbH and Co. KG, PerkinElmer Inc., Sartorius AG, Spectris Plc, SYMCEL, Thermo Fisher Scientific Inc., Waters Corp., Wyatt Technology Corp., and General Electric Co. Also, the label-free detection (LFD) market analysis report includes information on upcoming trends and challenges that will influence market growth. This is to help companies strategize and leverage all forthcoming growth opportunities.
The study was conducted using an objective combination of primary and secondary information including inputs from key participants in the industry. The report contains a comprehensive market and vendor landscape in addition to an analysis of the key vendors.
Technavio presents a detailed picture of the market by the way of study, synthesis, and summation of data from multiple sources through an analysis of key parameters such as profit, pricing, competition, and promotions. It presents various market facets by identifying the key industry influencers. The data presented is comprehensive, reliable, and a result of extensive research - both primary and secondary. Technavio's market research reports provide a complete competitive landscape and an in-depth vendor selection methodology and analysis using qualitative and quantitative research to forecast accurate market growth.
Table of Contents
1 Executive Summary
- 1.1 Market overview
- Exhibit 01: Executive Summary - Chart on Market Overview
- Exhibit 02: Executive Summary - Data Table on Market Overview
- Exhibit 03: Executive Summary - Chart on Global Market Characteristics
- Exhibit 04: Executive Summary - Chart on Market By Geographical Landscape
- Exhibit 05: Executive Summary - Chart on Market Segmentation by End-user
- Exhibit 06: Executive Summary - Chart on Market Segmentation by Product
- Exhibit 07: Executive Summary - Chart on Incremental Growth
- Exhibit 08: Executive Summary - Data Table on Incremental Growth
- Exhibit 09: Executive Summary - Chart on Vendor Market Positioning
2 Market Landscape
- 2.1 Market ecosystem
- Exhibit 10: Parent market
- Exhibit 11: Market Characteristics
3 Market Sizing
- 3.1 Market definition
- Exhibit 12: Offerings of vendors included in the market definition
- 3.2 Market segment analysis
- Exhibit 13: Market segments
- 3.3 Market size 2021
- 3.4 Market outlook: Forecast for 2021-2026
- Exhibit 14: Chart on Global - Market size and forecast 2021-2026 ($ million)
- Exhibit 15: Data Table on Global - Market size and forecast 2021-2026 ($ million)
- Exhibit 16: Chart on Global Market: Year-over-year growth 2021-2026 (%)
- Exhibit 17: Data Table on Global Market: Year-over-year growth 2021-2026 (%)
4 Five Forces Analysis
- 4.1 Five forces summary
- Exhibit 18: Five forces analysis - Comparison between 2021 and 2026
- 4.2 Bargaining power of buyers
- Exhibit 19: Chart on Bargaining power of buyers - Impact of key factors 2021 and 2026
- 4.3 Bargaining power of suppliers
- Exhibit 20: Bargaining power of suppliers - Impact of key factors in 2021 and 2026
- 4.4 Threat of new entrants
- Exhibit 21: Threat of new entrants - Impact of key factors in 2021 and 2026
- 4.5 Threat of substitutes
- Exhibit 22: Threat of substitutes - Impact of key factors in 2021 and 2026
- 4.6 Threat of rivalry
- Exhibit 23: Threat of rivalry - Impact of key factors in 2021 and 2026
- 4.7 Market condition
- Exhibit 24: Chart on Market condition - Five forces 2021 and 2026
5 Market Segmentation by End-user
- 5.1 Market segments
- Exhibit 25: Chart on End-user - Market share 2021-2026 (%)
- Exhibit 26: Data Table on End-user - Market share 2021-2026 (%)
- 5.2 Comparison by End-user
- Exhibit 27: Chart on Comparison by End-user
- Exhibit 28: Data Table on Comparison by End-user
- 5.3 Pharmaceutical and biotechnology companies - Market size and forecast 2021-2026
- Exhibit 29: Chart on Pharmaceutical and biotechnology companies - Market size and forecast 2021-2026 ($ million)
- Exhibit 30: Data Table on Pharmaceutical and biotechnology companies - Market size and forecast 2021-2026 ($ million)
- Exhibit 31: Chart on Pharmaceutical and biotechnology companies - Year-over-year growth 2021-2026 (%)
- Exhibit 32: Data Table on Pharmaceutical and biotechnology companies - Year-over-year growth 2021-2026 (%)
- 5.4 Contract research organizations (CROs) - Market size and forecast 2021-2026
- Exhibit 33: Chart on Contract research organizations (CROs) - Market size and forecast 2021-2026 ($ million)
- Exhibit 34: Data Table on Contract research organizations (CROs) - Market size and forecast 2021-2026 ($ million)
- Exhibit 35: Chart on Contract research organizations (CROs) - Year-over-year growth 2021-2026 (%)
- Exhibit 36: Data Table on Contract research organizations (CROs) - Year-over-year growth 2021-2026 (%)
- 5.5 Academic and research institutes - Market size and forecast 2021-2026
- Exhibit 37: Chart on Academic and research institutes - Market size and forecast 2021-2026 ($ million)
- Exhibit 38: Data Table on Academic and research institutes - Market size and forecast 2021-2026 ($ million)
- Exhibit 39: Chart on Academic and research institutes - Year-over-year growth 2021-2026 (%)
- Exhibit 40: Data Table on Academic and research institutes - Year-over-year growth 2021-2026 (%)
- 5.6 Market opportunity by End-user
- Exhibit 41: Market opportunity by End-user ($ million)
6 Market Segmentation by Product
- 6.1 Market segments
- Exhibit 42: Chart on Product - Market share 2021-2026 (%)
- Exhibit 43: Data Table on Product - Market share 2021-2026 (%)
- 6.2 Comparison by Product
- Exhibit 44: Chart on Comparison by Product
- Exhibit 45: Data Table on Comparison by Product
- 6.3 Biochemical assays - Market size and forecast 2021-2026
- Exhibit 46: Chart on Biochemical assays - Market size and forecast 2021-2026 ($ million)
- Exhibit 47: Data Table on Biochemical assays - Market size and forecast 2021-2026 ($ million)
- Exhibit 48: Chart on Biochemical assays - Year-over-year growth 2021-2026 (%)
- Exhibit 49: Data Table on Biochemical assays - Year-over-year growth 2021-2026 (%)
- 6.4 Cell-based assays - Market size and forecast 2021-2026
- Exhibit 50: Chart on Cell-based assays - Market size and forecast 2021-2026 ($ million)
- Exhibit 51: Data Table on Cell-based assays - Market size and forecast 2021-2026 ($ million)
- Exhibit 52: Chart on Cell-based assays - Year-over-year growth 2021-2026 (%)
- Exhibit 53: Data Table on Cell-based assays - Year-over-year growth 2021-2026 (%)
- 6.5 Market opportunity by Product
- Exhibit 54: Market opportunity by Product ($ million)
7 Customer Landscape
- 7.1 Customer landscape overview
- Exhibit 55: Analysis of price sensitivity, lifecycle, customer purchase basket, adoption rates, and purchase criteria
8 Geographic Landscape
- 8.1 Geographic segmentation
- Exhibit 56: Chart on Market share By Geographical Landscape 2021-2026 (%)
- Exhibit 57: Data Table on Market share By Geographical Landscape 2021-2026 (%)
- 8.2 Geographic comparison
- Exhibit 58: Chart on Geographic comparison
- Exhibit 59: Data Table on Geographic comparison
- 8.3 North America - Market size and forecast 2021-2026
- Exhibit 60: Chart on North America - Market size and forecast 2021-2026 ($ million)
- Exhibit 61: Data Table on North America - Market size and forecast 2021-2026 ($ million)
- Exhibit 62: Chart on North America - Year-over-year growth 2021-2026 (%)
- Exhibit 63: Data Table on North America - Year-over-year growth 2021-2026 (%)
- 8.4 Europe - Market size and forecast 2021-2026
- Exhibit 64: Chart on Europe - Market size and forecast 2021-2026 ($ million)
- Exhibit 65: Data Table on Europe - Market size and forecast 2021-2026 ($ million)
- Exhibit 66: Chart on Europe - Year-over-year growth 2021-2026 (%)
- Exhibit 67: Data Table on Europe - Year-over-year growth 2021-2026 (%)
- 8.5 Asia - Market size and forecast 2021-2026
- Exhibit 68: Chart on Asia - Market size and forecast 2021-2026 ($ million)
- Exhibit 69: Data Table on Asia - Market size and forecast 2021-2026 ($ million)
- Exhibit 70: Chart on Asia - Year-over-year growth 2021-2026 (%)
- Exhibit 71: Data Table on Asia - Year-over-year growth 2021-2026 (%)
- 8.6 Rest of World (ROW) - Market size and forecast 2021-2026
- Exhibit 72: Chart on Rest of World (ROW) - Market size and forecast 2021-2026 ($ million)
- Exhibit 73: Data Table on Rest of World (ROW) - Market size and forecast 2021-2026 ($ million)
- Exhibit 74: Chart on Rest of World (ROW) - Year-over-year growth 2021-2026 (%)
- Exhibit 75: Data Table on Rest of World (ROW) - Year-over-year growth 2021-2026 (%)
- 8.7 US - Market size and forecast 2021-2026
- Exhibit 76: Chart on US - Market size and forecast 2021-2026 ($ million)
- Exhibit 77: Data Table on US - Market size and forecast 2021-2026 ($ million)
- Exhibit 78: Chart on US - Year-over-year growth 2021-2026 (%)
- Exhibit 79: Data Table on US - Year-over-year growth 2021-2026 (%)
- 8.8 Germany - Market size and forecast 2021-2026
- Exhibit 80: Chart on Germany - Market size and forecast 2021-2026 ($ million)
- Exhibit 81: Data Table on Germany - Market size and forecast 2021-2026 ($ million)
- Exhibit 82: Chart on Germany - Year-over-year growth 2021-2026 (%)
- Exhibit 83: Data Table on Germany - Year-over-year growth 2021-2026 (%)
- 8.9 China - Market size and forecast 2021-2026
- Exhibit 84: Chart on China - Market size and forecast 2021-2026 ($ million)
- Exhibit 85: Data Table on China - Market size and forecast 2021-2026 ($ million)
- Exhibit 86: Chart on China - Year-over-year growth 2021-2026 (%)
- Exhibit 87: Data Table on China - Year-over-year growth 2021-2026 (%)
- 8.10 UK - Market size and forecast 2021-2026
- Exhibit 88: Chart on UK - Market size and forecast 2021-2026 ($ million)
- Exhibit 89: Data Table on UK - Market size and forecast 2021-2026 ($ million)
- Exhibit 90: Chart on UK - Year-over-year growth 2021-2026 (%)
- Exhibit 91: Data Table on UK - Year-over-year growth 2021-2026 (%)
- 8.11 France - Market size and forecast 2021-2026
- Exhibit 92: Chart on France - Market size and forecast 2021-2026 ($ million)
- Exhibit 93: Data Table on France - Market size and forecast 2021-2026 ($ million)
- Exhibit 94: Chart on France - Year-over-year growth 2021-2026 (%)
- Exhibit 95: Data Table on France - Year-over-year growth 2021-2026 (%)
- 8.12 Market opportunity By Geographical Landscape
- Exhibit 96: Market opportunity By Geographical Landscape ($ million)
9 Drivers, Challenges, and Trends
- 9.1 Market drivers
- 9.2 Market challenges
- 9.3 Impact of drivers and challenges
- Exhibit 97: Impact of drivers and challenges in 2021 and 2026
- 9.4 Market trends
10 Vendor Landscape
- 10.1 Overview
- 10.2 Vendor landscape
- Exhibit 98: Overview on Criticality of inputs and Factors of differentiation
- 10.3 Landscape disruption
- Exhibit 99: Overview on factors of disruption
- 10.4 Industry risks
- Exhibit 100: Impact of key risks on business
11 Vendor Analysis
- 11.1 Vendors covered
- Exhibit 101: Vendors covered
- 11.2 Market positioning of vendors
- Exhibit 102: Matrix on vendor position and classification
- 11.3 Agilent Technologies Inc.
- Exhibit 103: Agilent Technologies Inc. - Overview
- Exhibit 104: Agilent Technologies Inc. - Business segments
- Exhibit 105: Agilent Technologies Inc. - Key news
- Exhibit 106: Agilent Technologies Inc. - Key offerings
- Exhibit 107: Agilent Technologies Inc. - Segment focus
- 11.4 Bio Rad Laboratories Inc.
- Exhibit 108: Bio Rad Laboratories Inc. - Overview
- Exhibit 109: Bio Rad Laboratories Inc. - Business segments
- Exhibit 110: Bio Rad Laboratories Inc. - Key news
- Exhibit 111: Bio Rad Laboratories Inc. - Key offerings
- Exhibit 112: Bio Rad Laboratories Inc. - Segment focus
- 11.5 Corning Inc.
- Exhibit 113: Corning Inc. - Overview
- Exhibit 114: Corning Inc. - Business segments
- Exhibit 115: Corning Inc. - Key offerings
- Exhibit 116: Corning Inc. - Segment focus
- 11.6 Danaher Corp.
- Exhibit 117: Danaher Corp. - Overview
- Exhibit 118: Danaher Corp. - Business segments
- Exhibit 119: Danaher Corp. - Key news
- Exhibit 120: Danaher Corp. - Key offerings
- Exhibit 121: Danaher Corp. - Segment focus
- 11.7 General Electric Co.
- Exhibit 122: General Electric Co. - Overview
- Exhibit 123: General Electric Co. - Business segments
- Exhibit 124: General Electric Co. - Key news
- Exhibit 125: General Electric Co. - Key offerings
- Exhibit 126: General Electric Co. - Segment focus
- 11.8 HORIBA Ltd.
- Exhibit 127: HORIBA Ltd. - Overview
- Exhibit 128: HORIBA Ltd. - Business segments
- Exhibit 129: HORIBA Ltd. - Key news
- Exhibit 130: HORIBA Ltd. - Key offerings
- Exhibit 131: HORIBA Ltd. - Segment focus
- 11.9 PerkinElmer Inc.
- Exhibit 132: PerkinElmer Inc. - Overview
- Exhibit 133: PerkinElmer Inc. - Business segments
- Exhibit 134: PerkinElmer Inc. - Key news
- Exhibit 135: PerkinElmer Inc. - Key offerings
- Exhibit 136: PerkinElmer Inc. - Segment focus
- 11.10 Sartorius AG
- Exhibit 137: Sartorius AG - Overview
- Exhibit 138: Sartorius AG - Business segments
- Exhibit 139: Sartorius AG - Key news
- Exhibit 140: Sartorius AG - Key offerings
- Exhibit 141: Sartorius AG - Segment focus
- 11.11 Spectris Plc
- Exhibit 142: Spectris Plc - Overview
- Exhibit 143: Spectris Plc - Business segments
- Exhibit 144: Spectris Plc - Key news
- Exhibit 145: Spectris Plc - Key offerings
- Exhibit 146: Spectris Plc - Segment focus
- 11.12 Thermo Fisher Scientific Inc.
- Exhibit 147: Thermo Fisher Scientific Inc. - Overview
- Exhibit 148: Thermo Fisher Scientific Inc. - Business segments
- Exhibit 149: Thermo Fisher Scientific Inc. - Key news
- Exhibit 150: Thermo Fisher Scientific Inc. - Key offerings
- Exhibit 151: Thermo Fisher Scientific Inc. - Segment focus
12 Appendix
- 12.1 Scope of the report
- 12.2 Inclusions and exclusions checklist
- Exhibit 152: Inclusions checklist
- Exhibit 153: Exclusions checklist
- 12.3 Currency conversion rates for US$
- Exhibit 154: Currency conversion rates for US$
- 12.4 Research methodology
- Exhibit 155: Research methodology
- Exhibit 156: Validation techniques employed for market sizing
- Exhibit 157: Information sources
- 12.5 List of abbreviations
- Exhibit 158: List of abbreviations
- growth due to the increasing number of tests for infectious and chronic diseases: The incidence of infectious and chronic diseases has increased over the past decade. The outbreak of the COVID-19 pandemic in 2020 has increased the demand for laboratory testing for COVID-19 across the world. An increase in demand for laboratory testing for infectious diseases, such as COVID-19 and chronic diseases, will be a driver for the life sciences tools and services industry in the future. The growth of the tools and services industry will continue to be strong in emerging markets such as China and India. Developed economies such as Japan and the EU will exhibit moderate growth rates.
- product development to decrease prices: As the pricing pressure increases, life sciences tools manufacturers will have to rethink product development processes. A value first product design philosophy can help control costs and deliver what customers value the most.