|
|
市場調査レポート
商品コード
1517263
脱水オニオンフレークの世界市場 2024-2028Global dehydrated onion flakes market 2024-2028 |
||||||
|
|||||||
カスタマイズ可能
|
|||||||

| 脱水オニオンフレークの世界市場 2024-2028 |
|
出版日: 2024年06月12日
発行: TechNavio
ページ情報: 英文 144 Pages
納期: 即納可能
|

全表示
- 概要
- 図表
- 目次
脱水オニオンフレーク市場は2023-2028年に4,000万米ドル、予測期間中のCAGRは3.44%で成長すると予測されます。
当レポートでは、脱水オニオンフレーク市場の全体的な分析、市場規模・予測、動向、成長促進要因、課題、約25のベンダーを網羅したベンダー分析などを掲載しています。
現在の市場シナリオ、最新動向と促進要因、市場環境全体に関する最新分析を提供しています。市場は、加工食品産業の堅調な成長、栄養価の高い製品に対する消費者の意識の高まり、ユニークなフレーバーに対する高い需要が牽引しています。
| 市場範囲 | |
|---|---|
| 基準年 | 2024 |
| 終了年 | 2028 |
| 予測期間 | 2024-2028 |
| 成長モメンタム | 加速 |
| 前年比2024年 | 3.31% |
| CAGR | 3.44% |
| 増分額 | 4,000万米ドル |
本調査では、今後数年間の脱水オニオンフレーク市場成長を牽引する主な要因の一つとして、天然素材への嗜好の高まりを挙げています。また、すぐに食べられる製品への需要の高まりや、保存期間の長い製品への需要も、市場の大きな需要につながります。
目次
第1章 エグゼクティブサマリー
- 市場概要
第2章 市場情勢
- 市場エコシステム
- 市場の特徴
- バリューチェーン分析
第3章 市場規模の評価
- 市場の定義
- 市場セグメント分析
- 市場規模 2023
- 市場の見通し 2023-2028
第4章 市場規模実績
- 世界脱水オニオンフレーク市場 2018-2022
- エンドユーザー別セグメント分析 2018-2022
- 製品タイプ別セグメント分析 2018-2022
- 地域別セグメント分析 2018-2022
- 国別セグメント分析 2018-2022
第5章 ファイブフォース分析
- ファイブフォースの要約
- 買い手の交渉力
- 供給企業の交渉力
- 新規参入業者の脅威
- 代替品の脅威
- 競争の脅威
- 市況
第6章 市場セグメンテーション:エンドユーザー別
- 市場セグメンテーション
- 比較:エンドユーザー別
- 商用:市場規模と予測 2023-2028
- 家庭用:市場規模と予測 2023-2028
- 市場機会:エンドユーザー別
第7章 市場セグメンテーション:製品タイプ別
- 市場セグメンテーション
- 比較:製品タイプ別
- 乾燥白玉ねぎフレーク:市場規模と予測 2023-2028
- 乾燥赤玉ねぎフレーク:市場規模と予測 2023-2028
- その他:市場規模と予測 2023-2028
- 市場機会:製品タイプ別
第8章 顧客情勢
- 顧客情勢の概要
第9章 地域別情勢
- 地域別セグメンテーション
- 地域別比較
- アジア太平洋:市場規模と予測 2023-2028
- 北米:市場規模と予測 2023-2028
- 欧州:市場規模と予測 2023-2028
- 南米:市場規模と予測 2023-2028
- 中東・アフリカ:市場規模と予測 2023-2028
- 中国:市場規模と予測 2023-2028
- インド:市場規模と予測 2023-2028
- 米国:市場規模と予測 2023-2028
- ドイツ:市場規模と予測 2023-2028
- 英国:市場規模と予測 2023-2028
- 市場機会:地域情勢別
第10章 促進要因・課題・機会・抑制要因
- 市場促進要因
- 市場の課題
- 促進要因と課題の影響
- 市場の機会・抑制要因
第11章 競合情勢
- 概要
- 競合情勢
- 混乱の状況
- 業界のリスク
第12章 競合分析
- 企業プロファイル
- 企業の市場ポジショニング
- Daksh Foods Pvt. Ltd.
- Earth Expo Co
- Green Rootz
- Harmony House Foods Inc.
- Jain Farm Fresh Foods Ltd.
- JIYAN FOOD INGREDIENTS
- Natural Dehydrated Vegetables Pvt. Ltd.
- Olam Group Ltd.
- Real Dehydrated Pvt. Ltd.
- Silva International
第13章 付録
Exhibits:
- Exhibits1: Executive Summary - Chart on Market Overview
- Exhibits2: Executive Summary - Data Table on Market Overview
- Exhibits3: Executive Summary - Chart on Global Market Characteristics
- Exhibits4: Executive Summary - Chart on Market By Geographical Landscape
- Exhibits5: Executive Summary - Chart on Market Segmentation by End-user
- Exhibits6: Executive Summary - Chart on Market Segmentation by Product Type
- Exhibits7: Executive Summary - Chart on Incremental Growth
- Exhibits8: Executive Summary - Data Table on Incremental Growth
- Exhibits9: Executive Summary - Chart on Company Market Positioning
- Exhibits10: Parent Market
- Exhibits11: Data Table on - Parent Market
- Exhibits12: Market characteristics analysis
- Exhibits13: Value Chain Analysis
- Exhibits14: Offerings of companies included in the market definition
- Exhibits15: Market segments
- Exhibits16: Chart on Global - Market size and forecast 2023-2028 ($ million)
- Exhibits17: Data Table on Global - Market size and forecast 2023-2028 ($ million)
- Exhibits18: Chart on Global Market: Year-over-year growth 2023-2028 (%)
- Exhibits19: Data Table on Global Market: Year-over-year growth 2023-2028 (%)
- Exhibits20: Historic Market Size - Data Table on Global Dehydrated Onion Flakes Market 2018 - 2022 ($ million)
- Exhibits21: Historic Market Size - End-user Segment 2018 - 2022 ($ million)
- Exhibits22: Historic Market Size - Product Type Segment 2018 - 2022 ($ million)
- Exhibits23: Historic Market Size - Geography Segment 2018 - 2022 ($ million)
- Exhibits24: Historic Market Size - Country Segment 2018 - 2022 ($ million)
- Exhibits25: Five forces analysis - Comparison between 2023 and 2028
- Exhibits26: Bargaining power of buyers - Impact of key factors 2023 and 2028
- Exhibits27: Bargaining power of suppliers - Impact of key factors in 2023 and 2028
- Exhibits28: Threat of new entrants - Impact of key factors in 2023 and 2028
- Exhibits29: Threat of substitutes - Impact of key factors in 2023 and 2028
- Exhibits30: Threat of rivalry - Impact of key factors in 2023 and 2028
- Exhibits31: Chart on Market condition - Five forces 2023 and 2028
- Exhibits32: Chart on End-user - Market share 2023-2028 (%)
- Exhibits33: Data Table on End-user - Market share 2023-2028 (%)
- Exhibits34: Chart on Comparison by End-user
- Exhibits35: Data Table on Comparison by End-user
- Exhibits36: Chart on Commercial use - Market size and forecast 2023-2028 ($ million)
- Exhibits37: Data Table on Commercial use - Market size and forecast 2023-2028 ($ million)
- Exhibits38: Chart on Commercial use - Year-over-year growth 2023-2028 (%)
- Exhibits39: Data Table on Commercial use - Year-over-year growth 2023-2028 (%)
- Exhibits40: Chart on Home use - Market size and forecast 2023-2028 ($ million)
- Exhibits41: Data Table on Home use - Market size and forecast 2023-2028 ($ million)
- Exhibits42: Chart on Home use - Year-over-year growth 2023-2028 (%)
- Exhibits43: Data Table on Home use - Year-over-year growth 2023-2028 (%)
- Exhibits44: Market opportunity by End-user ($ million)
- Exhibits45: Data Table on Market opportunity by End-user ($ million)
- Exhibits46: Chart on Product Type - Market share 2023-2028 (%)
- Exhibits47: Data Table on Product Type - Market share 2023-2028 (%)
- Exhibits48: Chart on Comparison by Product Type
- Exhibits49: Data Table on Comparison by Product Type
- Exhibits50: Chart on Dehydrated white onion flakes - Market size and forecast 2023-2028 ($ million)
- Exhibits51: Data Table on Dehydrated white onion flakes - Market size and forecast 2023-2028 ($ million)
- Exhibits52: Chart on Dehydrated white onion flakes - Year-over-year growth 2023-2028 (%)
- Exhibits53: Data Table on Dehydrated white onion flakes - Year-over-year growth 2023-2028 (%)
- Exhibits54: Chart on Dehydrated red onion flakes - Market size and forecast 2023-2028 ($ million)
- Exhibits55: Data Table on Dehydrated red onion flakes - Market size and forecast 2023-2028 ($ million)
- Exhibits56: Chart on Dehydrated red onion flakes - Year-over-year growth 2023-2028 (%)
- Exhibits57: Data Table on Dehydrated red onion flakes - Year-over-year growth 2023-2028 (%)
- Exhibits58: Chart on Others - Market size and forecast 2023-2028 ($ million)
- Exhibits59: Data Table on Others - Market size and forecast 2023-2028 ($ million)
- Exhibits60: Chart on Others - Year-over-year growth 2023-2028 (%)
- Exhibits61: Data Table on Others - Year-over-year growth 2023-2028 (%)
- Exhibits62: Market opportunity by Product Type ($ million)
- Exhibits63: Data Table on Market opportunity by Product Type ($ million)
- Exhibits64: Analysis of price sensitivity, lifecycle, customer purchase basket, adoption rates, and purchase criteria
- Exhibits65: Chart on Market share By Geographical Landscape 2023-2028 (%)
- Exhibits66: Data Table on Market share By Geographical Landscape 2023-2028 (%)
- Exhibits67: Chart on Geographic comparison
- Exhibits68: Data Table on Geographic comparison
- Exhibits69: Chart on APAC - Market size and forecast 2023-2028 ($ million)
- Exhibits70: Data Table on APAC - Market size and forecast 2023-2028 ($ million)
- Exhibits71: Chart on APAC - Year-over-year growth 2023-2028 (%)
- Exhibits72: Data Table on APAC - Year-over-year growth 2023-2028 (%)
- Exhibits73: Chart on North America - Market size and forecast 2023-2028 ($ million)
- Exhibits74: Data Table on North America - Market size and forecast 2023-2028 ($ million)
- Exhibits75: Chart on North America - Year-over-year growth 2023-2028 (%)
- Exhibits76: Data Table on North America - Year-over-year growth 2023-2028 (%)
- Exhibits77: Chart on Europe - Market size and forecast 2023-2028 ($ million)
- Exhibits78: Data Table on Europe - Market size and forecast 2023-2028 ($ million)
- Exhibits79: Chart on Europe - Year-over-year growth 2023-2028 (%)
- Exhibits80: Data Table on Europe - Year-over-year growth 2023-2028 (%)
- Exhibits81: Chart on South America - Market size and forecast 2023-2028 ($ million)
- Exhibits82: Data Table on South America - Market size and forecast 2023-2028 ($ million)
- Exhibits83: Chart on South America - Year-over-year growth 2023-2028 (%)
- Exhibits84: Data Table on South America - Year-over-year growth 2023-2028 (%)
- Exhibits85: Chart on Middle East and Africa - Market size and forecast 2023-2028 ($ million)
- Exhibits86: Data Table on Middle East and Africa - Market size and forecast 2023-2028 ($ million)
- Exhibits87: Chart on Middle East and Africa - Year-over-year growth 2023-2028 (%)
- Exhibits88: Data Table on Middle East and Africa - Year-over-year growth 2023-2028 (%)
- Exhibits89: Chart on China - Market size and forecast 2023-2028 ($ million)
- Exhibits90: Data Table on China - Market size and forecast 2023-2028 ($ million)
- Exhibits91: Chart on China - Year-over-year growth 2023-2028 (%)
- Exhibits92: Data Table on China - Year-over-year growth 2023-2028 (%)
- Exhibits93: Chart on India - Market size and forecast 2023-2028 ($ million)
- Exhibits94: Data Table on India - Market size and forecast 2023-2028 ($ million)
- Exhibits95: Chart on India - Year-over-year growth 2023-2028 (%)
- Exhibits96: Data Table on India - Year-over-year growth 2023-2028 (%)
- Exhibits97: Chart on US - Market size and forecast 2023-2028 ($ million)
- Exhibits98: Data Table on US - Market size and forecast 2023-2028 ($ million)
- Exhibits99: Chart on US - Year-over-year growth 2023-2028 (%)
- Exhibits100: Data Table on US - Year-over-year growth 2023-2028 (%)
- Exhibits101: Chart on Germany - Market size and forecast 2023-2028 ($ million)
- Exhibits102: Data Table on Germany - Market size and forecast 2023-2028 ($ million)
- Exhibits103: Chart on Germany - Year-over-year growth 2023-2028 (%)
- Exhibits104: Data Table on Germany - Year-over-year growth 2023-2028 (%)
- Exhibits105: Chart on UK - Market size and forecast 2023-2028 ($ million)
- Exhibits106: Data Table on UK - Market size and forecast 2023-2028 ($ million)
- Exhibits107: Chart on UK - Year-over-year growth 2023-2028 (%)
- Exhibits108: Data Table on UK - Year-over-year growth 2023-2028 (%)
- Exhibits109: Market opportunity By Geographical Landscape ($ million)
- Exhibits110: Data Tables on Market opportunity By Geographical Landscape ($ million)
- Exhibits111: Impact of drivers and challenges in 2023 and 2028
- Exhibits112: Overview on criticality of inputs and factors of differentiation
- Exhibits113: Overview on factors of disruption
- Exhibits114: Impact of key risks on business
- Exhibits115: Companies covered
- Exhibits116: Matrix on companies position and classification
- Exhibits117: Daksh Foods Pvt. Ltd. - Overview
- Exhibits118: Daksh Foods Pvt. Ltd. - Product / Service
- Exhibits119: Daksh Foods Pvt. Ltd. - Key offerings
- Exhibits120: Earth Expo Co - Overview
- Exhibits121: Earth Expo Co - Product / Service
- Exhibits122: Earth Expo Co - Key offerings
- Exhibits123: Green Rootz - Overview
- Exhibits124: Green Rootz - Product / Service
- Exhibits125: Green Rootz - Key offerings
- Exhibits126: Harmony House Foods Inc. - Overview
- Exhibits127: Harmony House Foods Inc. - Product / Service
- Exhibits128: Harmony House Foods Inc. - Key offerings
- Exhibits129: Jain Farm Fresh Foods Ltd. - Overview
- Exhibits130: Jain Farm Fresh Foods Ltd. - Product / Service
- Exhibits131: Jain Farm Fresh Foods Ltd. - Key offerings
- Exhibits132: JIYAN FOOD INGREDIENTS - Overview
- Exhibits133: JIYAN FOOD INGREDIENTS - Product / Service
- Exhibits134: JIYAN FOOD INGREDIENTS - Key offerings
- Exhibits135: Natural Dehydrated Vegetables Pvt. Ltd. - Overview
- Exhibits136: Natural Dehydrated Vegetables Pvt. Ltd. - Product / Service
- Exhibits137: Natural Dehydrated Vegetables Pvt. Ltd. - Key offerings
- Exhibits138: Olam Group Ltd. - Overview
- Exhibits139: Olam Group Ltd. - Business segments
- Exhibits140: Olam Group Ltd. - Key news
- Exhibits141: Olam Group Ltd. - Key offerings
- Exhibits142: Olam Group Ltd. - Segment focus
- Exhibits143: Real Dehydrated Pvt. Ltd. - Overview
- Exhibits144: Real Dehydrated Pvt. Ltd. - Product / Service
- Exhibits145: Real Dehydrated Pvt. Ltd. - Key offerings
- Exhibits146: Silva International - Overview
- Exhibits147: Silva International - Product / Service
- Exhibits148: Silva International - Key offerings
- Exhibits149: Inclusions checklist
- Exhibits150: Exclusions checklist
- Exhibits151: Currency conversion rates for US$
- Exhibits152: Research methodology
- Exhibits153: Information sources
- Exhibits154: Data validation
- Exhibits155: Validation techniques employed for market sizing
- Exhibits156: Data synthesis
- Exhibits157: 360 degree market analysis
- Exhibits158: List of abbreviations
The dehydrated onion flakes market is forecasted to grow by USD 40 mn during 2023-2028, accelerating at a CAGR of 3.44% during the forecast period. The report on the dehydrated onion flakes market provides a holistic analysis, market size and forecast, trends, growth drivers, and challenges, as well as vendor analysis covering around 25 vendors.
The report offers an up-to-date analysis regarding the current market scenario, the latest trends and drivers, and the overall market environment. The market is driven by robust growth of processed food industry, rising consumer consciousness for nutritionally rich products, and high demand for unique flavors.
Technavio's dehydrated onion flakes market is segmented as below:
| Market Scope | |
|---|---|
| Base Year | 2024 |
| End Year | 2028 |
| Series Year | 2024-2028 |
| Growth Momentum | Accelerate |
| YOY 2024 | 3.31% |
| CAGR | 3.44% |
| Incremental Value | $40mn |
By End-user
- Commercial use
- Home use
By Product Type
- Dehydrated white onion flakes
- Dehydrated red onion flakes
- Others
By Geographical Landscape
- APAC
- North America
- Europe
- South America
- Middle East and Africa
This study identifies the growing preference for natural ingredients as one of the prime reasons driving the dehydrated onion flakes market growth during the next few years. Also, rising demand for ready-to-eat products and longer shelf-life product demand will lead to sizable demand in the market.
The report on the dehydrated onion flakes market covers the following areas:
- Dehydrated onion flakes market sizing
- Dehydrated onion flakes market forecast
- Dehydrated onion flakes market industry analysis
The robust vendor analysis is designed to help clients improve their market position, and in line with this, this report provides a detailed analysis of several leading dehydrated onion flakes market vendors that include BCFoods, Daksh Foods Pvt. Ltd., Earth Expo Co, Ganesh Dehy Foods, Garon Dehydrates Pvt. Ltd., GERMAN FOODS, Green Rootz, Harmony House Foods Inc., Jain Farm Fresh Foods Ltd., JIYAN FOOD INGREDIENTS, Kings Dehydrated Foods Pvt. Ltd., Murtuza Foods Pvt. Ltd., Natural Dehydrated Vegetables Pvt. Ltd., Olam Group Ltd., Pardes Dehydration Co., Real Dehydrated Pvt. Ltd., SHAKTI FOODS., Silva International, Organic Products India, and YESRAJ AGRO EXPORTS PVT. LTD.. Also, the dehydrated onion flakes market analysis report includes information on upcoming trends and challenges that will influence market growth. This is to help companies strategize and leverage all forthcoming growth opportunities.
The study was conducted using an objective combination of primary and secondary information including inputs from key participants in the industry. The report contains a comprehensive market and vendor landscape in addition to an analysis of the key vendors.
The publisher presents a detailed picture of the market by the way of study, synthesis, and summation of data from multiple sources by an analysis of key parameters such as profit, pricing, competition, and promotions. It presents various market facets by identifying the key industry influencers. The data presented is comprehensive, reliable, and a result of extensive research - both primary and secondary. The market research reports provide a complete competitive landscape and an in-depth vendor selection methodology and analysis using qualitative and quantitative research to forecast the accurate market growth.
Table of Contents
1 Executive Summary
- 1.1 Market overview
- Executive Summary - Chart on Market Overview
- Executive Summary - Data Table on Market Overview
- Executive Summary - Chart on Global Market Characteristics
- Executive Summary - Chart on Market By Geographical Landscape
- Executive Summary - Chart on Market Segmentation by End-user
- Executive Summary - Chart on Market Segmentation by Product Type
- Executive Summary - Chart on Incremental Growth
- Executive Summary - Data Table on Incremental Growth
- Executive Summary - Chart on Company Market Positioning
2 Market Landscape
- 2.1 Market ecosystem
- Parent Market
- Data Table on - Parent Market
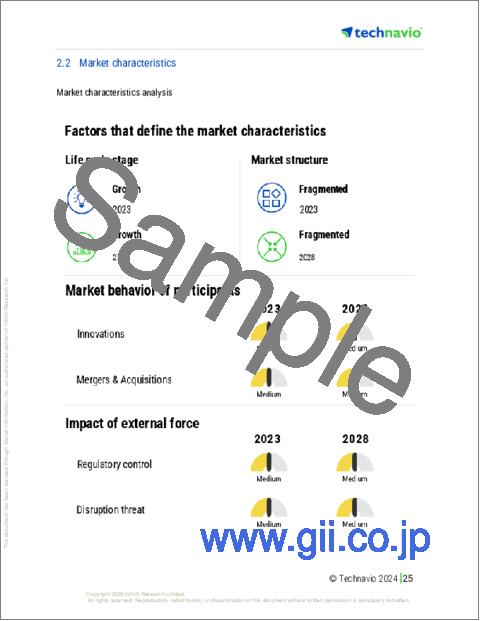
- 2.2 Market characteristics
- Market characteristics analysis
- 2.3 Value chain analysis
- Value Chain Analysis
3 Market Sizing
- 3.1 Market definition
- Offerings of companies included in the market definition
- 3.2 Market segment analysis
- Market segments
- 3.3 Market size 2023
- 3.4 Market outlook: Forecast for 2023-2028
- Chart on Global - Market size and forecast 2023-2028 ($ million)
- Data Table on Global - Market size and forecast 2023-2028 ($ million)
- Chart on Global Market: Year-over-year growth 2023-2028 (%)
- Data Table on Global Market: Year-over-year growth 2023-2028 (%)
4 Historic Market Size
- 4.1 Global Dehydrated Onion Flakes Market 2018 - 2022
- Historic Market Size - Data Table on Global Dehydrated Onion Flakes Market 2018 - 2022 ($ million)
- 4.2 End-user segment analysis 2018 - 2022
- Historic Market Size - End-user Segment 2018 - 2022 ($ million)
- 4.3 Product Type segment analysis 2018 - 2022
- Historic Market Size - Product Type Segment 2018 - 2022 ($ million)
- 4.4 Geography segment analysis 2018 - 2022
- Historic Market Size - Geography Segment 2018 - 2022 ($ million)
- 4.5 Country segment analysis 2018 - 2022
- Historic Market Size - Country Segment 2018 - 2022 ($ million)
5 Five Forces Analysis
- 5.1 Five forces summary
- Five forces analysis - Comparison between 2023 and 2028
- 5.2 Bargaining power of buyers
- Bargaining power of buyers - Impact of key factors 2023 and 2028
- 5.3 Bargaining power of suppliers
- Bargaining power of suppliers - Impact of key factors in 2023 and 2028
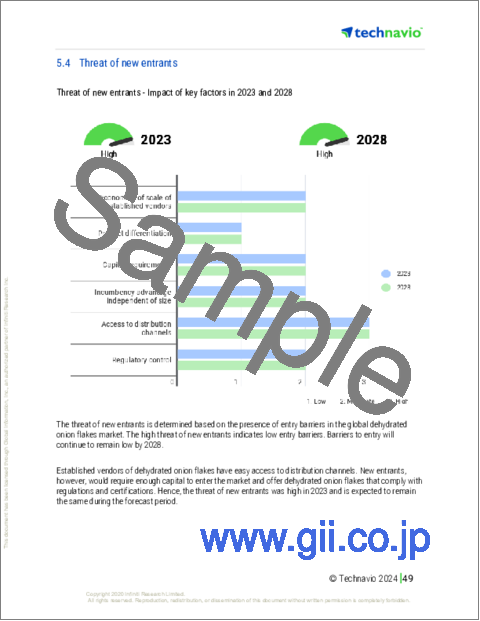
- 5.4 Threat of new entrants
- Threat of new entrants - Impact of key factors in 2023 and 2028
- 5.5 Threat of substitutes
- Threat of substitutes - Impact of key factors in 2023 and 2028
- 5.6 Threat of rivalry
- Threat of rivalry - Impact of key factors in 2023 and 2028
- 5.7 Market condition
- Chart on Market condition - Five forces 2023 and 2028
6 Market Segmentation by End-user
- 6.1 Market segments
- Chart on End-user - Market share 2023-2028 (%)
- Data Table on End-user - Market share 2023-2028 (%)
- 6.2 Comparison by End-user
- Chart on Comparison by End-user
- Data Table on Comparison by End-user
- 6.3 Commercial use - Market size and forecast 2023-2028
- Chart on Commercial use - Market size and forecast 2023-2028 ($ million)
- Data Table on Commercial use - Market size and forecast 2023-2028 ($ million)
- Chart on Commercial use - Year-over-year growth 2023-2028 (%)
- Data Table on Commercial use - Year-over-year growth 2023-2028 (%)
- 6.4 Home use - Market size and forecast 2023-2028
- Chart on Home use - Market size and forecast 2023-2028 ($ million)
- Data Table on Home use - Market size and forecast 2023-2028 ($ million)
- Chart on Home use - Year-over-year growth 2023-2028 (%)
- Data Table on Home use - Year-over-year growth 2023-2028 (%)
- 6.5 Market opportunity by End-user
- Market opportunity by End-user ($ million)
- Data Table on Market opportunity by End-user ($ million)
7 Market Segmentation by Product Type
- 7.1 Market segments
- Chart on Product Type - Market share 2023-2028 (%)
- Data Table on Product Type - Market share 2023-2028 (%)
- 7.2 Comparison by Product Type
- Chart on Comparison by Product Type
- Data Table on Comparison by Product Type
- 7.3 Dehydrated white onion flakes - Market size and forecast 2023-2028
- Chart on Dehydrated white onion flakes - Market size and forecast 2023-2028 ($ million)
- Data Table on Dehydrated white onion flakes - Market size and forecast 2023-2028 ($ million)
- Chart on Dehydrated white onion flakes - Year-over-year growth 2023-2028 (%)
- Data Table on Dehydrated white onion flakes - Year-over-year growth 2023-2028 (%)
- 7.4 Dehydrated red onion flakes - Market size and forecast 2023-2028
- Chart on Dehydrated red onion flakes - Market size and forecast 2023-2028 ($ million)
- Data Table on Dehydrated red onion flakes - Market size and forecast 2023-2028 ($ million)
- Chart on Dehydrated red onion flakes - Year-over-year growth 2023-2028 (%)
- Data Table on Dehydrated red onion flakes - Year-over-year growth 2023-2028 (%)
- 7.5 Others - Market size and forecast 2023-2028
- Chart on Others - Market size and forecast 2023-2028 ($ million)
- Data Table on Others - Market size and forecast 2023-2028 ($ million)
- Chart on Others - Year-over-year growth 2023-2028 (%)
- Data Table on Others - Year-over-year growth 2023-2028 (%)
- 7.6 Market opportunity by Product Type
- Market opportunity by Product Type ($ million)
- Data Table on Market opportunity by Product Type ($ million)
8 Customer Landscape
- 8.1 Customer landscape overview
- Analysis of price sensitivity, lifecycle, customer purchase basket, adoption rates, and purchase criteria
9 Geographic Landscape
- 9.1 Geographic segmentation
- Chart on Market share By Geographical Landscape 2023-2028 (%)
- Data Table on Market share By Geographical Landscape 2023-2028 (%)
- 9.2 Geographic comparison
- Chart on Geographic comparison
- Data Table on Geographic comparison
- 9.3 APAC - Market size and forecast 2023-2028
- Chart on APAC - Market size and forecast 2023-2028 ($ million)
- Data Table on APAC - Market size and forecast 2023-2028 ($ million)
- Chart on APAC - Year-over-year growth 2023-2028 (%)
- Data Table on APAC - Year-over-year growth 2023-2028 (%)
- 9.4 North America - Market size and forecast 2023-2028
- Chart on North America - Market size and forecast 2023-2028 ($ million)
- Data Table on North America - Market size and forecast 2023-2028 ($ million)
- Chart on North America - Year-over-year growth 2023-2028 (%)
- Data Table on North America - Year-over-year growth 2023-2028 (%)
- 9.5 Europe - Market size and forecast 2023-2028
- Chart on Europe - Market size and forecast 2023-2028 ($ million)
- Data Table on Europe - Market size and forecast 2023-2028 ($ million)
- Chart on Europe - Year-over-year growth 2023-2028 (%)
- Data Table on Europe - Year-over-year growth 2023-2028 (%)
- 9.6 South America - Market size and forecast 2023-2028
- Chart on South America - Market size and forecast 2023-2028 ($ million)
- Data Table on South America - Market size and forecast 2023-2028 ($ million)
- Chart on South America - Year-over-year growth 2023-2028 (%)
- Data Table on South America - Year-over-year growth 2023-2028 (%)
- 9.7 Middle East and Africa - Market size and forecast 2023-2028
- Chart on Middle East and Africa - Market size and forecast 2023-2028 ($ million)
- Data Table on Middle East and Africa - Market size and forecast 2023-2028 ($ million)
- Chart on Middle East and Africa - Year-over-year growth 2023-2028 (%)
- Data Table on Middle East and Africa - Year-over-year growth 2023-2028 (%)
- 9.8 China - Market size and forecast 2023-2028
- Chart on China - Market size and forecast 2023-2028 ($ million)
- Data Table on China - Market size and forecast 2023-2028 ($ million)
- Chart on China - Year-over-year growth 2023-2028 (%)
- Data Table on China - Year-over-year growth 2023-2028 (%)
- 9.9 India - Market size and forecast 2023-2028
- Chart on India - Market size and forecast 2023-2028 ($ million)
- Data Table on India - Market size and forecast 2023-2028 ($ million)
- Chart on India - Year-over-year growth 2023-2028 (%)
- Data Table on India - Year-over-year growth 2023-2028 (%)
- 9.10 US - Market size and forecast 2023-2028
- Chart on US - Market size and forecast 2023-2028 ($ million)
- Data Table on US - Market size and forecast 2023-2028 ($ million)
- Chart on US - Year-over-year growth 2023-2028 (%)
- Data Table on US - Year-over-year growth 2023-2028 (%)
- 9.11 Germany - Market size and forecast 2023-2028
- Chart on Germany - Market size and forecast 2023-2028 ($ million)
- Data Table on Germany - Market size and forecast 2023-2028 ($ million)
- Chart on Germany - Year-over-year growth 2023-2028 (%)
- Data Table on Germany - Year-over-year growth 2023-2028 (%)
- 9.12 UK - Market size and forecast 2023-2028
- Chart on UK - Market size and forecast 2023-2028 ($ million)
- Data Table on UK - Market size and forecast 2023-2028 ($ million)
- Chart on UK - Year-over-year growth 2023-2028 (%)
- Data Table on UK - Year-over-year growth 2023-2028 (%)
- 9.13 Market opportunity By Geographical Landscape
- Market opportunity By Geographical Landscape ($ million)
- Data Tables on Market opportunity By Geographical Landscape ($ million)
10 Drivers, Challenges, and Opportunity/Restraints
- 10.1 Market drivers
- 10.2 Market challenges
- 10.3 Impact of drivers and challenges
- Impact of drivers and challenges in 2023 and 2028
- 10.4 Market opportunities/restraints
11 Competitive Landscape
- 11.1 Overview
- 11.2 Competitive Landscape
- Overview on criticality of inputs and factors of differentiation
- 11.3 Landscape disruption
- Overview on factors of disruption
- 11.4 Industry risks
- Impact of key risks on business
12 Competitive Analysis
- 12.1 Companies profiled
- Companies covered
- 12.2 Market positioning of companies
- Matrix on companies position and classification
- 12.3 Daksh Foods Pvt. Ltd.
- Daksh Foods Pvt. Ltd. - Overview
- Daksh Foods Pvt. Ltd. - Product / Service
- Daksh Foods Pvt. Ltd. - Key offerings
- 12.4 Earth Expo Co
- Earth Expo Co - Overview
- Earth Expo Co - Product / Service
- Earth Expo Co - Key offerings
- 12.5 Green Rootz
- Green Rootz - Overview
- Green Rootz - Product / Service
- Green Rootz - Key offerings
- 12.6 Harmony House Foods Inc.
- Harmony House Foods Inc. - Overview
- Harmony House Foods Inc. - Product / Service
- Harmony House Foods Inc. - Key offerings
- 12.7 Jain Farm Fresh Foods Ltd.
- Jain Farm Fresh Foods Ltd. - Overview
- Jain Farm Fresh Foods Ltd. - Product / Service
- Jain Farm Fresh Foods Ltd. - Key offerings
- 12.8 JIYAN FOOD INGREDIENTS
- JIYAN FOOD INGREDIENTS - Overview
- JIYAN FOOD INGREDIENTS - Product / Service
- JIYAN FOOD INGREDIENTS - Key offerings
- 12.9 Natural Dehydrated Vegetables Pvt. Ltd.
- Natural Dehydrated Vegetables Pvt. Ltd. - Overview
- Natural Dehydrated Vegetables Pvt. Ltd. - Product / Service
- Natural Dehydrated Vegetables Pvt. Ltd. - Key offerings
- 12.10 Olam Group Ltd.
- Olam Group Ltd. - Overview
- Olam Group Ltd. - Business segments
- Olam Group Ltd. - Key news
- Olam Group Ltd. - Key offerings
- Olam Group Ltd. - Segment focus
- 12.11 Real Dehydrated Pvt. Ltd.
- Real Dehydrated Pvt. Ltd. - Overview
- Real Dehydrated Pvt. Ltd. - Product / Service
- Real Dehydrated Pvt. Ltd. - Key offerings
- 12.12 Silva International
- Silva International - Overview
- Silva International - Product / Service
- Silva International - Key offerings
13 Appendix
- 13.1 Scope of the report
- 13.2 Inclusions and exclusions checklist
- Inclusions checklist
- Exclusions checklist
- 13.3 Currency conversion rates for US$
- Currency conversion rates for US$
- 13.4 Research methodology
- Research methodology
- 13.5 Data procurement
- Information sources
- 13.6 Data validation
- Data validation
- 13.7 Validation techniques employed for market sizing
- Validation techniques employed for market sizing
- 13.8 Data synthesis
- Data synthesis
- 13.9 360 degree market analysis
- 360 degree market analysis
- 13.10 List of abbreviations
- List of abbreviations

