|
|
市場調査レポート
商品コード
1559370
バッグフィルターの世界市場、2024~2028年Global Bag Filter Market 2024-2028 |
||||||

|
|||||||
カスタマイズ可能
|
|||||||

| バッグフィルターの世界市場、2024~2028年 |
|
出版日: 2024年08月16日
発行: TechNavio
ページ情報: 英文 160 Pages
納期: 即納可能
|

全表示
- 概要
- 図表
- 目次
バッグフィルター市場、2024~2028年
バッグフィルター市場は2023~2028年に12億5,300万米ドル、予測期間中のCAGRは4.5%で成長すると予測されます。当レポートでは、バッグフィルター市場の全体的な分析、市場規模・予測、動向、成長促進要因、課題、約25のベンダーを網羅したベンダー分析などを掲載しています。
現在の市場シナリオ、最新動向と促進要因、市場環境全体に関する最新分析を提供しています。厳しい排出規制の増加、石炭火力発電所の増加、空気感染に関する意識の高まりなどが市場を牽引しています。
| 市場範囲 | |
|---|---|
| 基準年 | 2024年 |
| 終了年 | 2028年 |
| 予測期間 | 2024~2028年 |
| 成長モメンタム | 加速 |
| 前年比[2024年] | 4.23% |
| CAGR | 4.5% |
| 増分額 | 12億5,300万米ドル |
本調査では、高効率フィルターの市場開拓が、今後数年間のバッグフィルター市場成長を牽引する主要因の1つであると分析しています。また、大気汚染を削減するための複数の政府による環境・安全規制や、アジア太平洋における都市化・工業化の進展は、市場の大きな需要につながります。
目次
第1章 エグゼクティブサマリー
- 市場概要
第2章 市場情勢
- 市場エコシステム
- 市場の特徴
- バリューチェーン分析
第3章 市場規模の評価
- 市場の定義
- 市場セグメント分析
- 市場規模 2023年
- 市場の展望 2023~2028年
第4章 市場規模実績
- バッグフィルターの世界市場 2018~2022年
- エンドユーザー別セグメント分析 2018~2022年
- 製品タイプ別セグメント分析 2018~2022年
- 地域別セグメント分析 2018~2022年
- 国別セグメント分析 2018~2022年
第5章 ファイブフォース分析
- ファイブフォースの要約
- 買い手の交渉力
- 供給企業の交渉力
- 新規参入業者の脅威
- 代替品の脅威
- 競争の脅威
- 市況
第6章 市場セグメンテーション:エンドユーザー別
- 市場セグメンテーション
- 比較:エンドユーザー別
- 化学と石油化学:市場規模と予測 2023~2028年
- 食品加工:市場規模と予測 2023~2028年
- ミネラル:市場規模と予測 2023~2028年
- セメント:市場規模と予測 2023~2028年
- その他:市場規模と予測 2023~2028年
- 市場機会:エンドユーザー別
第7章 市場セグメンテーション:製品タイプ別
- 市場セグメンテーション
- 比較:製品タイプ別
- パルスジェット:市場規模と予測 2023~2028年
- リバースエア:市場規模と予測 2023~2028年
- シェーカー:市場規模と予測 2023~2028年
- 市場機会:製品タイプ別
第8章 顧客情勢
- 顧客情勢概要
第9章 地域別情勢
- 地域別セグメンテーション
- 比較:地域別
- 北米:市場規模と予測 2023~2028年
- 欧州:市場規模と予測 2023~2028年
- アジア太平洋:市場規模と予測 2023~2028年
- 南米:市場規模と予測 2023~2028年
- 中東・アフリカ:市場規模と予測 2023~2028年
- 米国:市場規模と予測 2023~2028年
- 中国:市場規模と予測 2023~2028年
- インド:市場規模と予測 2023~2028年
- 英国:市場規模と予測 2023~2028年
- ドイツ:市場規模と予測 2023~2028年
- 市場機会:地域情勢別
第10章 促進要因・課題・機会・抑制要因
- 市場促進要因
- 市場課題
- 促進要因と課題の影響
- 市場の機会・抑制要因
第11章 競合情勢
- 概要
- 競合情勢
- 混乱の状況
- 業界のリスク
第12章 競合分析
- 企業プロファイル
- 企業の市場ポジショニング
- Babcock and Wilcox Enterprises Inc.
- BWF Offermann Waldenfels and Co. KG
- Camfil AB
- Danaher Corp.
- Eaton Corp. Plc
- FLSmidth and Co. AS
- Lenntech BV
- Mitsubishi Heavy Industries Ltd.
- Parker Hannifin Corp.
- W. L. Gore and Associates Inc.
第13章 付録
Exhibits:
- Exhibits1: Executive Summary - Chart on Market Overview
- Exhibits2: Executive Summary - Data Table on Market Overview
- Exhibits3: Executive Summary - Chart on Global Market Characteristics
- Exhibits4: Executive Summary - Chart on Market By Geographical Landscape
- Exhibits5: Executive Summary - Chart on Market Segmentation by End-user
- Exhibits6: Executive Summary - Chart on Market Segmentation by Product Type
- Exhibits7: Executive Summary - Chart on Incremental Growth
- Exhibits8: Executive Summary - Data Table on Incremental Growth
- Exhibits9: Executive Summary - Chart on Company Market Positioning
- Exhibits10: Parent Market
- Exhibits11: Data Table on - Parent Market
- Exhibits12: Market characteristics analysis
- Exhibits13: Value Chain Analysis
- Exhibits14: Offerings of companies included in the market definition
- Exhibits15: Market segments
- Exhibits16: Chart on Global - Market size and forecast 2023-2028 ($ million)
- Exhibits17: Data Table on Global - Market size and forecast 2023-2028 ($ million)
- Exhibits18: Chart on Global Market: Year-over-year growth 2023-2028 (%)
- Exhibits19: Data Table on Global Market: Year-over-year growth 2023-2028 (%)
- Exhibits20: Historic Market Size - Data Table on Global Bag Filter Market 2018 - 2022 ($ million)
- Exhibits21: Historic Market Size - End-user Segment 2018 - 2022 ($ million)
- Exhibits22: Historic Market Size - Product Type Segment 2018 - 2022 ($ million)
- Exhibits23: Historic Market Size - Geography Segment 2018 - 2022 ($ million)
- Exhibits24: Historic Market Size - Country Segment 2018 - 2022 ($ million)
- Exhibits25: Five forces analysis - Comparison between 2023 and 2028
- Exhibits26: Bargaining power of buyers - Impact of key factors 2023 and 2028
- Exhibits27: Bargaining power of suppliers - Impact of key factors in 2023 and 2028
- Exhibits28: Threat of new entrants - Impact of key factors in 2023 and 2028
- Exhibits29: Threat of substitutes - Impact of key factors in 2023 and 2028
- Exhibits30: Threat of rivalry - Impact of key factors in 2023 and 2028
- Exhibits31: Chart on Market condition - Five forces 2023 and 2028
- Exhibits32: Chart on End-user - Market share 2023-2028 (%)
- Exhibits33: Data Table on End-user - Market share 2023-2028 (%)
- Exhibits34: Chart on Comparison by End-user
- Exhibits35: Data Table on Comparison by End-user
- Exhibits36: Chart on Chemical and petrochemical - Market size and forecast 2023-2028 ($ million)
- Exhibits37: Data Table on Chemical and petrochemical - Market size and forecast 2023-2028 ($ million)
- Exhibits38: Chart on Chemical and petrochemical - Year-over-year growth 2023-2028 (%)
- Exhibits39: Data Table on Chemical and petrochemical - Year-over-year growth 2023-2028 (%)
- Exhibits40: Chart on Food processing - Market size and forecast 2023-2028 ($ million)
- Exhibits41: Data Table on Food processing - Market size and forecast 2023-2028 ($ million)
- Exhibits42: Chart on Food processing - Year-over-year growth 2023-2028 (%)
- Exhibits43: Data Table on Food processing - Year-over-year growth 2023-2028 (%)
- Exhibits44: Chart on Mineral - Market size and forecast 2023-2028 ($ million)
- Exhibits45: Data Table on Mineral - Market size and forecast 2023-2028 ($ million)
- Exhibits46: Chart on Mineral - Year-over-year growth 2023-2028 (%)
- Exhibits47: Data Table on Mineral - Year-over-year growth 2023-2028 (%)
- Exhibits48: Chart on Cement - Market size and forecast 2023-2028 ($ million)
- Exhibits49: Data Table on Cement - Market size and forecast 2023-2028 ($ million)
- Exhibits50: Chart on Cement - Year-over-year growth 2023-2028 (%)
- Exhibits51: Data Table on Cement - Year-over-year growth 2023-2028 (%)
- Exhibits52: Chart on Others - Market size and forecast 2023-2028 ($ million)
- Exhibits53: Data Table on Others - Market size and forecast 2023-2028 ($ million)
- Exhibits54: Chart on Others - Year-over-year growth 2023-2028 (%)
- Exhibits55: Data Table on Others - Year-over-year growth 2023-2028 (%)
- Exhibits56: Market opportunity by End-user ($ million)
- Exhibits57: Data Table on Market opportunity by End-user ($ million)
- Exhibits58: Chart on Product Type - Market share 2023-2028 (%)
- Exhibits59: Data Table on Product Type - Market share 2023-2028 (%)
- Exhibits60: Chart on Comparison by Product Type
- Exhibits61: Data Table on Comparison by Product Type
- Exhibits62: Chart on Pulse jet - Market size and forecast 2023-2028 ($ million)
- Exhibits63: Data Table on Pulse jet - Market size and forecast 2023-2028 ($ million)
- Exhibits64: Chart on Pulse jet - Year-over-year growth 2023-2028 (%)
- Exhibits65: Data Table on Pulse jet - Year-over-year growth 2023-2028 (%)
- Exhibits66: Chart on Reverse air - Market size and forecast 2023-2028 ($ million)
- Exhibits67: Data Table on Reverse air - Market size and forecast 2023-2028 ($ million)
- Exhibits68: Chart on Reverse air - Year-over-year growth 2023-2028 (%)
- Exhibits69: Data Table on Reverse air - Year-over-year growth 2023-2028 (%)
- Exhibits70: Chart on Shaker - Market size and forecast 2023-2028 ($ million)
- Exhibits71: Data Table on Shaker - Market size and forecast 2023-2028 ($ million)
- Exhibits72: Chart on Shaker - Year-over-year growth 2023-2028 (%)
- Exhibits73: Data Table on Shaker - Year-over-year growth 2023-2028 (%)
- Exhibits74: Market opportunity by Product Type ($ million)
- Exhibits75: Data Table on Market opportunity by Product Type ($ million)
- Exhibits76: Analysis of price sensitivity, lifecycle, customer purchase basket, adoption rates, and purchase criteria
- Exhibits77: Chart on Market share By Geographical Landscape 2023-2028 (%)
- Exhibits78: Data Table on Market share By Geographical Landscape 2023-2028 (%)
- Exhibits79: Chart on Geographic comparison
- Exhibits80: Data Table on Geographic comparison
- Exhibits81: Chart on North America - Market size and forecast 2023-2028 ($ million)
- Exhibits82: Data Table on North America - Market size and forecast 2023-2028 ($ million)
- Exhibits83: Chart on North America - Year-over-year growth 2023-2028 (%)
- Exhibits84: Data Table on North America - Year-over-year growth 2023-2028 (%)
- Exhibits85: Chart on Europe - Market size and forecast 2023-2028 ($ million)
- Exhibits86: Data Table on Europe - Market size and forecast 2023-2028 ($ million)
- Exhibits87: Chart on Europe - Year-over-year growth 2023-2028 (%)
- Exhibits88: Data Table on Europe - Year-over-year growth 2023-2028 (%)
- Exhibits89: Chart on APAC - Market size and forecast 2023-2028 ($ million)
- Exhibits90: Data Table on APAC - Market size and forecast 2023-2028 ($ million)
- Exhibits91: Chart on APAC - Year-over-year growth 2023-2028 (%)
- Exhibits92: Data Table on APAC - Year-over-year growth 2023-2028 (%)
- Exhibits93: Chart on South America - Market size and forecast 2023-2028 ($ million)
- Exhibits94: Data Table on South America - Market size and forecast 2023-2028 ($ million)
- Exhibits95: Chart on South America - Year-over-year growth 2023-2028 (%)
- Exhibits96: Data Table on South America - Year-over-year growth 2023-2028 (%)
- Exhibits97: Chart on Middle East and Africa - Market size and forecast 2023-2028 ($ million)
- Exhibits98: Data Table on Middle East and Africa - Market size and forecast 2023-2028 ($ million)
- Exhibits99: Chart on Middle East and Africa - Year-over-year growth 2023-2028 (%)
- Exhibits100: Data Table on Middle East and Africa - Year-over-year growth 2023-2028 (%)
- Exhibits101: Chart on US - Market size and forecast 2023-2028 ($ million)
- Exhibits102: Data Table on US - Market size and forecast 2023-2028 ($ million)
- Exhibits103: Chart on US - Year-over-year growth 2023-2028 (%)
- Exhibits104: Data Table on US - Year-over-year growth 2023-2028 (%)
- Exhibits105: Chart on China - Market size and forecast 2023-2028 ($ million)
- Exhibits106: Data Table on China - Market size and forecast 2023-2028 ($ million)
- Exhibits107: Chart on China - Year-over-year growth 2023-2028 (%)
- Exhibits108: Data Table on China - Year-over-year growth 2023-2028 (%)
- Exhibits109: Chart on India - Market size and forecast 2023-2028 ($ million)
- Exhibits110: Data Table on India - Market size and forecast 2023-2028 ($ million)
- Exhibits111: Chart on India - Year-over-year growth 2023-2028 (%)
- Exhibits112: Data Table on India - Year-over-year growth 2023-2028 (%)
- Exhibits113: Chart on UK - Market size and forecast 2023-2028 ($ million)
- Exhibits114: Data Table on UK - Market size and forecast 2023-2028 ($ million)
- Exhibits115: Chart on UK - Year-over-year growth 2023-2028 (%)
- Exhibits116: Data Table on UK - Year-over-year growth 2023-2028 (%)
- Exhibits117: Chart on Germany - Market size and forecast 2023-2028 ($ million)
- Exhibits118: Data Table on Germany - Market size and forecast 2023-2028 ($ million)
- Exhibits119: Chart on Germany - Year-over-year growth 2023-2028 (%)
- Exhibits120: Data Table on Germany - Year-over-year growth 2023-2028 (%)
- Exhibits121: Market opportunity By Geographical Landscape ($ million)
- Exhibits122: Data Tables on Market opportunity By Geographical Landscape ($ million)
- Exhibits123: Impact of drivers and challenges in 2023 and 2028
- Exhibits124: Overview on criticality of inputs and factors of differentiation
- Exhibits125: Overview on factors of disruption
- Exhibits126: Impact of key risks on business
- Exhibits127: Companies covered
- Exhibits128: Matrix on companies position and classification
- Exhibits129: Babcock and Wilcox Enterprises Inc. - Overview
- Exhibits130: Babcock and Wilcox Enterprises Inc. - Business segments
- Exhibits131: Babcock and Wilcox Enterprises Inc. - Key news
- Exhibits132: Babcock and Wilcox Enterprises Inc. - Key offerings
- Exhibits133: Babcock and Wilcox Enterprises Inc. - Segment focus
- Exhibits134: BWF Offermann Waldenfels and Co. KG - Overview
- Exhibits135: BWF Offermann Waldenfels and Co. KG - Product / Service
- Exhibits136: BWF Offermann Waldenfels and Co. KG - Key news
- Exhibits137: BWF Offermann Waldenfels and Co. KG - Key offerings
- Exhibits138: Camfil AB - Overview
- Exhibits139: Camfil AB - Product / Service
- Exhibits140: Camfil AB - Key offerings
- Exhibits141: Danaher Corp. - Overview
- Exhibits142: Danaher Corp. - Business segments
- Exhibits143: Danaher Corp. - Key news
- Exhibits144: Danaher Corp. - Key offerings
- Exhibits145: Danaher Corp. - Segment focus
- Exhibits146: Eaton Corp. Plc - Overview
- Exhibits147: Eaton Corp. Plc - Business segments
- Exhibits148: Eaton Corp. Plc - Key news
- Exhibits149: Eaton Corp. Plc - Key offerings
- Exhibits150: Eaton Corp. Plc - Segment focus
- Exhibits151: FLSmidth and Co. AS - Overview
- Exhibits152: FLSmidth and Co. AS - Business segments
- Exhibits153: FLSmidth and Co. AS - Key news
- Exhibits154: FLSmidth and Co. AS - Key offerings
- Exhibits155: FLSmidth and Co. AS - Segment focus
- Exhibits156: Lenntech BV - Overview
- Exhibits157: Lenntech BV - Product / Service
- Exhibits158: Lenntech BV - Key offerings
- Exhibits159: Mitsubishi Heavy Industries Ltd. - Overview
- Exhibits160: Mitsubishi Heavy Industries Ltd. - Business segments
- Exhibits161: Mitsubishi Heavy Industries Ltd. - Key news
- Exhibits162: Mitsubishi Heavy Industries Ltd. - Key offerings
- Exhibits163: Mitsubishi Heavy Industries Ltd. - Segment focus
- Exhibits164: Parker Hannifin Corp. - Overview
- Exhibits165: Parker Hannifin Corp. - Business segments
- Exhibits166: Parker Hannifin Corp. - Key news
- Exhibits167: Parker Hannifin Corp. - Key offerings
- Exhibits168: Parker Hannifin Corp. - Segment focus
- Exhibits169: W. L. Gore and Associates Inc. - Overview
- Exhibits170: W. L. Gore and Associates Inc. - Product / Service
- Exhibits171: W. L. Gore and Associates Inc. - Key news
- Exhibits172: W. L. Gore and Associates Inc. - Key offerings
- Exhibits173: Inclusions checklist
- Exhibits174: Exclusions checklist
- Exhibits175: Currency conversion rates for US$
- Exhibits176: Research methodology
- Exhibits177: Information sources
- Exhibits178: Data validation
- Exhibits179: Validation techniques employed for market sizing
- Exhibits180: Data synthesis
- Exhibits181: 360 degree market analysis
- Exhibits182: List of abbreviations
Bag Filter Market 2024-2028
The bag filter market is forecasted to grow by USD 1253 mn during 2023-2028, accelerating at a CAGR of 4.5% during the forecast period. The report on the bag filter market provides a holistic analysis, market size and forecast, trends, growth drivers, and challenges, as well as vendor analysis covering around 25 vendors.
The report offers an up-to-date analysis regarding the current market scenario, the latest trends and drivers, and the overall market environment. The market is driven by rise in number of stringent emission control regulations, increase in number of coal-fired plants, and rising awareness regarding airborne infections.
| Market Scope | |
|---|---|
| Base Year | 2024 |
| End Year | 2028 |
| Series Year | 2024-2028 |
| Growth Momentum | Accelerate |
| YOY 2024 | 4.23% |
| CAGR | 4.5% |
| Incremental Value | $1253 mn |
Technavio's bag filter market is segmented as below:
By End-user
- Chemical and petrochemical
- Food processing
- Mineral
- Cement
- Others
By Product Type
- Pulse jet
- Reverse air
- Shaker
By Geographical Landscape
- North America
- Europe
- APAC
- South America
- Middle East and Africa
This study identifies the development of high-efficiency filters as one of the prime reasons driving the bag filter market growth during the next few years. Also, environment and safety regulations of several governments to reduce air pollution and rising urbanization and industrialization in APAC will lead to sizable demand in the market.
The report on the bag filter market covers the following areas:
- Bag filter market sizing
- Bag filter market forecast
- Bag filter market industry analysis
The vendor analysis is designed to help clients improve their market position, and in line with this, this report provides a detailed analysis of several leading bag filter market vendors that include Ahlstrom Munksjo Oyj, Babcock and Wilcox Enterprises Inc., BWF Offermann Waldenfels and Co. KG, Camfil AB, Danaher Corp., Donaldson Co. Inc., Eaton Corp. PLC, European Filter Corp Belgium NV, Filter Concept Pvt. Ltd., Filtration Group Corp., Fleetlife Inc., FLSmidth and Co. AS, General Electric Co., Lenntech BV, Mitsubishi Heavy Industries Ltd., Parker Hannifin Corp., Rosedale Products Inc., Unifrax I LLC, and W. L. Gore and Associates Inc.. Also, the bag filter market analysis report includes information on upcoming trends and challenges that will influence market growth. This is to help companies strategize and leverage all forthcoming growth opportunities.
The study was conducted using an objective combination of primary and secondary information including inputs from key participants in the industry. The report contains a comprehensive market and vendor landscape in addition to an analysis of the key vendors.
The publisher presents a detailed picture of the market by the way of study, synthesis, and summation of data from multiple sources by an analysis of key parameters such as profit, pricing, competition, and promotions. It presents various market facets by identifying the key industry influencers. The data presented is comprehensive, reliable, and a result of extensive research - both primary and secondary. The market research reports provide a complete competitive landscape and an in-depth vendor selection methodology and analysis using qualitative and quantitative research to forecast the accurate market growth.
Table of Contents
1 Executive Summary
- 1.1 Market overview
- Executive Summary - Chart on Market Overview
- Executive Summary - Data Table on Market Overview
- Executive Summary - Chart on Global Market Characteristics
- Executive Summary - Chart on Market By Geographical Landscape
- Executive Summary - Chart on Market Segmentation by End-user
- Executive Summary - Chart on Market Segmentation by Product Type
- Executive Summary - Chart on Incremental Growth
- Executive Summary - Data Table on Incremental Growth
- Executive Summary - Chart on Company Market Positioning
2 Market Landscape
- 2.1 Market ecosystem
- Parent Market
- Data Table on - Parent Market
- 2.2 Market characteristics
- Market characteristics analysis
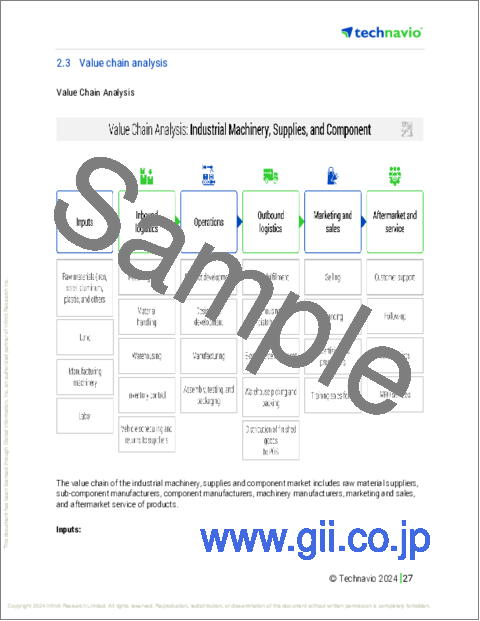
- 2.3 Value chain analysis
- Value Chain Analysis
3 Market Sizing
- 3.1 Market definition
- Offerings of companies included in the market definition
- 3.2 Market segment analysis
- Market segments
- 3.3 Market size 2023
- 3.4 Market outlook: Forecast for 2023-2028
- Chart on Global - Market size and forecast 2023-2028 ($ million)
- Data Table on Global - Market size and forecast 2023-2028 ($ million)
- Chart on Global Market: Year-over-year growth 2023-2028 (%)
- Data Table on Global Market: Year-over-year growth 2023-2028 (%)
4 Historic Market Size
- 4.1 Global Bag Filter Market 2018 - 2022
- Historic Market Size - Data Table on Global Bag Filter Market 2018 - 2022 ($ million)
- 4.2 End-user segment analysis 2018 - 2022
- Historic Market Size - End-user Segment 2018 - 2022 ($ million)
- 4.3 Product Type segment analysis 2018 - 2022
- Historic Market Size - Product Type Segment 2018 - 2022 ($ million)
- 4.4 Geography segment analysis 2018 - 2022
- Historic Market Size - Geography Segment 2018 - 2022 ($ million)
- 4.5 Country segment analysis 2018 - 2022
- Historic Market Size - Country Segment 2018 - 2022 ($ million)
5 Five Forces Analysis
- 5.1 Five forces summary
- Five forces analysis - Comparison between 2023 and 2028
- 5.2 Bargaining power of buyers
- Bargaining power of buyers - Impact of key factors 2023 and 2028
- 5.3 Bargaining power of suppliers
- Bargaining power of suppliers - Impact of key factors in 2023 and 2028
- 5.4 Threat of new entrants
- Threat of new entrants - Impact of key factors in 2023 and 2028
- 5.5 Threat of substitutes
- Threat of substitutes - Impact of key factors in 2023 and 2028
- 5.6 Threat of rivalry
- Threat of rivalry - Impact of key factors in 2023 and 2028
- 5.7 Market condition
- Chart on Market condition - Five forces 2023 and 2028
6 Market Segmentation by End-user
- 6.1 Market segments
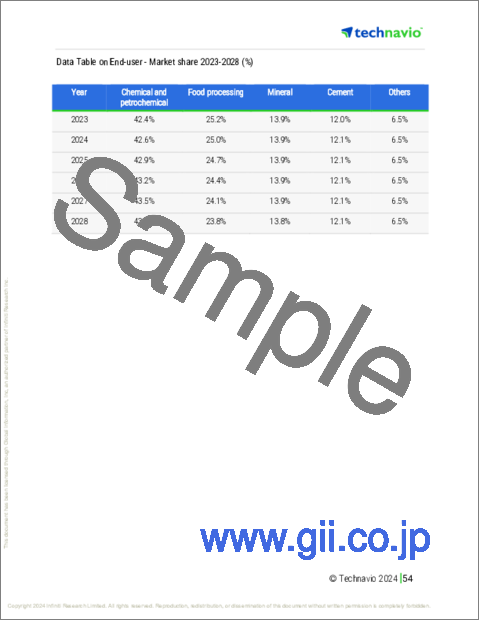
- Chart on End-user - Market share 2023-2028 (%)
- Data Table on End-user - Market share 2023-2028 (%)
- 6.2 Comparison by End-user
- Chart on Comparison by End-user
- Data Table on Comparison by End-user
- 6.3 Chemical and petrochemical - Market size and forecast 2023-2028
- Chart on Chemical and petrochemical - Market size and forecast 2023-2028 ($ million)
- Data Table on Chemical and petrochemical - Market size and forecast 2023-2028 ($ million)
- Chart on Chemical and petrochemical - Year-over-year growth 2023-2028 (%)
- Data Table on Chemical and petrochemical - Year-over-year growth 2023-2028 (%)
- 6.4 Food processing - Market size and forecast 2023-2028
- Chart on Food processing - Market size and forecast 2023-2028 ($ million)
- Data Table on Food processing - Market size and forecast 2023-2028 ($ million)
- Chart on Food processing - Year-over-year growth 2023-2028 (%)
- Data Table on Food processing - Year-over-year growth 2023-2028 (%)
- 6.5 Mineral - Market size and forecast 2023-2028
- Chart on Mineral - Market size and forecast 2023-2028 ($ million)
- Data Table on Mineral - Market size and forecast 2023-2028 ($ million)
- Chart on Mineral - Year-over-year growth 2023-2028 (%)
- Data Table on Mineral - Year-over-year growth 2023-2028 (%)
- 6.6 Cement - Market size and forecast 2023-2028
- Chart on Cement - Market size and forecast 2023-2028 ($ million)
- Data Table on Cement - Market size and forecast 2023-2028 ($ million)
- Chart on Cement - Year-over-year growth 2023-2028 (%)
- Data Table on Cement - Year-over-year growth 2023-2028 (%)
- 6.7 Others - Market size and forecast 2023-2028
- Chart on Others - Market size and forecast 2023-2028 ($ million)
- Data Table on Others - Market size and forecast 2023-2028 ($ million)
- Chart on Others - Year-over-year growth 2023-2028 (%)
- Data Table on Others - Year-over-year growth 2023-2028 (%)
- 6.8 Market opportunity by End-user
- Market opportunity by End-user ($ million)
- Data Table on Market opportunity by End-user ($ million)
7 Market Segmentation by Product Type
- 7.1 Market segments
- Chart on Product Type - Market share 2023-2028 (%)
- Data Table on Product Type - Market share 2023-2028 (%)
- 7.2 Comparison by Product Type
- Chart on Comparison by Product Type
- Data Table on Comparison by Product Type
- 7.3 Pulse jet - Market size and forecast 2023-2028
- Chart on Pulse jet - Market size and forecast 2023-2028 ($ million)
- Data Table on Pulse jet - Market size and forecast 2023-2028 ($ million)
- Chart on Pulse jet - Year-over-year growth 2023-2028 (%)
- Data Table on Pulse jet - Year-over-year growth 2023-2028 (%)
- 7.4 Reverse air - Market size and forecast 2023-2028
- Chart on Reverse air - Market size and forecast 2023-2028 ($ million)
- Data Table on Reverse air - Market size and forecast 2023-2028 ($ million)
- Chart on Reverse air - Year-over-year growth 2023-2028 (%)
- Data Table on Reverse air - Year-over-year growth 2023-2028 (%)
- 7.5 Shaker - Market size and forecast 2023-2028
- Chart on Shaker - Market size and forecast 2023-2028 ($ million)
- Data Table on Shaker - Market size and forecast 2023-2028 ($ million)
- Chart on Shaker - Year-over-year growth 2023-2028 (%)
- Data Table on Shaker - Year-over-year growth 2023-2028 (%)
- 7.6 Market opportunity by Product Type
- Market opportunity by Product Type ($ million)
- Data Table on Market opportunity by Product Type ($ million)
8 Customer Landscape
- 8.1 Customer landscape overview
- Analysis of price sensitivity, lifecycle, customer purchase basket, adoption rates, and purchase criteria
9 Geographic Landscape
- 9.1 Geographic segmentation
- Chart on Market share By Geographical Landscape 2023-2028 (%)
- Data Table on Market share By Geographical Landscape 2023-2028 (%)
- 9.2 Geographic comparison
- Chart on Geographic comparison
- Data Table on Geographic comparison
- 9.3 North America - Market size and forecast 2023-2028
- Chart on North America - Market size and forecast 2023-2028 ($ million)
- Data Table on North America - Market size and forecast 2023-2028 ($ million)
- Chart on North America - Year-over-year growth 2023-2028 (%)
- Data Table on North America - Year-over-year growth 2023-2028 (%)
- 9.4 Europe - Market size and forecast 2023-2028
- Chart on Europe - Market size and forecast 2023-2028 ($ million)
- Data Table on Europe - Market size and forecast 2023-2028 ($ million)
- Chart on Europe - Year-over-year growth 2023-2028 (%)
- Data Table on Europe - Year-over-year growth 2023-2028 (%)
- 9.5 APAC - Market size and forecast 2023-2028
- Chart on APAC - Market size and forecast 2023-2028 ($ million)
- Data Table on APAC - Market size and forecast 2023-2028 ($ million)
- Chart on APAC - Year-over-year growth 2023-2028 (%)
- Data Table on APAC - Year-over-year growth 2023-2028 (%)
- 9.6 South America - Market size and forecast 2023-2028
- Chart on South America - Market size and forecast 2023-2028 ($ million)
- Data Table on South America - Market size and forecast 2023-2028 ($ million)
- Chart on South America - Year-over-year growth 2023-2028 (%)
- Data Table on South America - Year-over-year growth 2023-2028 (%)
- 9.7 Middle East and Africa - Market size and forecast 2023-2028
- Chart on Middle East and Africa - Market size and forecast 2023-2028 ($ million)
- Data Table on Middle East and Africa - Market size and forecast 2023-2028 ($ million)
- Chart on Middle East and Africa - Year-over-year growth 2023-2028 (%)
- Data Table on Middle East and Africa - Year-over-year growth 2023-2028 (%)
- 9.8 US - Market size and forecast 2023-2028
- Chart on US - Market size and forecast 2023-2028 ($ million)
- Data Table on US - Market size and forecast 2023-2028 ($ million)
- Chart on US - Year-over-year growth 2023-2028 (%)
- Data Table on US - Year-over-year growth 2023-2028 (%)
- 9.9 China - Market size and forecast 2023-2028
- Chart on China - Market size and forecast 2023-2028 ($ million)
- Data Table on China - Market size and forecast 2023-2028 ($ million)
- Chart on China - Year-over-year growth 2023-2028 (%)
- Data Table on China - Year-over-year growth 2023-2028 (%)
- 9.10 India - Market size and forecast 2023-2028
- Chart on India - Market size and forecast 2023-2028 ($ million)
- Data Table on India - Market size and forecast 2023-2028 ($ million)
- Chart on India - Year-over-year growth 2023-2028 (%)
- Data Table on India - Year-over-year growth 2023-2028 (%)
- 9.11 UK - Market size and forecast 2023-2028
- Chart on UK - Market size and forecast 2023-2028 ($ million)
- Data Table on UK - Market size and forecast 2023-2028 ($ million)
- Chart on UK - Year-over-year growth 2023-2028 (%)
- Data Table on UK - Year-over-year growth 2023-2028 (%)
- 9.12 Germany - Market size and forecast 2023-2028
- Chart on Germany - Market size and forecast 2023-2028 ($ million)
- Data Table on Germany - Market size and forecast 2023-2028 ($ million)
- Chart on Germany - Year-over-year growth 2023-2028 (%)
- Data Table on Germany - Year-over-year growth 2023-2028 (%)
- 9.13 Market opportunity By Geographical Landscape
- Market opportunity By Geographical Landscape ($ million)
- Data Tables on Market opportunity By Geographical Landscape ($ million)
10 Drivers, Challenges, and Opportunity/Restraints
- 10.1 Market drivers
- 10.2 Market challenges
- 10.3 Impact of drivers and challenges
- Impact of drivers and challenges in 2023 and 2028
- 10.4 Market opportunities/restraints
11 Competitive Landscape
- 11.1 Overview
- 11.2 Competitive Landscape
- Overview on criticality of inputs and factors of differentiation
- 11.3 Landscape disruption
- Overview on factors of disruption
- 11.4 Industry risks
- Impact of key risks on business
12 Competitive Analysis
- 12.1 Companies profiled
- Companies covered
- 12.2 Market positioning of companies
- Matrix on companies position and classification
- 12.3 Babcock and Wilcox Enterprises Inc.
- Babcock and Wilcox Enterprises Inc. - Overview
- Babcock and Wilcox Enterprises Inc. - Business segments
- Babcock and Wilcox Enterprises Inc. - Key news
- Babcock and Wilcox Enterprises Inc. - Key offerings
- Babcock and Wilcox Enterprises Inc. - Segment focus
- 12.4 BWF Offermann Waldenfels and Co. KG
- BWF Offermann Waldenfels and Co. KG - Overview
- BWF Offermann Waldenfels and Co. KG - Product / Service
- BWF Offermann Waldenfels and Co. KG - Key news
- BWF Offermann Waldenfels and Co. KG - Key offerings
- 12.5 Camfil AB
- Camfil AB - Overview
- Camfil AB - Product / Service
- Camfil AB - Key offerings
- 12.6 Danaher Corp.
- Danaher Corp. - Overview
- Danaher Corp. - Business segments
- Danaher Corp. - Key news
- Danaher Corp. - Key offerings
- Danaher Corp. - Segment focus
- 12.7 Eaton Corp. Plc
- Eaton Corp. Plc - Overview
- Eaton Corp. Plc - Business segments
- Eaton Corp. Plc - Key news
- Eaton Corp. Plc - Key offerings
- Eaton Corp. Plc - Segment focus
- 12.8 FLSmidth and Co. AS
- FLSmidth and Co. AS - Overview
- FLSmidth and Co. AS - Business segments
- FLSmidth and Co. AS - Key news
- FLSmidth and Co. AS - Key offerings
- FLSmidth and Co. AS - Segment focus
- 12.9 Lenntech BV
- Lenntech BV - Overview
- Lenntech BV - Product / Service
- Lenntech BV - Key offerings
- 12.10 Mitsubishi Heavy Industries Ltd.
- Mitsubishi Heavy Industries Ltd. - Overview
- Mitsubishi Heavy Industries Ltd. - Business segments
- Mitsubishi Heavy Industries Ltd. - Key news
- Mitsubishi Heavy Industries Ltd. - Key offerings
- Mitsubishi Heavy Industries Ltd. - Segment focus
- 12.11 Parker Hannifin Corp.
- Parker Hannifin Corp. - Overview
- Parker Hannifin Corp. - Business segments
- Parker Hannifin Corp. - Key news
- Parker Hannifin Corp. - Key offerings
- Parker Hannifin Corp. - Segment focus
- 12.12 W. L. Gore and Associates Inc.
- W. L. Gore and Associates Inc. - Overview
- W. L. Gore and Associates Inc. - Product / Service
- W. L. Gore and Associates Inc. - Key news
- W. L. Gore and Associates Inc. - Key offerings
13 Appendix
- 13.1 Scope of the report
- 13.2 Inclusions and exclusions checklist
- Inclusions checklist
- Exclusions checklist
- 13.3 Currency conversion rates for US$
- Currency conversion rates for US$
- 13.4 Research methodology
- Research methodology
- 13.5 Data procurement
- Information sources
- 13.6 Data validation
- Data validation
- 13.7 Validation techniques employed for market sizing
- Validation techniques employed for market sizing
- 13.8 Data synthesis
- Data synthesis
- 360 degree market analysis
- 360 degree market analysis
- 13.10 List of abbreviations
- List of abbreviations

