|
|
市場調査レポート
商品コード
1515668
検査ロボットの世界市場 2024-2028Global inspection robots market 2024-2028 |
||||||

|
|||||||
カスタマイズ可能
|
|||||||


| 検査ロボットの世界市場 2024-2028 |
|
出版日: 2024年05月17日
発行: TechNavio
ページ情報: 英文 167 Pages
納期: 即納可能
|

全表示
- 概要
- 図表
- 目次
検査ロボット市場は2023-2028年に57億40万米ドル、予測期間中のCAGRは19.86%で成長すると予測されます。
当レポートでは、検査ロボット市場の全体的な分析、市場規模・予測、動向、成長促進要因、課題、約25のベンダーを網羅したベンダー分析などを掲載しています。
現在の市場シナリオ、最新動向と促進要因、市場環境全体に関する最新分析を提供しています。手動検査に対するロボット検査の優位性、自動検査・試験に対する需要の高まり、予防保全の人気の高まりなどが市場を牽引しています。
| 市場範囲 | |
|---|---|
| 基準年 | 2024 |
| 終了年 | 2028 |
| 予測期間 | 2024-2028 |
| 成長モメンタム | 加速 |
| 前年比2024年 | 16.06% |
| CAGR | 19.86% |
| 増分額 | 57億40万米ドル |
本調査では、検査ロボットのクラウドベースソリューションへのシフトが、今後数年間の検査ロボット市場成長を牽引する主要因の1つであると指摘しています。また、検査業務を最適化するためのIoTとAIの統合、モバイルロボットの進化が市場の大きな需要につながります。
目次
第1章 エグゼクティブサマリー
- 市場概要
第2章 市場情勢
- 市場エコシステム
- 市場の特徴
- バリューチェーン分析
第3章 市場規模の評価
- 市場の定義
- 市場セグメント分析
- 市場規模 2023
- 市場の見通し 2023-2028
第4章 市場規模実績
- 世界検査ロボット市場 2018-2022
- タイプ別セグメント分析 2018-2022
- エンドユーザー別セグメント分析 2018-2022
- 地域別セグメント分析 2018-2022
- 国別セグメント分析 2018-2022
第5章 ファイブフォース分析
- ファイブフォースの要約
- 買い手の交渉力
- 供給企業の交渉力
- 新規参入業者の脅威
- 代替品の脅威
- 競争の脅威
- 市況
第6章 市場セグメンテーション:タイプ別
- 市場セグメンテーション
- 比較:タイプ別
- ROV(遠隔操作無人探査機):市場規模と予測 2023-2028
- 自律型ロボット:市場規模と予測 2023-2028
- 市場機会:タイプ別
第7章 市場セグメンテーション:エンドユーザー別
- 市場セグメンテーション
- 比較:エンドユーザー別
- 石油・ガス:市場規模と予測 2023-2028
- 石油化学製品:市場規模と予測 2023-2028
- 飲食品:市場規模と予測 2023-2028
- その他:市場規模と予測 2023-2028
- 市場機会:エンドユーザー別
第8章 顧客情勢
- 顧客情勢の概要
第9章 地域別情勢
- 地域別セグメンテーション
- 地域別比較
- 欧州:市場規模と予測 2023-2028
- 北米:市場規模と予測 2023-2028
- アジア太平洋:市場規模と予測 2023-2028
- 南米:市場規模と予測 2023-2028
- 中東・アフリカ:市場規模と予測 2023-2028
- 米国:市場規模と予測 2023-2028
- 中国:市場規模と予測 2023-2028
- ドイツ:市場規模と予測 2023-2028
- 日本:市場規模と予測 2023-2028
- カナダ:市場規模と予測 2023-2028
- 市場機会:地域情勢別
第10章 促進要因・課題・機会・抑制要因
- 市場促進要因
- 市場の課題
- 促進要因と課題の影響
- 市場の機会・抑制要因
第11章 競合情勢
- 概要
- 競合情勢
- 混乱の状況
- 業界のリスク
第12章 競合分析
- 企業プロファイル
- 企業の市場ポジショニング
- Blue Origin Enterprises LP
- Cognex Corp.
- Cross Co.
- Eddyfi NDT Inc.
- General Electric Co
- Groupe Gorge SA
- IPG Photonics Corp.
- Mistras Group Inc.
- TechnipFMC plc
- Teradyne Inc.
第13章 付録
Exhibits:
- Exhibits1: Executive Summary - Chart on Market Overview
- Exhibits2: Executive Summary - Data Table on Market Overview
- Exhibits3: Executive Summary - Chart on Global Market Characteristics
- Exhibits4: Executive Summary - Chart on Market By Geographical Landscape
- Exhibits5: Executive Summary - Chart on Market Segmentation by Type
- Exhibits6: Executive Summary - Chart on Market Segmentation by End-user
- Exhibits7: Executive Summary - Chart on Incremental Growth
- Exhibits8: Executive Summary - Data Table on Incremental Growth
- Exhibits9: Executive Summary - Chart on Company Market Positioning
- Exhibits10: Parent Market
- Exhibits11: Data Table on - Parent Market
- Exhibits12: Market characteristics analysis
- Exhibits13: Value Chain Analysis
- Exhibits14: Offerings of companies included in the market definition
- Exhibits15: Market segments
- Exhibits16: Chart on Global - Market size and forecast 2023-2028 ($ million)
- Exhibits17: Data Table on Global - Market size and forecast 2023-2028 ($ million)
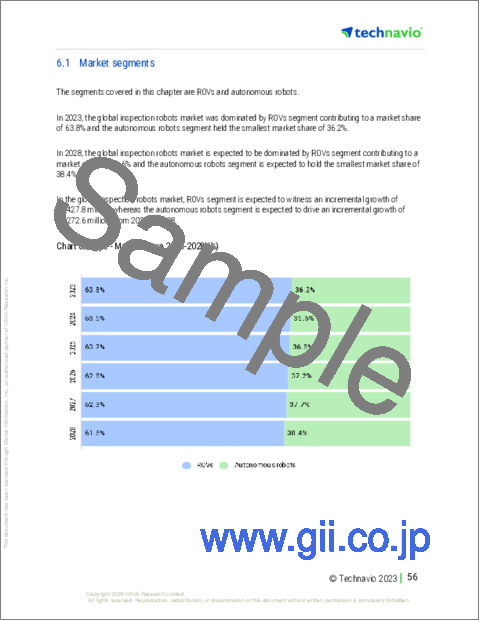
- Exhibits18: Chart on Global Market: Year-over-year growth 2023-2028 (%)
- Exhibits19: Data Table on Global Market: Year-over-year growth 2023-2028 (%)
- Exhibits20: Historic Market Size - Data Table on Global Inspection Robots Market 2018 - 2022 ($ million)
- Exhibits21: Historic Market Size - Type Segment 2018 - 2022 ($ million)
- Exhibits22: Historic Market Size - End-user Segment 2018 - 2022 ($ million)
- Exhibits23: Historic Market Size - Geography Segment 2018 - 2022 ($ million)
- Exhibits24: Historic Market Size - Country Segment 2018 - 2022 ($ million)
- Exhibits25: Five forces analysis - Comparison between 2023 and 2028
- Exhibits26: Bargaining power of buyers - Impact of key factors 2023 and 2028
- Exhibits27: Bargaining power of suppliers - Impact of key factors in 2023 and 2028
- Exhibits28: Threat of new entrants - Impact of key factors in 2023 and 2028
- Exhibits29: Threat of substitutes - Impact of key factors in 2023 and 2028
- Exhibits30: Threat of rivalry - Impact of key factors in 2023 and 2028
- Exhibits31: Chart on Market condition - Five forces 2023 and 2028
- Exhibits32: Chart on Type - Market share 2023-2028 (%)
- Exhibits33: Data Table on Type - Market share 2023-2028 (%)
- Exhibits34: Chart on Comparison by Type
- Exhibits35: Data Table on Comparison by Type
- Exhibits36: Chart on ROVs - Market size and forecast 2023-2028 ($ million)
- Exhibits37: Data Table on ROVs - Market size and forecast 2023-2028 ($ million)
- Exhibits38: Chart on ROVs - Year-over-year growth 2023-2028 (%)
- Exhibits39: Data Table on ROVs - Year-over-year growth 2023-2028 (%)
- Exhibits40: Chart on Autonomous robots - Market size and forecast 2023-2028 ($ million)
- Exhibits41: Data Table on Autonomous robots - Market size and forecast 2023-2028 ($ million)
- Exhibits42: Chart on Autonomous robots - Year-over-year growth 2023-2028 (%)
- Exhibits43: Data Table on Autonomous robots - Year-over-year growth 2023-2028 (%)
- Exhibits44: Market opportunity by Type ($ million)
- Exhibits45: Data Table on Market opportunity by Type ($ million)
- Exhibits46: Chart on End-user - Market share 2023-2028 (%)
- Exhibits47: Data Table on End-user - Market share 2023-2028 (%)
- Exhibits48: Chart on Comparison by End-user
- Exhibits49: Data Table on Comparison by End-user
- Exhibits50: Chart on Oil and gas - Market size and forecast 2023-2028 ($ million)
- Exhibits51: Data Table on Oil and gas - Market size and forecast 2023-2028 ($ million)
- Exhibits52: Chart on Oil and gas - Year-over-year growth 2023-2028 (%)
- Exhibits53: Data Table on Oil and gas - Year-over-year growth 2023-2028 (%)
- Exhibits54: Chart on Petrochemicals - Market size and forecast 2023-2028 ($ million)
- Exhibits55: Data Table on Petrochemicals - Market size and forecast 2023-2028 ($ million)
- Exhibits56: Chart on Petrochemicals - Year-over-year growth 2023-2028 (%)
- Exhibits57: Data Table on Petrochemicals - Year-over-year growth 2023-2028 (%)
- Exhibits58: Chart on Food and beverages - Market size and forecast 2023-2028 ($ million)
- Exhibits59: Data Table on Food and beverages - Market size and forecast 2023-2028 ($ million)
- Exhibits60: Chart on Food and beverages - Year-over-year growth 2023-2028 (%)
- Exhibits61: Data Table on Food and beverages - Year-over-year growth 2023-2028 (%)
- Exhibits62: Chart on Others - Market size and forecast 2023-2028 ($ million)
- Exhibits63: Data Table on Others - Market size and forecast 2023-2028 ($ million)
- Exhibits64: Chart on Others - Year-over-year growth 2023-2028 (%)
- Exhibits65: Data Table on Others - Year-over-year growth 2023-2028 (%)
- Exhibits66: Market opportunity by End-user ($ million)
- Exhibits67: Data Table on Market opportunity by End-user ($ million)
- Exhibits68: Analysis of price sensitivity, lifecycle, customer purchase basket, adoption rates, and purchase criteria
- Exhibits69: Chart on Market share By Geographical Landscape 2023-2028 (%)
- Exhibits70: Data Table on Market share By Geographical Landscape 2023-2028 (%)
- Exhibits71: Chart on Geographic comparison
- Exhibits72: Data Table on Geographic comparison
- Exhibits73: Chart on Europe - Market size and forecast 2023-2028 ($ million)
- Exhibits74: Data Table on Europe - Market size and forecast 2023-2028 ($ million)
- Exhibits75: Chart on Europe - Year-over-year growth 2023-2028 (%)
- Exhibits76: Data Table on Europe - Year-over-year growth 2023-2028 (%)
- Exhibits77: Chart on North America - Market size and forecast 2023-2028 ($ million)
- Exhibits78: Data Table on North America - Market size and forecast 2023-2028 ($ million)
- Exhibits79: Chart on North America - Year-over-year growth 2023-2028 (%)
- Exhibits80: Data Table on North America - Year-over-year growth 2023-2028 (%)
- Exhibits81: Chart on APAC - Market size and forecast 2023-2028 ($ million)
- Exhibits82: Data Table on APAC - Market size and forecast 2023-2028 ($ million)
- Exhibits83: Chart on APAC - Year-over-year growth 2023-2028 (%)
- Exhibits84: Data Table on APAC - Year-over-year growth 2023-2028 (%)
- Exhibits85: Chart on South America - Market size and forecast 2023-2028 ($ million)
- Exhibits86: Data Table on South America - Market size and forecast 2023-2028 ($ million)
- Exhibits87: Chart on South America - Year-over-year growth 2023-2028 (%)
- Exhibits88: Data Table on South America - Year-over-year growth 2023-2028 (%)
- Exhibits89: Chart on Middle East and Africa - Market size and forecast 2023-2028 ($ million)
- Exhibits90: Data Table on Middle East and Africa - Market size and forecast 2023-2028 ($ million)
- Exhibits91: Chart on Middle East and Africa - Year-over-year growth 2023-2028 (%)
- Exhibits92: Data Table on Middle East and Africa - Year-over-year growth 2023-2028 (%)
- Exhibits93: Chart on US - Market size and forecast 2023-2028 ($ million)
- Exhibits94: Data Table on US - Market size and forecast 2023-2028 ($ million)
- Exhibits95: Chart on US - Year-over-year growth 2023-2028 (%)
- Exhibits96: Data Table on US - Year-over-year growth 2023-2028 (%)
- Exhibits97: Chart on China - Market size and forecast 2023-2028 ($ million)
- Exhibits98: Data Table on China - Market size and forecast 2023-2028 ($ million)
- Exhibits99: Chart on China - Year-over-year growth 2023-2028 (%)
- Exhibits100: Data Table on China - Year-over-year growth 2023-2028 (%)
- Exhibits101: Chart on Germany - Market size and forecast 2023-2028 ($ million)
- Exhibits102: Data Table on Germany - Market size and forecast 2023-2028 ($ million)
- Exhibits103: Chart on Germany - Year-over-year growth 2023-2028 (%)
- Exhibits104: Data Table on Germany - Year-over-year growth 2023-2028 (%)
- Exhibits105: Chart on Japan - Market size and forecast 2023-2028 ($ million)
- Exhibits106: Data Table on Japan - Market size and forecast 2023-2028 ($ million)
- Exhibits107: Chart on Japan - Year-over-year growth 2023-2028 (%)
- Exhibits108: Data Table on Japan - Year-over-year growth 2023-2028 (%)
- Exhibits109: Chart on Canada - Market size and forecast 2023-2028 ($ million)
- Exhibits110: Data Table on Canada - Market size and forecast 2023-2028 ($ million)
- Exhibits111: Chart on Canada - Year-over-year growth 2023-2028 (%)
- Exhibits112: Data Table on Canada - Year-over-year growth 2023-2028 (%)
- Exhibits113: Market opportunity By Geographical Landscape ($ million)
- Exhibits114: Data Tables on Market opportunity By Geographical Landscape ($ million)
- Exhibits115: Impact of drivers and challenges in 2023 and 2028
- Exhibits116: Overview on criticality of inputs and factors of differentiation
- Exhibits117: Overview on factors of disruption
- Exhibits118: Impact of key risks on business
- Exhibits119: Companies covered
- Exhibits120: Matrix on companies position and classification
- Exhibits121: Blue Origin Enterprises LP - Overview
- Exhibits122: Blue Origin Enterprises LP - Product / Service
- Exhibits123: Blue Origin Enterprises LP - Key offerings
- Exhibits124: Cognex Corp. - Overview
- Exhibits125: Cognex Corp. - Product / Service
- Exhibits126: Cognex Corp. - Key offerings
- Exhibits127: Cross Co. - Overview
- Exhibits128: Cross Co. - Product / Service
- Exhibits129: Cross Co. - Key offerings
- Exhibits130: Eddyfi NDT Inc. - Overview
- Exhibits131: Eddyfi NDT Inc. - Product / Service
- Exhibits132: Eddyfi NDT Inc. - Key offerings
- Exhibits133: General Electric Co - Overview
- Exhibits134: General Electric Co - Business segments
- Exhibits135: General Electric Co - Key news
- Exhibits136: General Electric Co - Key offerings
- Exhibits137: General Electric Co - Segment focus
- Exhibits138: Groupe Gorge SA - Overview
- Exhibits139: Groupe Gorge SA - Business segments
- Exhibits140: Groupe Gorge SA - Key offerings
- Exhibits141: Groupe Gorge SA - Segment focus
- Exhibits142: IPG Photonics Corp. - Overview
- Exhibits143: IPG Photonics Corp. - Product / Service
- Exhibits144: IPG Photonics Corp. - Key offerings
- Exhibits145: Mistras Group Inc. - Overview
- Exhibits146: Mistras Group Inc. - Business segments
- Exhibits147: Mistras Group Inc. - Key offerings
- Exhibits148: Mistras Group Inc. - Segment focus
- Exhibits149: TechnipFMC plc - Overview
- Exhibits150: TechnipFMC plc - Business segments
- Exhibits151: TechnipFMC plc - Key offerings
- Exhibits152: TechnipFMC plc - Segment focus
- Exhibits153: Teradyne Inc. - Overview
- Exhibits154: Teradyne Inc. - Business segments
- Exhibits155: Teradyne Inc. - Key news
- Exhibits156: Teradyne Inc. - Key offerings
- Exhibits157: Teradyne Inc. - Segment focus
- Exhibits158: Inclusions checklist
- Exhibits159: Exclusions checklist
- Exhibits160: Currency conversion rates for US$
- Exhibits161: Research methodology
- Exhibits162: Information sources
- Exhibits163: Data validation
- Exhibits164: Validation techniques employed for market sizing
- Exhibits165: Data synthesis
- Exhibits166: 360 degree market analysis
- Exhibits167: List of abbreviations
The inspection robots market is forecasted to grow by USD 5700.4 mn during 2023-2028, accelerating at a CAGR of 19.86% during the forecast period. The report on the inspection robots market provides a holistic analysis, market size and forecast, trends, growth drivers, and challenges, as well as vendor analysis covering around 25 vendors.
The report offers an up-to-date analysis regarding the current market scenario, the latest trends and drivers, and the overall market environment. The market is driven by advantages of robotic inspection over manual inspection, rising demand for automated inspection and testing, and increasing popularity of preventive maintenance.
Technavio's inspection robots market is segmented as below:
| Market Scope | |
|---|---|
| Base Year | 2024 |
| End Year | 2028 |
| Series Year | 2024-2028 |
| Growth Momentum | Accelerate |
| YOY 2024 | 16.06% |
| CAGR | 19.86% |
| Incremental Value | $5700.4mn |
ByType
- ROVs
- Autonomous robots
ByEnd-user
- Oil and gas
- Petrochemicals
- Food and beverages
- Others
ByGeography
- Europe
- North America
- APAC
- South America
- Middle East and Africa
This study identifies the shift towards cloud-based solutions in inspection robots as one of the prime reasons driving the inspection robots market growth during the next few years. Also, integration of iot and ai to optimize inspection operations and advancements in mobile robots will lead to sizable demand in the market.
The report on the inspection robots market covers the following areas:
- Inspection robots market sizing
- Inspection robots market forecast
- Inspection robots market industry analysis
The robust vendor analysis is designed to help clients improve their market position, and in line with this, this report provides a detailed analysis of several leading inspection robots market vendors that include Blue Origin Enterprises LP, Cognex Corp., Cross Co., Cyberhawk Innovations, Eddyfi Technologies, FARO Technologies Inc., Flyability SA, GECKO ROBOTICS INC., General Electric Co., Genesis Systems, Groupe Gorge SA, Invert Robotics Group Ltd., IPG Photonics Corp., JH Robotics Inc, Mistras Group Inc., Robotic Automation Systems, SuperDroid Robots Inc., TechnipFMC plc, and Teradyne Inc.. Also, the inspection robots market analysis report includes information on upcoming trends and challenges that will influence market growth. This is to help companies strategize and leverage all forthcoming growth opportunities.
The study was conducted using an objective combination of primary and secondary information including inputs from key participants in the industry. The report contains a comprehensive market and vendor landscape in addition to an analysis of the key vendors.
The publisher presents a detailed picture of the market by the way of study, synthesis, and summation of data from multiple sources by an analysis of key parameters such as profit, pricing, competition, and promotions. It presents various market facets by identifying the key industry influencers. The data presented is comprehensive, reliable, and a result of extensive research - both primary and secondary. The market research reports provide a complete competitive landscape and an in-depth vendor selection methodology and analysis using qualitative and quantitative research to forecast the accurate market growth.
Table of Contents
1 Executive Summary
- 1.1 Market overview
- Executive Summary - Chart on Market Overview
- Executive Summary - Data Table on Market Overview
- Executive Summary - Chart on Global Market Characteristics
- Executive Summary - Chart on Market By Geographical Landscape
- Executive Summary - Chart on Market Segmentation by Type
- Executive Summary - Chart on Market Segmentation by End-user
- Executive Summary - Chart on Incremental Growth
- Executive Summary - Data Table on Incremental Growth
- Executive Summary - Chart on Company Market Positioning
2 Market Landscape
- 2.1 Market ecosystem
- Parent Market
- Data Table on - Parent Market
- 2.2 Market characteristics
- Market characteristics analysis
- 2.3 Value chain analysis
- Value Chain Analysis
3 Market Sizing
- 3.1 Market definition
- Offerings of companies included in the market definition
- 3.2 Market segment analysis
- Market segments
- 3.3 Market size 2023
- 3.4 Market outlook: Forecast for 2023-2028
- Chart on Global - Market size and forecast 2023-2028 ($ million)
- Data Table on Global - Market size and forecast 2023-2028 ($ million)
- Chart on Global Market: Year-over-year growth 2023-2028 (%)
- Data Table on Global Market: Year-over-year growth 2023-2028 (%)
4 Historic Market Size
- 4.1 Global Inspection Robots Market 2018 - 2022
- Historic Market Size - Data Table on Global Inspection Robots Market 2018 - 2022 ($ million)
- 4.2 Type segment analysis 2018 - 2022
- Historic Market Size - Type Segment 2018 - 2022 ($ million)
- 4.3 End-user segment analysis 2018 - 2022
- Historic Market Size - End-user Segment 2018 - 2022 ($ million)
- 4.4 Geography segment analysis 2018 - 2022
- Historic Market Size - Geography Segment 2018 - 2022 ($ million)
- 4.5 Country segment analysis 2018 - 2022
- Historic Market Size - Country Segment 2018 - 2022 ($ million)
5 Five Forces Analysis
- 5.1 Five forces summary
- Five forces analysis - Comparison between 2023 and 2028
- 5.2 Bargaining power of buyers
- Bargaining power of buyers - Impact of key factors 2023 and 2028
- 5.3 Bargaining power of suppliers
- Bargaining power of suppliers - Impact of key factors in 2023 and 2028
- 5.4 Threat of new entrants
- Threat of new entrants - Impact of key factors in 2023 and 2028
- 5.5 Threat of substitutes
- Threat of substitutes - Impact of key factors in 2023 and 2028
- 5.6 Threat of rivalry
- Threat of rivalry - Impact of key factors in 2023 and 2028
- 5.7 Market condition
- Chart on Market condition - Five forces 2023 and 2028
6 Market Segmentation by Type
- 6.1 Market segments
- Chart on Type - Market share 2023-2028 (%)
- Data Table on Type - Market share 2023-2028 (%)
- 6.2 Comparison by Type
- Chart on Comparison by Type
- Data Table on Comparison by Type
- 6.3 ROVs - Market size and forecast 2023-2028
- Chart on ROVs - Market size and forecast 2023-2028 ($ million)
- Data Table on ROVs - Market size and forecast 2023-2028 ($ million)
- Chart on ROVs - Year-over-year growth 2023-2028 (%)
- Data Table on ROVs - Year-over-year growth 2023-2028 (%)
- 6.4 Autonomous robots - Market size and forecast 2023-2028
- Chart on Autonomous robots - Market size and forecast 2023-2028 ($ million)
- Data Table on Autonomous robots - Market size and forecast 2023-2028 ($ million)
- Chart on Autonomous robots - Year-over-year growth 2023-2028 (%)
- Data Table on Autonomous robots - Year-over-year growth 2023-2028 (%)
- 6.5 Market opportunity by Type
- Market opportunity by Type ($ million)
- Data Table on Market opportunity by Type ($ million)
7 Market Segmentation by End-user
- 7.1 Market segments
- Chart on End-user - Market share 2023-2028 (%)
- Data Table on End-user - Market share 2023-2028 (%)
- 7.2 Comparison by End-user
- Chart on Comparison by End-user
- Data Table on Comparison by End-user
- 7.3 Oil and gas - Market size and forecast 2023-2028
- Chart on Oil and gas - Market size and forecast 2023-2028 ($ million)
- Data Table on Oil and gas - Market size and forecast 2023-2028 ($ million)
- Chart on Oil and gas - Year-over-year growth 2023-2028 (%)
- Data Table on Oil and gas - Year-over-year growth 2023-2028 (%)
- 7.4 Petrochemicals - Market size and forecast 2023-2028
- Chart on Petrochemicals - Market size and forecast 2023-2028 ($ million)
- Data Table on Petrochemicals - Market size and forecast 2023-2028 ($ million)
- Chart on Petrochemicals - Year-over-year growth 2023-2028 (%)
- Data Table on Petrochemicals - Year-over-year growth 2023-2028 (%)
- 7.5 Food and beverages - Market size and forecast 2023-2028
- Chart on Food and beverages - Market size and forecast 2023-2028 ($ million)
- Data Table on Food and beverages - Market size and forecast 2023-2028 ($ million)
- Chart on Food and beverages - Year-over-year growth 2023-2028 (%)
- Data Table on Food and beverages - Year-over-year growth 2023-2028 (%)
- 7.6 Others - Market size and forecast 2023-2028
- Chart on Others - Market size and forecast 2023-2028 ($ million)
- Data Table on Others - Market size and forecast 2023-2028 ($ million)
- Chart on Others - Year-over-year growth 2023-2028 (%)
- Data Table on Others - Year-over-year growth 2023-2028 (%)
- 7.7 Market opportunity by End-user
- Market opportunity by End-user ($ million)
- Data Table on Market opportunity by End-user ($ million)
8 Customer Landscape
- 8.1 Customer landscape overview
- Analysis of price sensitivity, lifecycle, customer purchase basket, adoption rates, and purchase criteria
9 Geographic Landscape
- 9.1 Geographic segmentation
- Chart on Market share By Geographical Landscape 2023-2028 (%)
- Data Table on Market share By Geographical Landscape 2023-2028 (%)
- 9.2 Geographic comparison
- Chart on Geographic comparison
- Data Table on Geographic comparison
- 9.3 Europe - Market size and forecast 2023-2028
- Chart on Europe - Market size and forecast 2023-2028 ($ million)
- Data Table on Europe - Market size and forecast 2023-2028 ($ million)
- Chart on Europe - Year-over-year growth 2023-2028 (%)
- Data Table on Europe - Year-over-year growth 2023-2028 (%)
- 9.4 North America - Market size and forecast 2023-2028
- Chart on North America - Market size and forecast 2023-2028 ($ million)
- Data Table on North America - Market size and forecast 2023-2028 ($ million)
- Chart on North America - Year-over-year growth 2023-2028 (%)
- Data Table on North America - Year-over-year growth 2023-2028 (%)
- 9.5 APAC - Market size and forecast 2023-2028
- Chart on APAC - Market size and forecast 2023-2028 ($ million)
- Data Table on APAC - Market size and forecast 2023-2028 ($ million)
- Chart on APAC - Year-over-year growth 2023-2028 (%)
- Data Table on APAC - Year-over-year growth 2023-2028 (%)
- 9.6 South America - Market size and forecast 2023-2028
- Chart on South America - Market size and forecast 2023-2028 ($ million)
- Data Table on South America - Market size and forecast 2023-2028 ($ million)
- Chart on South America - Year-over-year growth 2023-2028 (%)
- Data Table on South America - Year-over-year growth 2023-2028 (%)
- 9.7 Middle East and Africa - Market size and forecast 2023-2028
- Chart on Middle East and Africa - Market size and forecast 2023-2028 ($ million)
- Data Table on Middle East and Africa - Market size and forecast 2023-2028 ($ million)
- Chart on Middle East and Africa - Year-over-year growth 2023-2028 (%)
- Data Table on Middle East and Africa - Year-over-year growth 2023-2028 (%)
- 9.8 US - Market size and forecast 2023-2028
- Chart on US - Market size and forecast 2023-2028 ($ million)
- Data Table on US - Market size and forecast 2023-2028 ($ million)
- Chart on US - Year-over-year growth 2023-2028 (%)
- Data Table on US - Year-over-year growth 2023-2028 (%)
- 9.9 China - Market size and forecast 2023-2028
- Chart on China - Market size and forecast 2023-2028 ($ million)
- Data Table on China - Market size and forecast 2023-2028 ($ million)
- Chart on China - Year-over-year growth 2023-2028 (%)
- Data Table on China - Year-over-year growth 2023-2028 (%)
- 9.10 Germany - Market size and forecast 2023-2028
- Chart on Germany - Market size and forecast 2023-2028 ($ million)
- Data Table on Germany - Market size and forecast 2023-2028 ($ million)
- Chart on Germany - Year-over-year growth 2023-2028 (%)
- Data Table on Germany - Year-over-year growth 2023-2028 (%)
- 9.11 Japan - Market size and forecast 2023-2028
- Chart on Japan - Market size and forecast 2023-2028 ($ million)
- Data Table on Japan - Market size and forecast 2023-2028 ($ million)
- Chart on Japan - Year-over-year growth 2023-2028 (%)
- Data Table on Japan - Year-over-year growth 2023-2028 (%)
- 9.12 Canada - Market size and forecast 2023-2028
- Chart on Canada - Market size and forecast 2023-2028 ($ million)
- Data Table on Canada - Market size and forecast 2023-2028 ($ million)
- Chart on Canada - Year-over-year growth 2023-2028 (%)
- Data Table on Canada - Year-over-year growth 2023-2028 (%)
- 9.13 Market opportunity By Geographical Landscape
- Market opportunity By Geographical Landscape ($ million)
- Data Tables on Market opportunity By Geographical Landscape ($ million)
10 Drivers, Challenges, and Opportunity/Restraints
- 10.1 Market drivers
- 10.2 Market challenges
- 10.3 Impact of drivers and challenges
- Impact of drivers and challenges in 2023 and 2028
- 10.4 Market opportunities/restraints
11 Competitive Landscape
- 11.1 Overview
- 11.2 Competitive Landscape
- Overview on criticality of inputs and factors of differentiation
- 11.3 Landscape disruption
- Overview on factors of disruption
- 11.4 Industry risks
- Impact of key risks on business
12 Competitive Analysis
- 12.1 Companies profiled
- Companies covered
- 12.2 Market positioning of companies
- Matrix on companies position and classification
- 12.3 Blue Origin Enterprises LP
- Blue Origin Enterprises LP - Overview
- Blue Origin Enterprises LP - Product / Service
- Blue Origin Enterprises LP - Key offerings
- 12.4 Cognex Corp.
- Cognex Corp. - Overview
- Cognex Corp. - Product / Service
- Cognex Corp. - Key offerings
- 12.5 Cross Co.
- Cross Co. - Overview
- Cross Co. - Product / Service
- Cross Co. - Key offerings
- 12.6 Eddyfi NDT Inc.
- Eddyfi NDT Inc. - Overview
- Eddyfi NDT Inc. - Product / Service
- Eddyfi NDT Inc. - Key offerings
- 12.7 General Electric Co
- General Electric Co - Overview
- General Electric Co - Business segments
- General Electric Co - Key news
- General Electric Co - Key offerings
- General Electric Co - Segment focus
- 12.8 Groupe Gorge SA
- Groupe Gorge SA - Overview
- Groupe Gorge SA - Business segments
- Groupe Gorge SA - Key offerings
- Groupe Gorge SA - Segment focus
- 12.9 IPG Photonics Corp.
- IPG Photonics Corp. - Overview
- IPG Photonics Corp. - Product / Service
- IPG Photonics Corp. - Key offerings
- 12.10 Mistras Group Inc.
- Mistras Group Inc. - Overview
- Mistras Group Inc. - Business segments
- Mistras Group Inc. - Key offerings
- Mistras Group Inc. - Segment focus
- 12.11 TechnipFMC plc
- TechnipFMC plc - Overview
- TechnipFMC plc - Business segments
- TechnipFMC plc - Key offerings
- TechnipFMC plc - Segment focus
- 12.12 Teradyne Inc.
- Teradyne Inc. - Overview
- Teradyne Inc. - Business segments
- Teradyne Inc. - Key news
- Teradyne Inc. - Key offerings
- Teradyne Inc. - Segment focus
13 Appendix
- 13.1 Scope of the report
- 13.2 Inclusions and exclusions checklist
- Inclusions checklist
- Exclusions checklist
- 13.3 Currency conversion rates for US$
- Currency conversion rates for US$
- 13.4 Research methodology
- Research methodology
- 13.5 Data procurement
- Information sources
- 13.6 Data validation
- Data validation
- 13.7 Validation techniques employed for market sizing
- Validation techniques employed for market sizing
- 13.8 Data synthesis
- Data synthesis
- 13.9 360 degree market analysis
- 360 degree market analysis
- 13.10 List of abbreviations
- List of abbreviations
