|
|
市場調査レポート
商品コード
1462463
ニュートリゲノミクスの世界市場 2024-2028Global Nutrigenomics Market 2024-2028 |
||||||
|
|||||||
カスタマイズ可能
|
|||||||

| ニュートリゲノミクスの世界市場 2024-2028 |
|
出版日: 2024年04月01日
発行: TechNavio
ページ情報: 英文 162 Pages
納期: 即納可能
|

全表示
- 概要
- 図表
- 目次
ニュートリゲノミクス市場は2023-2028年に9億9,773万米ドル、予測期間中のCAGRは13.87%で成長すると予測されます。
当レポートでは、ニュートリゲノミクス市場の全体的な分析、市場規模・予測、動向、成長促進要因、課題、約25のベンダーを網羅したベンダー分析などを掲載しています。
現在の市場シナリオ、最新動向と促進要因、市場環境全体に関する最新分析を提供しています。市場は、医療費の増加、ニュートリゲノミクス分野における政府および民間利害関係者による投資の増加、肥満の有病率の増加によって牽引されています。
| 市場範囲 | |
|---|---|
| 基準年 | 2024 |
| 終了年 | 2028 |
| 予測期間 | 2024-2028 |
| 成長モメンタム | 加速 |
| 前年比2024年 | 12.85% |
| CAGR | 13.87% |
| 増分額 | 9億9,773万米ドル |
本調査では、今後数年間のニュートリゲノミクス市場成長を牽引する主要因の1つとして、ニュートリゲノミクス業界の発展を挙げています。また、パーソナライズされた栄養サービスへの動向の高まり、ニュートリゲノミクス技術のトレーニングや認知度向上への需要の高まりは、市場の大きな需要につながります。
目次
第1章 エグゼクティブサマリー
- 市場概要
第2章 市場情勢
- 市場エコシステム
第3章 市場規模の評価
- 市場の定義
- 市場セグメント分析
- 市場規模 2023
- 市場の見通し 2023-2028
第4章 市場規模実績
- ニュートリゲノミクスの世界市場 2018-2022
- 用途別セグメント分析 2018-2022
- 製品セグメント分析 2018-2022
- 地域別セグメント分析 2018-2022
- 国別セグメント分析 2018-2022
第5章 ファイブフォース分析
- ファイブフォースの要約
- 買い手の交渉力
- 供給企業の交渉力
- 新規参入業者の脅威
- 代替品の脅威
- 競争の脅威
- 市況
第6章 市場セグメンテーション:用途別
- 市場セグメント
- 比較:用途別
- 肥満:市場規模と予測 2023-2028
- 心血管疾患:市場規模と予測 2023-2028
- がん調査:市場規模と予測 2023-2028
- 市場機会:用途別
第7章 市場セグメンテーション:製品別
- 市場セグメント
- 比較:製品別
- 試薬とキット:市場規模と予測 2023-2028
- サービス:市場規模と予測 2023-2028
- 市場機会:製品別
第8章 顧客情勢
- 顧客情勢の概要
第9章 地域別情勢
- 地域別セグメンテーション
- 地域別比較
- 北米:市場規模と予測 2023-2028
- 欧州:市場規模と予測 2023-2028
- アジア:市場規模と予測 2023-2028
- 世界のその他の地域:市場規模と予測 2023-2028
- 米国:市場規模と予測 2023-2028
- ドイツ:市場規模と予測 2023-2028
- 英国:市場規模と予測 2023-2028
- フランス:市場規模と予測 2023-2028
- カナダ:市場規模と予測 2023-2028
- 市場機会:地域情勢別
第10章 促進要因、課題、および動向
- 市場促進要因
- 市場の課題
- 促進要因と課題の影響
- 市場動向
第11章 ベンダー情勢
- 概要
- ベンダー情勢
- 混乱の状況
- 業界のリスク
第12章 ベンダー分析
- 対象ベンダー
- ベンダーの市場ポジショニング
- BASF SE
- Cell Logic Pty Ltd
- Cura Integrative Medicine
- DNA Life
- Genetic Healing
- Genova Diagnostics Inc.
- Greenarray Genomic Research and Solutions Private Limited
- GX Sciences LLC
- Holistic Health International LLC
- Koninklijke DSM NV
- Mapmygenome India
- Metagenics LLC
- NutriFit Canada
- Nutrigenomix Inc.
- Xcode Life Sciences Pvt. Ltd
第13章 付録
Exhibits:
- Exhibits1: Executive Summary - Chart on Market Overview
- Exhibits2: Executive Summary - Data Table on Market Overview
- Exhibits3: Executive Summary - Chart on Global Market Characteristics
- Exhibits4: Executive Summary - Chart on Market By Geographical Landscape
- Exhibits5: Executive Summary - Chart on Market Segmentation by Application
- Exhibits6: Executive Summary - Chart on Market Segmentation by Product
- Exhibits7: Executive Summary - Chart on Incremental Growth
- Exhibits8: Executive Summary - Data Table on Incremental Growth
- Exhibits9: Executive Summary - Chart on Vendor Market Positioning
- Exhibits10: Parent market
- Exhibits11: Market Characteristics
- Exhibits12: Offerings of vendors included in the market definition
- Exhibits13: Market segments
- Exhibits14: Chart on Global - Market size and forecast 2023-2028 ($ million)
- Exhibits15: Data Table on Global - Market size and forecast 2023-2028 ($ million)
- Exhibits16: Chart on Global Market: Year-over-year growth 2023-2028 (%)
- Exhibits17: Data Table on Global Market: Year-over-year growth 2023-2028 (%)
- Exhibits18: Historic Market Size - Data Table on global nutrigenomics market 2018 - 2022 ($ million)
- Exhibits19: Historic Market Size - Application Segment 2018 - 2022 ($ million)
- Exhibits20: Historic Market Size - Product Segment 2018 - 2022 ($ million)
- Exhibits21: Historic Market Size - Geography Segment 2018 - 2022 ($ million)
- Exhibits22: Historic Market Size - Country Segment 2018 - 2022 ($ million)
- Exhibits23: Five forces analysis - Comparison between 2023 and 2028
- Exhibits24: Chart on Bargaining power of buyers - Impact of key factors 2023 and 2028
- Exhibits25: Bargaining power of suppliers - Impact of key factors in 2023 and 2028
- Exhibits26: Threat of new entrants - Impact of key factors in 2023 and 2028
- Exhibits27: Threat of substitutes - Impact of key factors in 2023 and 2028
- Exhibits28: Threat of rivalry - Impact of key factors in 2023 and 2028
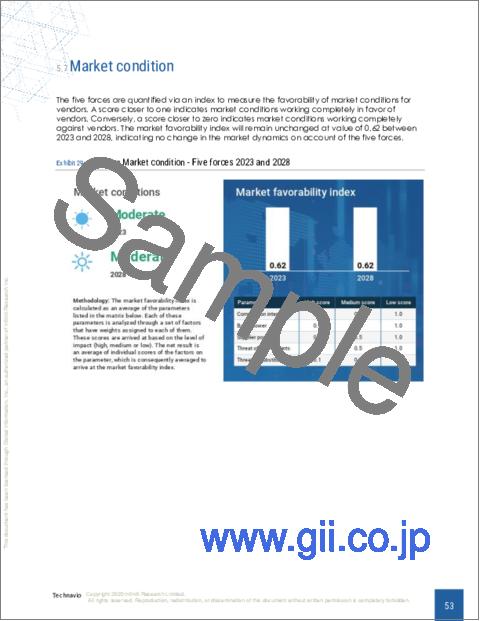
- Exhibits29: Chart on Market condition - Five forces 2023 and 2028
- Exhibits30: Chart on Application - Market share 2023-2028 (%)
- Exhibits31: Data Table on Application - Market share 2023-2028 (%)
- Exhibits32: Chart on Comparison by Application
- Exhibits33: Data Table on Comparison by Application
- Exhibits34: Chart on Obesity - Market size and forecast 2023-2028 ($ million)
- Exhibits35: Data Table on Obesity - Market size and forecast 2023-2028 ($ million)
- Exhibits36: Chart on Obesity - Year-over-year growth 2023-2028 (%)
- Exhibits37: Data Table on Obesity - Year-over-year growth 2023-2028 (%)
- Exhibits38: Chart on Cardiovascular diseases - Market size and forecast 2023-2028 ($ million)
- Exhibits39: Data Table on Cardiovascular diseases - Market size and forecast 2023-2028 ($ million)
- Exhibits40: Chart on Cardiovascular diseases - Year-over-year growth 2023-2028 (%)
- Exhibits41: Data Table on Cardiovascular diseases - Year-over-year growth 2023-2028 (%)
- Exhibits42: Chart on Cancer research - Market size and forecast 2023-2028 ($ million)
- Exhibits43: Data Table on Cancer research - Market size and forecast 2023-2028 ($ million)
- Exhibits44: Chart on Cancer research - Year-over-year growth 2023-2028 (%)
- Exhibits45: Data Table on Cancer research - Year-over-year growth 2023-2028 (%)
- Exhibits46: Market opportunity by Application ($ million)
- Exhibits47: Data Table on Market opportunity by Application ($ million)
- Exhibits48: Chart on Product - Market share 2023-2028 (%)
- Exhibits49: Data Table on Product - Market share 2023-2028 (%)
- Exhibits50: Chart on Comparison by Product
- Exhibits51: Data Table on Comparison by Product
- Exhibits52: Chart on Reagents and kits - Market size and forecast 2023-2028 ($ million)
- Exhibits53: Data Table on Reagents and kits - Market size and forecast 2023-2028 ($ million)
- Exhibits54: Chart on Reagents and kits - Year-over-year growth 2023-2028 (%)
- Exhibits55: Data Table on Reagents and kits - Year-over-year growth 2023-2028 (%)
- Exhibits56: Chart on Services - Market size and forecast 2023-2028 ($ million)
- Exhibits57: Data Table on Services - Market size and forecast 2023-2028 ($ million)
- Exhibits58: Chart on Services - Year-over-year growth 2023-2028 (%)
- Exhibits59: Data Table on Services - Year-over-year growth 2023-2028 (%)
- Exhibits60: Market opportunity by Product ($ million)
- Exhibits61: Data Table on Market opportunity by Product ($ million)
- Exhibits62: Analysis of price sensitivity, lifecycle, customer purchase basket, adoption rates, and purchase criteria
- Exhibits63: Chart on Market share By Geographical Landscape 2023-2028 (%)
- Exhibits64: Data Table on Market share By Geographical Landscape 2023-2028 (%)
- Exhibits65: Chart on Geographic comparison
- Exhibits66: Data Table on Geographic comparison
- Exhibits67: Chart on North America - Market size and forecast 2023-2028 ($ million)
- Exhibits68: Data Table on North America - Market size and forecast 2023-2028 ($ million)
- Exhibits69: Chart on North America - Year-over-year growth 2023-2028 (%)
- Exhibits70: Data Table on North America - Year-over-year growth 2023-2028 (%)
- Exhibits71: Chart on Europe - Market size and forecast 2023-2028 ($ million)
- Exhibits72: Data Table on Europe - Market size and forecast 2023-2028 ($ million)
- Exhibits73: Chart on Europe - Year-over-year growth 2023-2028 (%)
- Exhibits74: Data Table on Europe - Year-over-year growth 2023-2028 (%)
- Exhibits75: Chart on Asia - Market size and forecast 2023-2028 ($ million)
- Exhibits76: Data Table on Asia - Market size and forecast 2023-2028 ($ million)
- Exhibits77: Chart on Asia - Year-over-year growth 2023-2028 (%)
- Exhibits78: Data Table on Asia - Year-over-year growth 2023-2028 (%)
- Exhibits79: Chart on Rest of World (ROW) - Market size and forecast 2023-2028 ($ million)
- Exhibits80: Data Table on Rest of World (ROW) - Market size and forecast 2023-2028 ($ million)
- Exhibits81: Chart on Rest of World (ROW) - Year-over-year growth 2023-2028 (%)
- Exhibits82: Data Table on Rest of World (ROW) - Year-over-year growth 2023-2028 (%)
- Exhibits83: Chart on US - Market size and forecast 2023-2028 ($ million)
- Exhibits84: Data Table on US - Market size and forecast 2023-2028 ($ million)
- Exhibits85: Chart on US - Year-over-year growth 2023-2028 (%)
- Exhibits86: Data Table on US - Year-over-year growth 2023-2028 (%)
- Exhibits87: Chart on Germany - Market size and forecast 2023-2028 ($ million)
- Exhibits88: Data Table on Germany - Market size and forecast 2023-2028 ($ million)
- Exhibits89: Chart on Germany - Year-over-year growth 2023-2028 (%)
- Exhibits90: Data Table on Germany - Year-over-year growth 2023-2028 (%)
- Exhibits91: Chart on UK - Market size and forecast 2023-2028 ($ million)
- Exhibits92: Data Table on UK - Market size and forecast 2023-2028 ($ million)
- Exhibits93: Chart on UK - Year-over-year growth 2023-2028 (%)
- Exhibits94: Data Table on UK - Year-over-year growth 2023-2028 (%)
- Exhibits95: Chart on France - Market size and forecast 2023-2028 ($ million)
- Exhibits96: Data Table on France - Market size and forecast 2023-2028 ($ million)
- Exhibits97: Chart on France - Year-over-year growth 2023-2028 (%)
- Exhibits98: Data Table on France - Year-over-year growth 2023-2028 (%)
- Exhibits99: Chart on Canada - Market size and forecast 2023-2028 ($ million)
- Exhibits100: Data Table on Canada - Market size and forecast 2023-2028 ($ million)
- Exhibits101: Chart on Canada - Year-over-year growth 2023-2028 (%)
- Exhibits102: Data Table on Canada - Year-over-year growth 2023-2028 (%)
- Exhibits103: Market opportunity By Geographical Landscape ($ million)
- Exhibits104: Data Tables on Market opportunity By Geographical Landscape ($ million)
- Exhibits105: Impact of drivers and challenges in 2023 and 2028
- Exhibits106: Overview on Criticality of inputs and Factors of differentiation
- Exhibits107: Overview on factors of disruption
- Exhibits108: Impact of key risks on business
- Exhibits109: Vendors covered
- Exhibits110: Matrix on vendor position and classification
- Exhibits111: BASF SE - Overview
- Exhibits112: BASF SE - Business segments
- Exhibits113: BASF SE - Key news
- Exhibits114: BASF SE - Key offerings
- Exhibits115: BASF SE - Segment focus
- Exhibits116: Cell Logic Pty Ltd - Overview
- Exhibits117: Cell Logic Pty Ltd - Product / Service
- Exhibits118: Cell Logic Pty Ltd - Key offerings
- Exhibits119: Cura Integrative Medicine - Overview
- Exhibits120: Cura Integrative Medicine - Product / Service
- Exhibits121: Cura Integrative Medicine - Key offerings
- Exhibits122: DNA Life - Overview
- Exhibits123: DNA Life - Product / Service
- Exhibits124: DNA Life - Key offerings
- Exhibits125: Genetic Healing - Overview
- Exhibits126: Genetic Healing - Product / Service
- Exhibits127: Genetic Healing - Key offerings
- Exhibits128: Genova Diagnostics Inc. - Overview
- Exhibits129: Genova Diagnostics Inc. - Product / Service
- Exhibits130: Genova Diagnostics Inc. - Key offerings
- Exhibits131: Greenarray Genomic Research and Solutions Private Limited - Overview
- Exhibits132: Greenarray Genomic Research and Solutions Private Limited - Product / Service
- Exhibits133: Greenarray Genomic Research and Solutions Private Limited - Key offerings
- Exhibits134: GX Sciences LLC - Overview
- Exhibits135: GX Sciences LLC - Product / Service
- Exhibits136: GX Sciences LLC - Key news
- Exhibits137: GX Sciences LLC - Key offerings
- Exhibits138: Holistic Health International LLC - Overview
- Exhibits139: Holistic Health International LLC - Product / Service
- Exhibits140: Holistic Health International LLC - Key offerings
- Exhibits141: Koninklijke DSM NV - Overview
- Exhibits142: Koninklijke DSM NV - Business segments
- Exhibits143: Koninklijke DSM NV - Key news
- Exhibits144: Koninklijke DSM NV - Key offerings
- Exhibits145: Koninklijke DSM NV - Segment focus
- Exhibits146: Mapmygenome India - Overview
- Exhibits147: Mapmygenome India - Product / Service
- Exhibits148: Mapmygenome India - Key offerings
- Exhibits149: Metagenics LLC - Overview
- Exhibits150: Metagenics LLC - Product / Service
- Exhibits151: Metagenics LLC - Key offerings
- Exhibits152: NutriFit Canada - Overview
- Exhibits153: NutriFit Canada - Product / Service
- Exhibits154: NutriFit Canada - Key offerings
- Exhibits155: Nutrigenomix Inc. - Overview
- Exhibits156: Nutrigenomix Inc. - Product / Service
- Exhibits157: Nutrigenomix Inc. - Key offerings
- Exhibits158: Xcode Life Sciences Pvt. Ltd - Overview
- Exhibits159: Xcode Life Sciences Pvt. Ltd - Product / Service
- Exhibits160: Xcode Life Sciences Pvt. Ltd - Key offerings
- Exhibits161: Inclusions checklist
- Exhibits162: Exclusions checklist
- Exhibits163: Currency conversion rates for US$
- Exhibits164: Research methodology
- Exhibits165: Validation techniques employed for market sizing
- Exhibits166: Information sources
- Exhibits167: List of abbreviations
The nutrigenomics market is forecasted to grow by USD 997.73 mn during 2023-2028, accelerating at a CAGR of 13.87% during the forecast period. The report on the nutrigenomics market provides a holistic analysis, market size and forecast, trends, growth drivers, and challenges, as well as vendor analysis covering around 25 vendors.
The report offers an up-to-date analysis regarding the current market scenario, the latest trends and drivers, and the overall market environment. The market is driven by the increasing cost of medical treatment, growing investments by government and private stakeholders in the field of nutrigenomics, and the increasing prevalence of obesity.
Technavio's nutrigenomics market is segmented as below:
| Market Scope | |
|---|---|
| Base Year | 2024 |
| End Year | 2028 |
| Series Year | 2024-2028 |
| Growth Momentum | Accelerate |
| YOY 2024 | 12.85% |
| CAGR | 13.87% |
| Incremental Value | $997.73mn |
By Application
- Obesity
- Cardiovascular diseases
- Cancer research
By Product
- Reagents and kits
- Services
By Geographical Landscape
- North America
- Europe
- Asia
- Rest of World (ROW)
This study identifies the growing developments in the nutrigenomics industry as one of the prime reasons driving the nutrigenomics market growth during the next few years. Also, a growing trend toward personalized nutrition services and rising demand for training in and awareness of nutrigenomics technologies will lead to sizable demand in the market.
The report on the nutrigenomics market covers the following areas:
- Nutrigenomics market sizing
- Nutrigenomics market forecast
- Nutrigenomics market industry analysis
The robust vendor analysis is designed to help clients improve their market position, and in line with this, this report provides a detailed analysis of several leading nutrigenomics market vendors including BASF SE, Cell Logic Pty Ltd, Cura Integrative Medicine, DNA Life, DNANUTRICOACH, geneOmbio Technologies Pvt. Ltd., Genetic Healing, Genova Diagnostics Inc., Greenarray Genomic Research and Solutions Private Limited, GX Sciences LLC, Holistic Health International LLC, Koninklijke DSM NV, Mapmygenome India, Metagenics LLC, My DNA Health Ltd., NutriFit Canada, Nutrigenomix Inc., Seaport Diagnostics Inc., Vieroots Wellness Solutions Pvt Ltd, and Xcode Life Sciences Pvt. Ltd. Also, the nutrigenomics market analysis report includes information on upcoming trends and challenges that will influence market growth. This is to help companies strategize and leverage all forthcoming growth opportunities.
The study was conducted using an objective combination of primary and secondary information including inputs from key participants in the industry. The report contains a comprehensive market and vendor landscape in addition to an analysis of the key vendors.
The publisher presents a detailed picture of the market by way of study, synthesis, and summation of data from multiple sources through an analysis of key parameters such as profit, pricing, competition, and promotions. It presents various market facets by identifying the key industry influencers. The data presented is comprehensive, reliable, and a result of extensive research - both primary and secondary. The market research reports provide a complete competitive landscape and an in-depth vendor selection methodology and analysis using qualitative and quantitative research to forecast accurate market growth.
Table of Contents
1 Executive Summary
- 1.1 Market overview
2 Market Landscape
- 2.1 Market ecosystem
3 Market Sizing
- 3.1 Market definition
- 3.2 Market segment analysis
- 3.3 Market size 2023
- 3.4 Market outlook: Forecast for 2023-2028
4 Historic Market Size
- 4.1 Global nutrigenomics market 2018 - 2022
- 4.2 Application Segment Analysis 2018 - 2022
- 4.3 Product Segment Analysis 2018 - 2022
- 4.4 Geography Segment Analysis 2018 - 2022
- 4.5 Country Segment Analysis 2018 - 2022
5 Five Forces Analysis
- 5.1 Five forces summary
- 5.2 Bargaining power of buyers
- 5.3 Bargaining power of suppliers
- 5.4 Threat of new entrants
- 5.5 Threat of substitutes
- 5.6 Threat of rivalry
- 5.7 Market condition
6 Market Segmentation by Application
- 6.1 Market segments
- 6.2 Comparison by Application
- 6.3 Obesity - Market size and forecast 2023-2028
- 6.4 Cardiovascular diseases - Market size and forecast 2023-2028
- 6.5 Cancer research - Market size and forecast 2023-2028
- 6.6 Market opportunity by Application
7 Market Segmentation by Product
- 7.1 Market segments
- 7.2 Comparison by Product
- 7.3 Reagents and kits - Market size and forecast 2023-2028
- 7.4 Services - Market size and forecast 2023-2028
- 7.5 Market opportunity by Product
8 Customer Landscape
- 8.1 Customer landscape overview
9 Geographic Landscape
- 9.1 Geographic segmentation
- 9.2 Geographic comparison
- 9.3 North America - Market size and forecast 2023-2028
- 9.4 Europe - Market size and forecast 2023-2028
- 9.5 Asia - Market size and forecast 2023-2028
- 9.6 Rest of World (ROW) - Market size and forecast 2023-2028
- 9.7 US - Market size and forecast 2023-2028
- 9.8 Germany - Market size and forecast 2023-2028
- 9.9 UK - Market size and forecast 2023-2028
- 9.10 France - Market size and forecast 2023-2028
- 9.11 Canada - Market size and forecast 2023-2028
- 9.12 Market opportunity By Geographical Landscape
10 Drivers, Challenges, and Trends
- 10.1 Market drivers
- 10.2 Market challenges
- 10.3 Impact of drivers and challenges
- 10.4 Market trends
11 Vendor Landscape
- 11.1 Overview
- 11.2 Vendor landscape
- 11.3 Landscape disruption
- 11.4 Industry risks
12 Vendor Analysis
- 12.1 Vendors covered
- 12.2 Market positioning of vendors
- 12.3 BASF SE
- 12.4 Cell Logic Pty Ltd
- 12.5 Cura Integrative Medicine
- 12.6 DNA Life
- 12.7 Genetic Healing
- 12.8 Genova Diagnostics Inc.
- 12.9 Greenarray Genomic Research and Solutions Private Limited
- 12.10 GX Sciences LLC
- 12.11 Holistic Health International LLC
- 12.12 Koninklijke DSM NV
- 12.13 Mapmygenome India
- 12.14 Metagenics LLC
- 12.15 NutriFit Canada
- 12.16 Nutrigenomix Inc.
- 12.17 Xcode Life Sciences Pvt. Ltd
13 Appendix
- 13.1 Scope of the report
- 13.2 Inclusions and exclusions checklist
- 13.3 Currency conversion rates for US$
- 13.4 Research methodology
- 13.5 List of abbreviations

