|
|
市場調査レポート
商品コード
1732626
エアロポニックスの世界市場 2025-2029Global Aeroponics Market 2025-2029 |
||||||
|
|||||||
カスタマイズ可能
|
|||||||


| エアロポニックスの世界市場 2025-2029 |
|
出版日: 2025年05月16日
発行: TechNavio
ページ情報: 英文 217 Pages
納期: 即納可能
|

全表示
- 概要
- 図表
- 目次
エアロポニックス市場は2024-2029年に53億5,130万米ドル、予測期間中のCAGRは26.5%で成長すると予測されます。
当レポートでは、エアロポニックス市場の全体的な分析、市場規模・予測、動向、成長促進要因、課題、約25のベンダーを網羅したベンダー分析などを掲載しています。
現在の市場シナリオ、最新動向と促進要因、市場環境全体に関する最新分析を提供しています。市場は、農業用耕地が限られていること、農業にかかる人件費削減への注目が高まっていること、土壌汚染や水質汚染の削減が求められていることなどが要因となっています。
| 市場範囲 | |
|---|---|
| 基準年 | 2025 |
| 終了年 | 2029 |
| 予測期間 | 2025-2029 |
| 成長モメンタム | 加速 |
| 前年比 | 25.8% |
| CAGR | 26.5% |
| 増分額 | 53億5,130万米ドル |
本調査は、業界の主要参加者からのインプットを含め、一次情報と二次情報を客観的に組み合わせて実施しました。レポートには、主要企業の分析に加え、包括的な市場規模データ、地域別分析によるセグメント、ベンダー情勢が含まれています。レポートには過去データと予測データがあります。
本調査では、今後数年間のエアロポニックス市場の成長を促進する主な理由の一つとして、特許取得済みのシステムを用いた垂直農法技術への傾斜の高まりを挙げています。また、食品需要の増加に対応する必要性の高まりや、農業業界における無病環境に対する人気の高まりも、市場の大きな需要につながります。
目次
第1章 エグゼクティブサマリー
- 市場概要
第2章 Technavio分析
- 価格・ライフサイクル・顧客購入バスケット・採用率・購入基準の分析
- インプットの重要性と差別化の要因
- 混乱の要因
- 促進要因と課題の影響
第3章 市場情勢
- 市場エコシステム
- 市場の特徴
- バリューチェーン分析
第4章 市場規模
- 市場の定義
- 市場セグメント分析
- 市場規模 2024
- 市場の見通し 2024-2029
第5章 市場規模実績
- エアロポニックスの世界市場 2019-2023
- 製品セグメント分析 2019-2023
- タイプセグメント分析 2019-2023
- 作物タイプセグメント分析 2019-2023
- 地域別セグメント分析 2019-2023
- 国別セグメント分析 2019-2023
第6章 定性分析
- AIの影響:エアロポニックスの世界市場
第7章 ファイブフォース分析
- ファイブフォースの要約
- 買い手の交渉力
- 供給企業の交渉力
- 新規参入業者の脅威
- 代替品の脅威
- 競争の脅威
- 市況
第8章 市場セグメンテーション:製品別
- 市場セグメント
- 比較:製品別
- 低気圧エアロポニックス:市場規模と予測 2024-2029
- 高圧エアロポニックス:市場規模と予測 2024-2029
- 超音波噴霧器エアロポニックス:市場規模と予測 2024-2029
- 市場機会:製品別
第9章 市場セグメンテーション:タイプ別
- 市場セグメント
- 比較:タイプ別
- 屋内農業:市場規模と予測 2024-2029
- 屋外農業:市場規模と予測 2024-2029
- 市場機会:タイプ別
第10章 市場セグメンテーション:作物タイプ別
- 市場セグメント
- 比較:作物タイプ別
- 野菜:市場規模と予測 2024-2029
- 果物:市場規模と予測 2024-2029
- ハーブ:市場規模と予測 2024-2029
- 花:市場規模と予測 2024-2029
- その他:市場規模と予測 2024-2029
- 市場機会:作物タイプ別
第11章 顧客情勢
- 顧客情勢の概要
第12章 地域別情勢
- 地域別セグメンテーション
- 地域別比較
- 欧州:市場規模と予測 2024-2029
- アジア太平洋:市場規模と予測 2024-2029
- 北米:市場規模と予測 2024-2029
- 南米:市場規模と予測 2024-2029
- 中東・アフリカ:市場規模と予測 2024-2029
- 米国:市場規模と予測 2024-2029
- オランダ:市場規模と予測 2024-2029
- 日本:市場規模と予測 2024-2029
- 中国:市場規模と予測 2024-2029
- カナダ:市場規模と予測 2024-2029
- インド:市場規模と予測 2024-2029
- 英国:市場規模と予測 2024-2029
- ドイツ:市場規模と予測 2024-2029
- フランス:市場規模と予測 2024-2029
- 韓国:市場規模と予測 2024-2029
- 市場機会:地域情勢別
第13章 促進要因・課題・機会・抑制要因
- 市場促進要因
- 市場の課題
- 促進要因と課題の影響
- 市場の機会・抑制要因
第14章 競合情勢
- 概要
- 競合情勢
- 混乱の状況
- 業界のリスク
第15章 競合分析
- 企業プロファイル
- 企業ランキング指数
- 企業の市場ポジショニング
- AeroFarms LLC
- Aessense Corp.
- AgriHouse Brands Ltd.
- Barton Breeze Pvt. Ltd.
- Bifarm Tech Inc.
- CleanGreens Solutions SA
- Eden Grow Systems
- Evergreen Farm Oy
- Freight Farms Inc.
- Good Life Growing
- Hexagro Urban Farming Srl
- LettUs Grow Ltd.
- Living Greens Farm Inc.
- Neofarms GmbH
- The Scotts Miracle Gro Co.
第16章 付録
Exhibits:
- Exhibits1: Executive Summary - Chart on Market Overview
- Exhibits2: Executive Summary - Data Table on Market Overview
- Exhibits3: Executive Summary - Chart on Global Market Characteristics
- Exhibits4: Executive Summary - Chart on Market By Geographical Landscape
- Exhibits5: Executive Summary - Chart on Market Segmentation by Product
- Exhibits6: Executive Summary - Chart on Market Segmentation by Type
- Exhibits7: Executive Summary - Chart on Market Segmentation by Crop Type
- Exhibits8: Executive Summary - Chart on Incremental Growth
- Exhibits9: Executive Summary - Data Table on Incremental Growth
- Exhibits10: Executive Summary - Chart on Company Market Positioning
- Exhibits11: Analysis of price sensitivity, lifecycle, customer purchase basket, adoption rates, and purchase criteria
- Exhibits12: Overview on criticality of inputs and factors of differentiation
- Exhibits13: Overview on factors of disruption
- Exhibits14: Impact of drivers and challenges in 2024 and 2029
- Exhibits15: Parent Market
- Exhibits16: Data Table on - Parent Market
- Exhibits17: Market characteristics analysis
- Exhibits18: Value chain analysis
- Exhibits19: Offerings of companies included in the market definition
- Exhibits20: Market segments
- Exhibits21: Chart on Global - Market size and forecast 2024-2029 ($ million)
- Exhibits22: Data Table on Global - Market size and forecast 2024-2029 ($ million)
- Exhibits23: Chart on Global Market: Year-over-year growth 2024-2029 (%)
- Exhibits24: Data Table on Global Market: Year-over-year growth 2024-2029 (%)
- Exhibits25: Historic Market Size - Data Table on Global Aeroponics Market 2019 - 2023 ($ million)
- Exhibits26: Historic Market Size - Product Segment 2019 - 2023 ($ million)
- Exhibits27: Historic Market Size - Type Segment 2019 - 2023 ($ million)
- Exhibits28: Historic Market Size - Crop Type Segment 2019 - 2023 ($ million)
- Exhibits29: Historic Market Size - Geography Segment 2019 - 2023 ($ million)
- Exhibits30: Historic Market Size - Country Segment 2019 - 2023 ($ million)
- Exhibits31: Five forces analysis - Comparison between 2024 and 2029
- Exhibits32: Bargaining power of buyers - Impact of key factors 2024 and 2029
- Exhibits33: Bargaining power of suppliers - Impact of key factors in 2024 and 2029
- Exhibits34: Threat of new entrants - Impact of key factors in 2024 and 2029
- Exhibits35: Threat of substitutes - Impact of key factors in 2024 and 2029
- Exhibits36: Threat of rivalry - Impact of key factors in 2024 and 2029
- Exhibits37: Chart on Market condition - Five forces 2024 and 2029
- Exhibits38: Chart on Product - Market share 2024-2029 (%)
- Exhibits39: Data Table on Product - Market share 2024-2029 (%)
- Exhibits40: Chart on Comparison by Product
- Exhibits41: Data Table on Comparison by Product
- Exhibits42: Chart on Low pressure aeroponics - Market size and forecast 2024-2029 ($ million)
- Exhibits43: Data Table on Low pressure aeroponics - Market size and forecast 2024-2029 ($ million)
- Exhibits44: Chart on Low pressure aeroponics - Year-over-year growth 2024-2029 (%)
- Exhibits45: Data Table on Low pressure aeroponics - Year-over-year growth 2024-2029 (%)
- Exhibits46: Chart on High pressure aeroponics - Market size and forecast 2024-2029 ($ million)
- Exhibits47: Data Table on High pressure aeroponics - Market size and forecast 2024-2029 ($ million)
- Exhibits48: Chart on High pressure aeroponics - Year-over-year growth 2024-2029 (%)
- Exhibits49: Data Table on High pressure aeroponics - Year-over-year growth 2024-2029 (%)
- Exhibits50: Chart on Ultrasonic fogger aeroponics - Market size and forecast 2024-2029 ($ million)
- Exhibits51: Data Table on Ultrasonic fogger aeroponics - Market size and forecast 2024-2029 ($ million)
- Exhibits52: Chart on Ultrasonic fogger aeroponics - Year-over-year growth 2024-2029 (%)
- Exhibits53: Data Table on Ultrasonic fogger aeroponics - Year-over-year growth 2024-2029 (%)
- Exhibits54: Market opportunity by Product ($ million)
- Exhibits55: Data Table on Market opportunity by Product ($ million)
- Exhibits56: Chart on Type - Market share 2024-2029 (%)
- Exhibits57: Data Table on Type - Market share 2024-2029 (%)
- Exhibits58: Chart on Comparison by Type
- Exhibits59: Data Table on Comparison by Type
- Exhibits60: Chart on Indoor farming - Market size and forecast 2024-2029 ($ million)
- Exhibits61: Data Table on Indoor farming - Market size and forecast 2024-2029 ($ million)
- Exhibits62: Chart on Indoor farming - Year-over-year growth 2024-2029 (%)
- Exhibits63: Data Table on Indoor farming - Year-over-year growth 2024-2029 (%)
- Exhibits64: Chart on Outdoor farming - Market size and forecast 2024-2029 ($ million)
- Exhibits65: Data Table on Outdoor farming - Market size and forecast 2024-2029 ($ million)
- Exhibits66: Chart on Outdoor farming - Year-over-year growth 2024-2029 (%)
- Exhibits67: Data Table on Outdoor farming - Year-over-year growth 2024-2029 (%)
- Exhibits68: Market opportunity by Type ($ million)
- Exhibits69: Data Table on Market opportunity by Type ($ million)
- Exhibits70: Chart on Crop Type - Market share 2024-2029 (%)
- Exhibits71: Data Table on Crop Type - Market share 2024-2029 (%)
- Exhibits72: Chart on Comparison by Crop Type
- Exhibits73: Data Table on Comparison by Crop Type
- Exhibits74: Chart on Vegetables - Market size and forecast 2024-2029 ($ million)
- Exhibits75: Data Table on Vegetables - Market size and forecast 2024-2029 ($ million)
- Exhibits76: Chart on Vegetables - Year-over-year growth 2024-2029 (%)
- Exhibits77: Data Table on Vegetables - Year-over-year growth 2024-2029 (%)
- Exhibits78: Chart on Fruits - Market size and forecast 2024-2029 ($ million)
- Exhibits79: Data Table on Fruits - Market size and forecast 2024-2029 ($ million)
- Exhibits80: Chart on Fruits - Year-over-year growth 2024-2029 (%)
- Exhibits81: Data Table on Fruits - Year-over-year growth 2024-2029 (%)
- Exhibits82: Chart on Herbs - Market size and forecast 2024-2029 ($ million)
- Exhibits83: Data Table on Herbs - Market size and forecast 2024-2029 ($ million)
- Exhibits84: Chart on Herbs - Year-over-year growth 2024-2029 (%)
- Exhibits85: Data Table on Herbs - Year-over-year growth 2024-2029 (%)
- Exhibits86: Chart on Flowers - Market size and forecast 2024-2029 ($ million)
- Exhibits87: Data Table on Flowers - Market size and forecast 2024-2029 ($ million)
- Exhibits88: Chart on Flowers - Year-over-year growth 2024-2029 (%)
- Exhibits89: Data Table on Flowers - Year-over-year growth 2024-2029 (%)
- Exhibits90: Chart on Others - Market size and forecast 2024-2029 ($ million)
- Exhibits91: Data Table on Others - Market size and forecast 2024-2029 ($ million)
- Exhibits92: Chart on Others - Year-over-year growth 2024-2029 (%)
- Exhibits93: Data Table on Others - Year-over-year growth 2024-2029 (%)
- Exhibits94: Market opportunity by Crop Type ($ million)
- Exhibits95: Data Table on Market opportunity by Crop Type ($ million)
- Exhibits96: Analysis of price sensitivity, lifecycle, customer purchase basket, adoption rates, and purchase criteria
- Exhibits97: Chart on Market share By Geographical Landscape 2024-2029 (%)
- Exhibits98: Data Table on Market share By Geographical Landscape 2024-2029 (%)
- Exhibits99: Chart on Geographic comparison
- Exhibits100: Data Table on Geographic comparison
- Exhibits101: Chart on Europe - Market size and forecast 2024-2029 ($ million)
- Exhibits102: Data Table on Europe - Market size and forecast 2024-2029 ($ million)
- Exhibits103: Chart on Europe - Year-over-year growth 2024-2029 (%)
- Exhibits104: Data Table on Europe - Year-over-year growth 2024-2029 (%)
- Exhibits105: Chart on APAC - Market size and forecast 2024-2029 ($ million)
- Exhibits106: Data Table on APAC - Market size and forecast 2024-2029 ($ million)
- Exhibits107: Chart on APAC - Year-over-year growth 2024-2029 (%)
- Exhibits108: Data Table on APAC - Year-over-year growth 2024-2029 (%)
- Exhibits109: Chart on North America - Market size and forecast 2024-2029 ($ million)
- Exhibits110: Data Table on North America - Market size and forecast 2024-2029 ($ million)
- Exhibits111: Chart on North America - Year-over-year growth 2024-2029 (%)
- Exhibits112: Data Table on North America - Year-over-year growth 2024-2029 (%)
- Exhibits113: Chart on South America - Market size and forecast 2024-2029 ($ million)
- Exhibits114: Data Table on South America - Market size and forecast 2024-2029 ($ million)
- Exhibits115: Chart on South America - Year-over-year growth 2024-2029 (%)
- Exhibits116: Data Table on South America - Year-over-year growth 2024-2029 (%)
- Exhibits117: Chart on Middle East and Africa - Market size and forecast 2024-2029 ($ million)
- Exhibits118: Data Table on Middle East and Africa - Market size and forecast 2024-2029 ($ million)
- Exhibits119: Chart on Middle East and Africa - Year-over-year growth 2024-2029 (%)
- Exhibits120: Data Table on Middle East and Africa - Year-over-year growth 2024-2029 (%)
- Exhibits121: Chart on US - Market size and forecast 2024-2029 ($ million)
- Exhibits122: Data Table on US - Market size and forecast 2024-2029 ($ million)
- Exhibits123: Chart on US - Year-over-year growth 2024-2029 (%)
- Exhibits124: Data Table on US - Year-over-year growth 2024-2029 (%)
- Exhibits125: Chart on The Netherlands - Market size and forecast 2024-2029 ($ million)
- Exhibits126: Data Table on The Netherlands - Market size and forecast 2024-2029 ($ million)
- Exhibits127: Chart on The Netherlands - Year-over-year growth 2024-2029 (%)
- Exhibits128: Data Table on The Netherlands - Year-over-year growth 2024-2029 (%)
- Exhibits129: Chart on Japan - Market size and forecast 2024-2029 ($ million)
- Exhibits130: Data Table on Japan - Market size and forecast 2024-2029 ($ million)
- Exhibits131: Chart on Japan - Year-over-year growth 2024-2029 (%)
- Exhibits132: Data Table on Japan - Year-over-year growth 2024-2029 (%)
- Exhibits133: Chart on China - Market size and forecast 2024-2029 ($ million)
- Exhibits134: Data Table on China - Market size and forecast 2024-2029 ($ million)
- Exhibits135: Chart on China - Year-over-year growth 2024-2029 (%)
- Exhibits136: Data Table on China - Year-over-year growth 2024-2029 (%)
- Exhibits137: Chart on Canada - Market size and forecast 2024-2029 ($ million)
- Exhibits138: Data Table on Canada - Market size and forecast 2024-2029 ($ million)
- Exhibits139: Chart on Canada - Year-over-year growth 2024-2029 (%)
- Exhibits140: Data Table on Canada - Year-over-year growth 2024-2029 (%)
- Exhibits141: Chart on India - Market size and forecast 2024-2029 ($ million)
- Exhibits142: Data Table on India - Market size and forecast 2024-2029 ($ million)
- Exhibits143: Chart on India - Year-over-year growth 2024-2029 (%)
- Exhibits144: Data Table on India - Year-over-year growth 2024-2029 (%)
- Exhibits145: Chart on UK - Market size and forecast 2024-2029 ($ million)
- Exhibits146: Data Table on UK - Market size and forecast 2024-2029 ($ million)
- Exhibits147: Chart on UK - Year-over-year growth 2024-2029 (%)
- Exhibits148: Data Table on UK - Year-over-year growth 2024-2029 (%)
- Exhibits149: Chart on Germany - Market size and forecast 2024-2029 ($ million)
- Exhibits150: Data Table on Germany - Market size and forecast 2024-2029 ($ million)
- Exhibits151: Chart on Germany - Year-over-year growth 2024-2029 (%)
- Exhibits152: Data Table on Germany - Year-over-year growth 2024-2029 (%)
- Exhibits153: Chart on France - Market size and forecast 2024-2029 ($ million)
- Exhibits154: Data Table on France - Market size and forecast 2024-2029 ($ million)
- Exhibits155: Chart on France - Year-over-year growth 2024-2029 (%)
- Exhibits156: Data Table on France - Year-over-year growth 2024-2029 (%)
- Exhibits157: Chart on South Korea - Market size and forecast 2024-2029 ($ million)
- Exhibits158: Data Table on South Korea - Market size and forecast 2024-2029 ($ million)
- Exhibits159: Chart on South Korea - Year-over-year growth 2024-2029 (%)
- Exhibits160: Data Table on South Korea - Year-over-year growth 2024-2029 (%)
- Exhibits161: Market opportunity By Geographical Landscape ($ million)
- Exhibits162: Data Tables on Market opportunity By Geographical Landscape ($ million)
- Exhibits163: Impact of drivers and challenges in 2024 and 2029
- Exhibits164: Overview on criticality of inputs and factors of differentiation
- Exhibits165: Overview on factors of disruption
- Exhibits166: Impact of key risks on business
- Exhibits167: Companies covered
- Exhibits168: Company ranking index
- Exhibits169: Matrix on companies position and classification
- Exhibits170: AeroFarms LLC - Overview
- Exhibits171: AeroFarms LLC - Product / Service
- Exhibits172: AeroFarms LLC - Key offerings
- Exhibits173: SWOT
- Exhibits174: Aessense Corp. - Overview
- Exhibits175: Aessense Corp. - Product / Service
- Exhibits176: Aessense Corp. - Key offerings
- Exhibits177: SWOT
- Exhibits178: AgriHouse Brands Ltd. - Overview
- Exhibits179: AgriHouse Brands Ltd. - Product / Service
- Exhibits180: AgriHouse Brands Ltd. - Key offerings
- Exhibits181: SWOT
- Exhibits182: Barton Breeze Pvt. Ltd. - Overview
- Exhibits183: Barton Breeze Pvt. Ltd. - Product / Service
- Exhibits184: Barton Breeze Pvt. Ltd. - Key offerings
- Exhibits185: SWOT
- Exhibits186: Bifarm Tech Inc. - Overview
- Exhibits187: Bifarm Tech Inc. - Product / Service
- Exhibits188: Bifarm Tech Inc. - Key offerings
- Exhibits189: SWOT
- Exhibits190: CleanGreens Solutions SA - Overview
- Exhibits191: CleanGreens Solutions SA - Product / Service
- Exhibits192: CleanGreens Solutions SA - Key offerings
- Exhibits193: SWOT
- Exhibits194: Eden Grow Systems - Overview
- Exhibits195: Eden Grow Systems - Product / Service
- Exhibits196: Eden Grow Systems - Key offerings
- Exhibits197: SWOT
- Exhibits198: Evergreen Farm Oy - Overview
- Exhibits199: Evergreen Farm Oy - Product / Service
- Exhibits200: Evergreen Farm Oy - Key offerings
- Exhibits201: SWOT
- Exhibits202: Freight Farms Inc. - Overview
- Exhibits203: Freight Farms Inc. - Product / Service
- Exhibits204: Freight Farms Inc. - Key offerings
- Exhibits205: SWOT
- Exhibits206: Good Life Growing - Overview
- Exhibits207: Good Life Growing - Product / Service
- Exhibits208: Good Life Growing - Key offerings
- Exhibits209: SWOT
- Exhibits210: Hexagro Urban Farming Srl - Overview
- Exhibits211: Hexagro Urban Farming Srl - Product / Service
- Exhibits212: Hexagro Urban Farming Srl - Key offerings
- Exhibits213: SWOT
- Exhibits214: LettUs Grow Ltd. - Overview
- Exhibits215: LettUs Grow Ltd. - Product / Service
- Exhibits216: LettUs Grow Ltd. - Key offerings
- Exhibits217: SWOT
- Exhibits218: Living Greens Farm Inc. - Overview
- Exhibits219: Living Greens Farm Inc. - Product / Service
- Exhibits220: Living Greens Farm Inc. - Key offerings
- Exhibits221: SWOT
- Exhibits222: Neofarms GmbH - Overview
- Exhibits223: Neofarms GmbH - Product / Service
- Exhibits224: Neofarms GmbH - Key offerings
- Exhibits225: SWOT
- Exhibits226: The Scotts Miracle Gro Co. - Overview
- Exhibits227: The Scotts Miracle Gro Co. - Business segments
- Exhibits228: The Scotts Miracle Gro Co. - Key offerings
- Exhibits229: The Scotts Miracle Gro Co. - Segment focus
- Exhibits230: SWOT
- Exhibits231: Inclusions checklist
- Exhibits232: Exclusions checklist
- Exhibits233: Currency conversion rates for US$
- Exhibits234: Research methodology
- Exhibits235: Information sources
- Exhibits236: Data validation
- Exhibits237: Validation techniques employed for market sizing
- Exhibits238: Data synthesis
- Exhibits239: 360 degree market analysis
- Exhibits240: List of abbreviations
The aeroponics market is forecasted to grow by USD 5,351.3 mn during 2024-2029, accelerating at a CAGR of 26.5% during the forecast period. The report on the aeroponics market provides a holistic analysis, market size and forecast, trends, growth drivers, and challenges, as well as vendor analysis covering around 25 vendors.
The report offers an up-to-date analysis regarding the current market scenario, the latest trends and drivers, and the overall market environment. The market is driven by limited arable land for agricultural usage, growing focus on reducing labor costs for farming, and need for reduction in soil and water pollution.
| Market Scope | |
|---|---|
| Base Year | 2025 |
| End Year | 2029 |
| Series Year | 2025-2029 |
| Growth Momentum | Accelerate |
| YOY 2025 | 25.8% |
| CAGR | 26.5% |
| Incremental Value | $5,351.3 mn |
The study was conducted using an objective combination of primary and secondary information including inputs from key participants in the industry. The report contains a comprehensive market size data, segment with regional analysis and vendor landscape in addition to an analysis of the key companies. Reports have historic and forecast data.
Technavio's aeroponics market is segmented as below:
By Product
- Low pressure aeroponics
- High pressure aeroponics
- Ultrasonic fogger aeroponics
By Type
- Indoor farming
- Outdoor farming
By Crop Type
- Vegetables
- Fruits
- Herbs
- Flowers
- Others
By Geographical Landscape
- Europe
- APAC
- North America
- South America
- Middle East and Africa
This study identifies the growing inclination toward vertical aeroponics farming technologies with patented systems as one of the prime reasons driving the aeroponics market growth during the next few years. Also, growing need to meet rising demand for food products and growing popularity of disease-free environment in agriculture industry will lead to sizable demand in the market.
The report on the aeroponics market covers the following areas:
- Aeroponics Market sizing
- Aeroponics Market forecast
- Aeroponics Market industry analysis
The robust vendor analysis is designed to help clients improve their market position, and in line with this, this report provides a detailed analysis of several leading aeroponics market vendors that include AeroFarms LLC, Aessense Corp., AgriHouse Brands Ltd., Barton Breeze Pvt. Ltd., Bifarm Tech Inc., CleanGreens Solutions SA, Eden Grow Systems, Evergreen Farm Oy, Freight Farms Inc., Good Life Growing, Hexagro Urban Farming Srl, LettUs Grow Ltd., Living Greens Farm Inc., Neofarms GmbH, and The Scotts Miracle Gro Co.. Also, the aeroponics market analysis report includes information on upcoming trends and challenges that will influence market growth. This is to help companies strategize and leverage all forthcoming growth opportunities.
The publisher presents a detailed picture of the market by the way of study, synthesis, and summation of data from multiple sources by an analysis of key parameters such as profit, pricing, competition, and promotions. It presents various market facets by identifying the key industry influencers. The data presented is comprehensive, reliable, and a result of extensive primary and secondary research. The market research reports provide a complete competitive landscape and an in-depth vendor selection methodology and analysis using qualitative and quantitative research to forecast accurate market growth.
Table of Contents
1 Executive Summary
- 1.1 Market overview
- Executive Summary - Chart on Market Overview
- Executive Summary - Data Table on Market Overview
- Executive Summary - Chart on Global Market Characteristics
- Executive Summary - Chart on Market By Geographical Landscape
- Executive Summary - Chart on Market Segmentation by Product
- Executive Summary - Chart on Market Segmentation by Type
- Executive Summary - Chart on Market Segmentation by Crop Type
- Executive Summary - Chart on Incremental Growth
- Executive Summary - Data Table on Incremental Growth
- Executive Summary - Chart on Company Market Positioning
2 Technavio Analysis
- 2.1 Analysis of price sensitivity, lifecycle, customer purchase basket, adoption rates, and purchase criteria
- Analysis of price sensitivity, lifecycle, customer purchase basket, adoption rates, and purchase criteria
- 2.2 Criticality of inputs and Factors of differentiation
- Overview on criticality of inputs and factors of differentiation
- 2.3 Factors of disruption
- Overview on factors of disruption
- 2.4 Impact of drivers and challenges
- Impact of drivers and challenges in 2024 and 2029
3 Market Landscape
- 3.1 Market ecosystem
- Parent Market
- Data Table on - Parent Market
- 3.2 Market characteristics
- Market characteristics analysis
- 3.3 Value chain analysis
- Value chain analysis
4 Market Sizing
- 4.1 Market definition
- Offerings of companies included in the market definition
- 4.2 Market segment analysis
- Market segments
- 4.3 Market size 2024
- 4.4 Market outlook: Forecast for 2024-2029
- Chart on Global - Market size and forecast 2024-2029 ($ million)
- Data Table on Global - Market size and forecast 2024-2029 ($ million)
- Chart on Global Market: Year-over-year growth 2024-2029 (%)
- Data Table on Global Market: Year-over-year growth 2024-2029 (%)
5 Historic Market Size
- 5.1 Global Aeroponics Market 2019 - 2023
- Historic Market Size - Data Table on Global Aeroponics Market 2019 - 2023 ($ million)
- 5.2 Product segment analysis 2019 - 2023
- Historic Market Size - Product Segment 2019 - 2023 ($ million)
- 5.3 Type segment analysis 2019 - 2023
- Historic Market Size - Type Segment 2019 - 2023 ($ million)
- 5.4 Crop Type segment analysis 2019 - 2023
- Historic Market Size - Crop Type Segment 2019 - 2023 ($ million)
- 5.5 Geography segment analysis 2019 - 2023
- Historic Market Size - Geography Segment 2019 - 2023 ($ million)
- 5.6 Country segment analysis 2019 - 2023
- Historic Market Size - Country Segment 2019 - 2023 ($ million)
6 Qualitative Analysis
- 6.1 The AI impact on Global Aeroponics Market
7 Five Forces Analysis
- 7.1 Five forces summary
- Five forces analysis - Comparison between 2024 and 2029
- 7.2 Bargaining power of buyers
- Bargaining power of buyers - Impact of key factors 2024 and 2029
- 7.3 Bargaining power of suppliers
- Bargaining power of suppliers - Impact of key factors in 2024 and 2029
- 7.4 Threat of new entrants
- Threat of new entrants - Impact of key factors in 2024 and 2029
- 7.5 Threat of substitutes
- Threat of substitutes - Impact of key factors in 2024 and 2029
- 7.6 Threat of rivalry
- Threat of rivalry - Impact of key factors in 2024 and 2029
- 7.7 Market condition
- Chart on Market condition - Five forces 2024 and 2029
8 Market Segmentation by Product
- 8.1 Market segments
- Chart on Product - Market share 2024-2029 (%)
- Data Table on Product - Market share 2024-2029 (%)
- 8.2 Comparison by Product
- Chart on Comparison by Product
- Data Table on Comparison by Product
- 8.3 Low pressure aeroponics - Market size and forecast 2024-2029
- Chart on Low pressure aeroponics - Market size and forecast 2024-2029 ($ million)
- Data Table on Low pressure aeroponics - Market size and forecast 2024-2029 ($ million)
- Chart on Low pressure aeroponics - Year-over-year growth 2024-2029 (%)
- Data Table on Low pressure aeroponics - Year-over-year growth 2024-2029 (%)
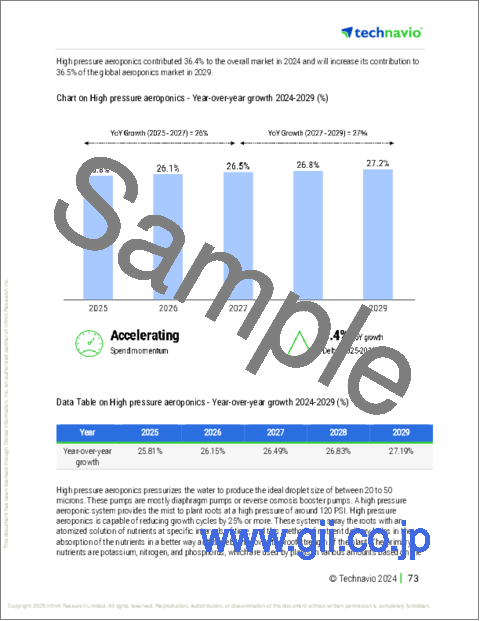
- 8.4 High pressure aeroponics - Market size and forecast 2024-2029
- Chart on High pressure aeroponics - Market size and forecast 2024-2029 ($ million)
- Data Table on High pressure aeroponics - Market size and forecast 2024-2029 ($ million)
- Chart on High pressure aeroponics - Year-over-year growth 2024-2029 (%)
- Data Table on High pressure aeroponics - Year-over-year growth 2024-2029 (%)
- 8.5 Ultrasonic fogger aeroponics - Market size and forecast 2024-2029
- Chart on Ultrasonic fogger aeroponics - Market size and forecast 2024-2029 ($ million)
- Data Table on Ultrasonic fogger aeroponics - Market size and forecast 2024-2029 ($ million)
- Chart on Ultrasonic fogger aeroponics - Year-over-year growth 2024-2029 (%)
- Data Table on Ultrasonic fogger aeroponics - Year-over-year growth 2024-2029 (%)
- 8.6 Market opportunity by Product
- Market opportunity by Product ($ million)
- Data Table on Market opportunity by Product ($ million)
9 Market Segmentation by Type
- 9.1 Market segments
- Chart on Type - Market share 2024-2029 (%)
- Data Table on Type - Market share 2024-2029 (%)
- 9.2 Comparison by Type
- Chart on Comparison by Type
- Data Table on Comparison by Type
- 9.3 Indoor farming - Market size and forecast 2024-2029
- Chart on Indoor farming - Market size and forecast 2024-2029 ($ million)
- Data Table on Indoor farming - Market size and forecast 2024-2029 ($ million)
- Chart on Indoor farming - Year-over-year growth 2024-2029 (%)
- Data Table on Indoor farming - Year-over-year growth 2024-2029 (%)
- 9.4 Outdoor farming - Market size and forecast 2024-2029
- Chart on Outdoor farming - Market size and forecast 2024-2029 ($ million)
- Data Table on Outdoor farming - Market size and forecast 2024-2029 ($ million)
- Chart on Outdoor farming - Year-over-year growth 2024-2029 (%)
- Data Table on Outdoor farming - Year-over-year growth 2024-2029 (%)
- 9.5 Market opportunity by Type
- Market opportunity by Type ($ million)
- Data Table on Market opportunity by Type ($ million)
10 Market Segmentation by Crop Type
- 10.1 Market segments
- Chart on Crop Type - Market share 2024-2029 (%)
- Data Table on Crop Type - Market share 2024-2029 (%)
- 10.2 Comparison by Crop Type
- Chart on Comparison by Crop Type
- Data Table on Comparison by Crop Type
- 10.3 Vegetables - Market size and forecast 2024-2029
- Chart on Vegetables - Market size and forecast 2024-2029 ($ million)
- Data Table on Vegetables - Market size and forecast 2024-2029 ($ million)
- Chart on Vegetables - Year-over-year growth 2024-2029 (%)
- Data Table on Vegetables - Year-over-year growth 2024-2029 (%)
- 10.4 Fruits - Market size and forecast 2024-2029
- Chart on Fruits - Market size and forecast 2024-2029 ($ million)
- Data Table on Fruits - Market size and forecast 2024-2029 ($ million)
- Chart on Fruits - Year-over-year growth 2024-2029 (%)
- Data Table on Fruits - Year-over-year growth 2024-2029 (%)
- 10.5 Herbs - Market size and forecast 2024-2029
- Chart on Herbs - Market size and forecast 2024-2029 ($ million)
- Data Table on Herbs - Market size and forecast 2024-2029 ($ million)
- Chart on Herbs - Year-over-year growth 2024-2029 (%)
- Data Table on Herbs - Year-over-year growth 2024-2029 (%)
- 10.6 Flowers - Market size and forecast 2024-2029
- Chart on Flowers - Market size and forecast 2024-2029 ($ million)
- Data Table on Flowers - Market size and forecast 2024-2029 ($ million)
- Chart on Flowers - Year-over-year growth 2024-2029 (%)
- Data Table on Flowers - Year-over-year growth 2024-2029 (%)
- 10.7 Others - Market size and forecast 2024-2029
- Chart on Others - Market size and forecast 2024-2029 ($ million)
- Data Table on Others - Market size and forecast 2024-2029 ($ million)
- Chart on Others - Year-over-year growth 2024-2029 (%)
- Data Table on Others - Year-over-year growth 2024-2029 (%)
- 10.8 Market opportunity by Crop Type
- Market opportunity by Crop Type ($ million)
- Data Table on Market opportunity by Crop Type ($ million)
11 Customer Landscape
- 11.1 Customer landscape overview
- Analysis of price sensitivity, lifecycle, customer purchase basket, adoption rates, and purchase criteria
12 Geographic Landscape
- 12.1 Geographic segmentation
- Chart on Market share By Geographical Landscape 2024-2029 (%)
- Data Table on Market share By Geographical Landscape 2024-2029 (%)
- 12.2 Geographic comparison
- Chart on Geographic comparison
- Data Table on Geographic comparison
- 12.3 Europe - Market size and forecast 2024-2029
- Chart on Europe - Market size and forecast 2024-2029 ($ million)
- Data Table on Europe - Market size and forecast 2024-2029 ($ million)
- Chart on Europe - Year-over-year growth 2024-2029 (%)
- Data Table on Europe - Year-over-year growth 2024-2029 (%)
- 12.4 APAC - Market size and forecast 2024-2029
- Chart on APAC - Market size and forecast 2024-2029 ($ million)
- Data Table on APAC - Market size and forecast 2024-2029 ($ million)
- Chart on APAC - Year-over-year growth 2024-2029 (%)
- Data Table on APAC - Year-over-year growth 2024-2029 (%)
- 12.5 North America - Market size and forecast 2024-2029
- Chart on North America - Market size and forecast 2024-2029 ($ million)
- Data Table on North America - Market size and forecast 2024-2029 ($ million)
- Chart on North America - Year-over-year growth 2024-2029 (%)
- Data Table on North America - Year-over-year growth 2024-2029 (%)
- 12.6 South America - Market size and forecast 2024-2029
- Chart on South America - Market size and forecast 2024-2029 ($ million)
- Data Table on South America - Market size and forecast 2024-2029 ($ million)
- Chart on South America - Year-over-year growth 2024-2029 (%)
- Data Table on South America - Year-over-year growth 2024-2029 (%)
- 12.7 Middle East and Africa - Market size and forecast 2024-2029
- Chart on Middle East and Africa - Market size and forecast 2024-2029 ($ million)
- Data Table on Middle East and Africa - Market size and forecast 2024-2029 ($ million)
- Chart on Middle East and Africa - Year-over-year growth 2024-2029 (%)
- Data Table on Middle East and Africa - Year-over-year growth 2024-2029 (%)
- 12.8 US - Market size and forecast 2024-2029
- Chart on US - Market size and forecast 2024-2029 ($ million)
- Data Table on US - Market size and forecast 2024-2029 ($ million)
- Chart on US - Year-over-year growth 2024-2029 (%)
- Data Table on US - Year-over-year growth 2024-2029 (%)
- 12.9 The Netherlands - Market size and forecast 2024-2029
- Chart on The Netherlands - Market size and forecast 2024-2029 ($ million)
- Data Table on The Netherlands - Market size and forecast 2024-2029 ($ million)
- Chart on The Netherlands - Year-over-year growth 2024-2029 (%)
- Data Table on The Netherlands - Year-over-year growth 2024-2029 (%)
- 12.10 Japan - Market size and forecast 2024-2029
- Chart on Japan - Market size and forecast 2024-2029 ($ million)
- Data Table on Japan - Market size and forecast 2024-2029 ($ million)
- Chart on Japan - Year-over-year growth 2024-2029 (%)
- Data Table on Japan - Year-over-year growth 2024-2029 (%)
- 12.11 China - Market size and forecast 2024-2029
- Chart on China - Market size and forecast 2024-2029 ($ million)
- Data Table on China - Market size and forecast 2024-2029 ($ million)
- Chart on China - Year-over-year growth 2024-2029 (%)
- Data Table on China - Year-over-year growth 2024-2029 (%)
- 12.12 Canada - Market size and forecast 2024-2029
- Chart on Canada - Market size and forecast 2024-2029 ($ million)
- Data Table on Canada - Market size and forecast 2024-2029 ($ million)
- Chart on Canada - Year-over-year growth 2024-2029 (%)
- Data Table on Canada - Year-over-year growth 2024-2029 (%)
- 12.13 India - Market size and forecast 2024-2029
- Chart on India - Market size and forecast 2024-2029 ($ million)
- Data Table on India - Market size and forecast 2024-2029 ($ million)
- Chart on India - Year-over-year growth 2024-2029 (%)
- Data Table on India - Year-over-year growth 2024-2029 (%)
- 12.14 UK - Market size and forecast 2024-2029
- Chart on UK - Market size and forecast 2024-2029 ($ million)
- Data Table on UK - Market size and forecast 2024-2029 ($ million)
- Chart on UK - Year-over-year growth 2024-2029 (%)
- Data Table on UK - Year-over-year growth 2024-2029 (%)
- 12.15 Germany - Market size and forecast 2024-2029
- Chart on Germany - Market size and forecast 2024-2029 ($ million)
- Data Table on Germany - Market size and forecast 2024-2029 ($ million)
- Chart on Germany - Year-over-year growth 2024-2029 (%)
- Data Table on Germany - Year-over-year growth 2024-2029 (%)
- 12.16 France - Market size and forecast 2024-2029
- Chart on France - Market size and forecast 2024-2029 ($ million)
- Data Table on France - Market size and forecast 2024-2029 ($ million)
- Chart on France - Year-over-year growth 2024-2029 (%)
- Data Table on France - Year-over-year growth 2024-2029 (%)
- 12.17 South Korea - Market size and forecast 2024-2029
- Chart on South Korea - Market size and forecast 2024-2029 ($ million)
- Data Table on South Korea - Market size and forecast 2024-2029 ($ million)
- Chart on South Korea - Year-over-year growth 2024-2029 (%)
- Data Table on South Korea - Year-over-year growth 2024-2029 (%)
- 12.18 Market opportunity By Geographical Landscape
- Market opportunity By Geographical Landscape ($ million)
- Data Tables on Market opportunity By Geographical Landscape ($ million)
13 Drivers, Challenges, and Opportunity/Restraints
- 13.1 Market drivers
- 13.2 Market challenges
- 13.3 Impact of drivers and challenges
- Impact of drivers and challenges in 2024 and 2029
- 13.4 Market opportunities/restraints
14 Competitive Landscape
- 14.1 Overview
- 14.2 Competitive Landscape
- Overview on criticality of inputs and factors of differentiation
- 14.3 Landscape disruption
- Overview on factors of disruption
- 14.4 Industry risks
- Impact of key risks on business
15 Competitive Analysis
- 15.1 Companies profiled
- Companies covered
- 15.2 Company ranking index
- Company ranking index
- 15.3 Market positioning of companies
- Matrix on companies position and classification
- 15.4 AeroFarms LLC
- AeroFarms LLC - Overview
- AeroFarms LLC - Product / Service
- AeroFarms LLC - Key offerings
- SWOT
- 15.5 Aessense Corp.
- Aessense Corp. - Overview
- Aessense Corp. - Product / Service
- Aessense Corp. - Key offerings
- SWOT
- 15.6 AgriHouse Brands Ltd.
- AgriHouse Brands Ltd. - Overview
- AgriHouse Brands Ltd. - Product / Service
- AgriHouse Brands Ltd. - Key offerings
- SWOT
- 15.7 Barton Breeze Pvt. Ltd.
- Barton Breeze Pvt. Ltd. - Overview
- Barton Breeze Pvt. Ltd. - Product / Service
- Barton Breeze Pvt. Ltd. - Key offerings
- SWOT
- 15.8 Bifarm Tech Inc.
- Bifarm Tech Inc. - Overview
- Bifarm Tech Inc. - Product / Service
- Bifarm Tech Inc. - Key offerings
- SWOT
- 15.9 CleanGreens Solutions SA
- CleanGreens Solutions SA - Overview
- CleanGreens Solutions SA - Product / Service
- CleanGreens Solutions SA - Key offerings
- SWOT
- 15.10 Eden Grow Systems
- Eden Grow Systems - Overview
- Eden Grow Systems - Product / Service
- Eden Grow Systems - Key offerings
- SWOT
- 15.11 Evergreen Farm Oy
- Evergreen Farm Oy - Overview
- Evergreen Farm Oy - Product / Service
- Evergreen Farm Oy - Key offerings
- SWOT
- 15.12 Freight Farms Inc.
- Freight Farms Inc. - Overview
- Freight Farms Inc. - Product / Service
- Freight Farms Inc. - Key offerings
- SWOT
- 15.13 Good Life Growing
- Good Life Growing - Overview
- Good Life Growing - Product / Service
- Good Life Growing - Key offerings
- SWOT
- 15.14 Hexagro Urban Farming Srl
- Hexagro Urban Farming Srl - Overview
- Hexagro Urban Farming Srl - Product / Service
- Hexagro Urban Farming Srl - Key offerings
- SWOT
- 15.15 LettUs Grow Ltd.
- LettUs Grow Ltd. - Overview
- LettUs Grow Ltd. - Product / Service
- LettUs Grow Ltd. - Key offerings
- SWOT
- 15.16 Living Greens Farm Inc.
- Living Greens Farm Inc. - Overview
- Living Greens Farm Inc. - Product / Service
- Living Greens Farm Inc. - Key offerings
- SWOT
- 15.17 Neofarms GmbH
- Neofarms GmbH - Overview
- Neofarms GmbH - Product / Service
- Neofarms GmbH - Key offerings
- SWOT
- 15.18 The Scotts Miracle Gro Co.
- The Scotts Miracle Gro Co. - Overview
- The Scotts Miracle Gro Co. - Business segments
- The Scotts Miracle Gro Co. - Key offerings
- The Scotts Miracle Gro Co. - Segment focus
- SWOT
16 Appendix
- 16.1 Scope of the report
- 16.2 Inclusions and exclusions checklist
- Inclusions checklist
- Exclusions checklist
- 16.3 Currency conversion rates for US$
- Currency conversion rates for US$
- 16.4 Research methodology
- Research methodology
- 16.5 Data procurement
- Information sources
- 16.6 Data validation
- Data validation
- 16.7 Validation techniques employed for market sizing
- Validation techniques employed for market sizing
- 16.8 Data synthesis
- Data synthesis
- 16.9 360 degree market analysis
- 360 degree market analysis
- 16.10 List of abbreviations
- List of abbreviations

