|
|
市場調査レポート
商品コード
1459522
血管塞栓装置の世界市場 2024-2028Global Vascular Embolization Devices Market 2024-2028 |
||||||
|
|||||||
カスタマイズ可能
|
|||||||


| 血管塞栓装置の世界市場 2024-2028 |
|
出版日: 2024年03月20日
発行: TechNavio
ページ情報: 英文 167 Pages
納期: 即納可能
|

全表示
- 概要
- 図表
- 目次
血管塞栓装置市場は2023-2028年に7億3,535万米ドル、予測期間中のCAGRは6.69%で成長すると予測されます。
当レポートでは、血管塞栓装置市場の全体的な分析、市場規模・予測、動向、成長促進要因、課題、約25のベンダーを網羅したベンダー分析などを掲載しています。
現在の市場シナリオ、最新動向と促進要因、市場環境全体に関する最新分析を提供しています。市場は、血管疾患の有病率の増加、血管塞栓装置に関連する新製品の発売数の増加、関連する血管疾患製品のM&Aの増加によって牽引されています。
| 市場範囲 | |
|---|---|
| 基準年 | 2024 |
| 終了年 | 2028 |
| 予測期間 | 2024-2028 |
| 成長モメンタム | 加速 |
| 前年比2024年 | 5.94% |
| CAGR | 6.69% |
| 増分額 | 7億3,535万米ドル |
本調査では、今後数年間の血管塞栓装置市場成長を牽引する主要因の1つとして、自動車事故の増加を挙げています。また、ベンチャーキャピタルや政府組織からの新興塞栓装置企業への資金提供、塞栓製品・手技の革新が市場の大きな需要につながるとしています。
目次
第1章 エグゼクティブサマリー
- 市場概要
第2章 市場情勢
- 市場エコシステム
第3章 市場規模の評価
- 市場の定義
- 市場セグメント分析
- 市場規模 2023
- 市場の見通し 2023-2028
第4章 市場規模実績
- 血管塞栓装置の世界市場 2018-2022
- エンドユーザーセグメント分析 2018-2022
- 製品セグメント分析 2018-2022
- 地域別セグメント分析 2018-2022
- 国別セグメント分析 2018-2022
第5章 ファイブフォース分析
- ファイブフォースの要約
- 買い手の交渉力
- 供給企業の交渉力
- 新規参入業者の脅威
- 代替品の脅威
- 競争の脅威
- 市況
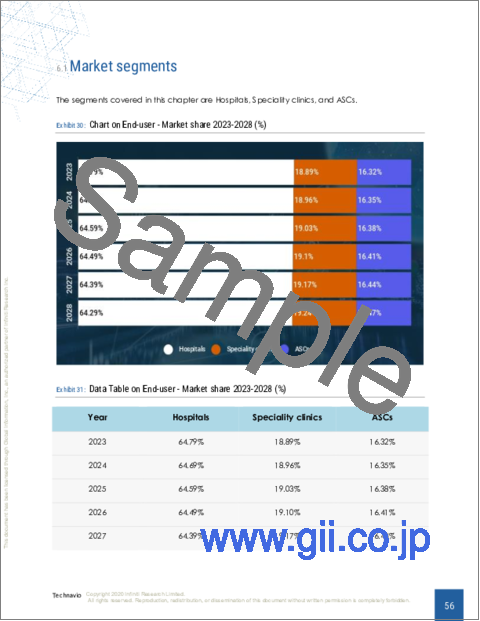
第6章 市場セグメンテーション:エンドユーザー別
- 市場セグメント
- 比較:エンドユーザー別
- 病院:市場規模と予測 2023-2028
- 専門クリニック:市場規模と予測 2023-2028
- ASCs:市場規模と予測 2023-2028
- 市場機会:エンドユーザー別
第7章 市場セグメンテーション:製品別
- 市場セグメント
- 比較:製品別
- コイル装置:市場規模と予測 2023-2028
- 非コイル装置:市場規模と予測 2023-2028
- 市場機会:製品別
第8章 顧客情勢
- 顧客情勢の概要
第9章 地域別情勢
- 地域別セグメンテーション
- 地域別比較
- 北米:市場規模と予測 2023-2028
- 欧州:市場規模と予測 2023-2028
- アジア:市場規模と予測 2023-2028
- 世界のその他の地域:市場規模と予測 2023-2028
- 米国:市場規模と予測 2023-2028
- ドイツ:市場規模と予測 2023-2028
- フランス:市場規模と予測 2023-2028
- 英国:市場規模と予測 2023-2028
- 日本:市場規模と予測 2023-2028
- 市場機会:地域情勢別
第10章 促進要因、課題、および動向
- 市場促進要因
- 市場の課題
- 促進要因と課題の影響
- 市場動向
第11章 ベンダー情勢
- 概要
- ベンダー情勢
- 混乱の状況
- 業界のリスク
第12章 ベンダー分析
- 対象ベンダー
- ベンダーの市場ポジショニング
- Abbott Laboratories
- Acandis GmbH
- BALT Group
- Boston Scientific Corp.
- Braile Biomedica
- Cook Group Inc.
- Eisai Co. Ltd.
- Embolx Inc.
- Johnson and Johnson Services Inc.
- Medtronic
- Merit Medical Systems Inc.
- Penumbra Inc.
- Shape Memory Medical Inc.
- Stryker Corp.
- Terumo Corp.
第13章 付録
Exhibits:
- Exhibits1: Executive Summary - Chart on Market Overview
- Exhibits2: Executive Summary - Data Table on Market Overview
- Exhibits3: Executive Summary - Chart on Global Market Characteristics
- Exhibits4: Executive Summary - Chart on Market By Geographical Landscape
- Exhibits5: Executive Summary - Chart on Market Segmentation by End-user
- Exhibits6: Executive Summary - Chart on Market Segmentation by Product
- Exhibits7: Executive Summary - Chart on Incremental Growth
- Exhibits8: Executive Summary - Data Table on Incremental Growth
- Exhibits9: Executive Summary - Chart on Vendor Market Positioning
- Exhibits10: Parent market
- Exhibits11: Market Characteristics
- Exhibits12: Offerings of vendors included in the market definition
- Exhibits13: Market segments
- Exhibits14: Chart on Global - Market size and forecast 2023-2028 ($ million)
- Exhibits15: Data Table on Global - Market size and forecast 2023-2028 ($ million)
- Exhibits16: Chart on Global Market: Year-over-year growth 2023-2028 (%)
- Exhibits17: Data Table on Global Market: Year-over-year growth 2023-2028 (%)
- Exhibits18: Historic Market Size - Data Table on global vascular embolization devices market 2018 - 2022 ($ million)
- Exhibits19: Historic Market Size - End-user Segment 2018 - 2022 ($ million)
- Exhibits20: Historic Market Size - Product Segment 2018 - 2022 ($ million)
- Exhibits21: Historic Market Size - Geography Segment 2018 - 2022 ($ million)
- Exhibits22: Historic Market Size - Country Segment 2018 - 2022 ($ million)
- Exhibits23: Five forces analysis - Comparison between 2023 and 2028
- Exhibits24: Chart on Bargaining power of buyers - Impact of key factors 2023 and 2028
- Exhibits25: Bargaining power of suppliers - Impact of key factors in 2023 and 2028
- Exhibits26: Threat of new entrants - Impact of key factors in 2023 and 2028
- Exhibits27: Threat of substitutes - Impact of key factors in 2023 and 2028
- Exhibits28: Threat of rivalry - Impact of key factors in 2023 and 2028
- Exhibits29: Chart on Market condition - Five forces 2023 and 2028
- Exhibits30: Chart on End-user - Market share 2023-2028 (%)
- Exhibits31: Data Table on End-user - Market share 2023-2028 (%)
- Exhibits32: Chart on Comparison by End-user
- Exhibits33: Data Table on Comparison by End-user
- Exhibits34: Chart on Hospitals - Market size and forecast 2023-2028 ($ million)
- Exhibits35: Data Table on Hospitals - Market size and forecast 2023-2028 ($ million)
- Exhibits36: Chart on Hospitals - Year-over-year growth 2023-2028 (%)
- Exhibits37: Data Table on Hospitals - Year-over-year growth 2023-2028 (%)
- Exhibits38: Chart on Speciality clinics - Market size and forecast 2023-2028 ($ million)
- Exhibits39: Data Table on Speciality clinics - Market size and forecast 2023-2028 ($ million)
- Exhibits40: Chart on Speciality clinics - Year-over-year growth 2023-2028 (%)
- Exhibits41: Data Table on Speciality clinics - Year-over-year growth 2023-2028 (%)
- Exhibits42: Chart on ASCs - Market size and forecast 2023-2028 ($ million)
- Exhibits43: Data Table on ASCs - Market size and forecast 2023-2028 ($ million)
- Exhibits44: Chart on ASCs - Year-over-year growth 2023-2028 (%)
- Exhibits45: Data Table on ASCs - Year-over-year growth 2023-2028 (%)
- Exhibits46: Market opportunity by End-user ($ million)
- Exhibits47: Data Table on Market opportunity by End-user ($ million)
- Exhibits48: Chart on Product - Market share 2023-2028 (%)
- Exhibits49: Data Table on Product - Market share 2023-2028 (%)
- Exhibits50: Chart on Comparison by Product
- Exhibits51: Data Table on Comparison by Product
- Exhibits52: Chart on Coiling devices - Market size and forecast 2023-2028 ($ million)
- Exhibits53: Data Table on Coiling devices - Market size and forecast 2023-2028 ($ million)
- Exhibits54: Chart on Coiling devices - Year-over-year growth 2023-2028 (%)
- Exhibits55: Data Table on Coiling devices - Year-over-year growth 2023-2028 (%)
- Exhibits56: Chart on Non-coiling devices - Market size and forecast 2023-2028 ($ million)
- Exhibits57: Data Table on Non-coiling devices - Market size and forecast 2023-2028 ($ million)
- Exhibits58: Chart on Non-coiling devices - Year-over-year growth 2023-2028 (%)
- Exhibits59: Data Table on Non-coiling devices - Year-over-year growth 2023-2028 (%)
- Exhibits60: Market opportunity by Product ($ million)
- Exhibits61: Data Table on Market opportunity by Product ($ million)
- Exhibits62: Analysis of price sensitivity, lifecycle, customer purchase basket, adoption rates, and purchase criteria
- Exhibits63: Chart on Market share By Geographical Landscape 2023-2028 (%)
- Exhibits64: Data Table on Market share By Geographical Landscape 2023-2028 (%)
- Exhibits65: Chart on Geographic comparison
- Exhibits66: Data Table on Geographic comparison
- Exhibits67: Chart on North America - Market size and forecast 2023-2028 ($ million)
- Exhibits68: Data Table on North America - Market size and forecast 2023-2028 ($ million)
- Exhibits69: Chart on North America - Year-over-year growth 2023-2028 (%)
- Exhibits70: Data Table on North America - Year-over-year growth 2023-2028 (%)
- Exhibits71: Chart on Europe - Market size and forecast 2023-2028 ($ million)
- Exhibits72: Data Table on Europe - Market size and forecast 2023-2028 ($ million)
- Exhibits73: Chart on Europe - Year-over-year growth 2023-2028 (%)
- Exhibits74: Data Table on Europe - Year-over-year growth 2023-2028 (%)
- Exhibits75: Chart on Asia - Market size and forecast 2023-2028 ($ million)
- Exhibits76: Data Table on Asia - Market size and forecast 2023-2028 ($ million)
- Exhibits77: Chart on Asia - Year-over-year growth 2023-2028 (%)
- Exhibits78: Data Table on Asia - Year-over-year growth 2023-2028 (%)
- Exhibits79: Chart on Rest of World (ROW) - Market size and forecast 2023-2028 ($ million)
- Exhibits80: Data Table on Rest of World (ROW) - Market size and forecast 2023-2028 ($ million)
- Exhibits81: Chart on Rest of World (ROW) - Year-over-year growth 2023-2028 (%)
- Exhibits82: Data Table on Rest of World (ROW) - Year-over-year growth 2023-2028 (%)
- Exhibits83: Chart on US - Market size and forecast 2023-2028 ($ million)
- Exhibits84: Data Table on US - Market size and forecast 2023-2028 ($ million)
- Exhibits85: Chart on US - Year-over-year growth 2023-2028 (%)
- Exhibits86: Data Table on US - Year-over-year growth 2023-2028 (%)
- Exhibits87: Chart on Germany - Market size and forecast 2023-2028 ($ million)
- Exhibits88: Data Table on Germany - Market size and forecast 2023-2028 ($ million)
- Exhibits89: Chart on Germany - Year-over-year growth 2023-2028 (%)
- Exhibits90: Data Table on Germany - Year-over-year growth 2023-2028 (%)
- Exhibits91: Chart on France - Market size and forecast 2023-2028 ($ million)
- Exhibits92: Data Table on France - Market size and forecast 2023-2028 ($ million)
- Exhibits93: Chart on France - Year-over-year growth 2023-2028 (%)
- Exhibits94: Data Table on France - Year-over-year growth 2023-2028 (%)
- Exhibits95: Chart on UK - Market size and forecast 2023-2028 ($ million)
- Exhibits96: Data Table on UK - Market size and forecast 2023-2028 ($ million)
- Exhibits97: Chart on UK - Year-over-year growth 2023-2028 (%)
- Exhibits98: Data Table on UK - Year-over-year growth 2023-2028 (%)
- Exhibits99: Chart on Japan - Market size and forecast 2023-2028 ($ million)
- Exhibits100: Data Table on Japan - Market size and forecast 2023-2028 ($ million)
- Exhibits101: Chart on Japan - Year-over-year growth 2023-2028 (%)
- Exhibits102: Data Table on Japan - Year-over-year growth 2023-2028 (%)
- Exhibits103: Market opportunity By Geographical Landscape ($ million)
- Exhibits104: Data Tables on Market opportunity By Geographical Landscape ($ million)
- Exhibits105: Impact of drivers and challenges in 2023 and 2028
- Exhibits106: Overview on Criticality of inputs and Factors of differentiation
- Exhibits107: Overview on factors of disruption
- Exhibits108: Impact of key risks on business
- Exhibits109: Vendors covered
- Exhibits110: Matrix on vendor position and classification
- Exhibits111: Abbott Laboratories - Overview
- Exhibits112: Abbott Laboratories - Business segments
- Exhibits113: Abbott Laboratories - Key news
- Exhibits114: Abbott Laboratories - Key offerings
- Exhibits115: Abbott Laboratories - Segment focus
- Exhibits116: Acandis GmbH - Overview
- Exhibits117: Acandis GmbH - Product / Service
- Exhibits118: Acandis GmbH - Key offerings
- Exhibits119: BALT Group - Overview
- Exhibits120: BALT Group - Product / Service
- Exhibits121: BALT Group - Key offerings
- Exhibits122: Boston Scientific Corp. - Overview
- Exhibits123: Boston Scientific Corp. - Business segments
- Exhibits124: Boston Scientific Corp. - Key news
- Exhibits125: Boston Scientific Corp. - Key offerings
- Exhibits126: Boston Scientific Corp. - Segment focus
- Exhibits127: Braile Biomedica - Overview
- Exhibits128: Braile Biomedica - Product / Service
- Exhibits129: Braile Biomedica - Key offerings
- Exhibits130: Cook Group Inc. - Overview
- Exhibits131: Cook Group Inc. - Product / Service
- Exhibits132: Cook Group Inc. - Key news
- Exhibits133: Cook Group Inc. - Key offerings
- Exhibits134: Eisai Co. Ltd. - Overview
- Exhibits135: Eisai Co. Ltd. - Business segments
- Exhibits136: Eisai Co. Ltd. - Key offerings
- Exhibits137: Eisai Co. Ltd. - Segment focus
- Exhibits138: Embolx Inc. - Overview
- Exhibits139: Embolx Inc. - Product / Service
- Exhibits140: Embolx Inc. - Key offerings
- Exhibits141: Johnson and Johnson Services Inc. - Overview
- Exhibits142: Johnson and Johnson Services Inc. - Business segments
- Exhibits143: Johnson and Johnson Services Inc. - Key news
- Exhibits144: Johnson and Johnson Services Inc. - Key offerings
- Exhibits145: Johnson and Johnson Services Inc. - Segment focus
- Exhibits146: Medtronic - Overview
- Exhibits147: Medtronic - Business segments
- Exhibits148: Medtronic - Key news
- Exhibits149: Medtronic - Key offerings
- Exhibits150: Medtronic - Segment focus
- Exhibits151: Merit Medical Systems Inc. - Overview
- Exhibits152: Merit Medical Systems Inc. - Business segments
- Exhibits153: Merit Medical Systems Inc. - Key offerings
- Exhibits154: Merit Medical Systems Inc. - Segment focus
- Exhibits155: Penumbra Inc. - Overview
- Exhibits156: Penumbra Inc. - Product / Service
- Exhibits157: Penumbra Inc. - Key news
- Exhibits158: Penumbra Inc. - Key offerings
- Exhibits159: Shape Memory Medical Inc. - Overview
- Exhibits160: Shape Memory Medical Inc. - Product / Service
- Exhibits161: Shape Memory Medical Inc. - Key offerings
- Exhibits162: Stryker Corp. - Overview
- Exhibits163: Stryker Corp. - Business segments
- Exhibits164: Stryker Corp. - Key news
- Exhibits165: Stryker Corp. - Key offerings
- Exhibits166: Stryker Corp. - Segment focus
- Exhibits167: Terumo Corp. - Overview
- Exhibits168: Terumo Corp. - Business segments
- Exhibits169: Terumo Corp. - Key offerings
- Exhibits170: Terumo Corp. - Segment focus
- Exhibits171: Inclusions checklist
- Exhibits172: Exclusions checklist
- Exhibits173: Currency conversion rates for US$
- Exhibits174: Research methodology
- Exhibits175: Validation techniques employed for market sizing
- Exhibits176: Information sources
- Exhibits177: List of abbreviations
The vascular embolization devices market is forecasted to grow by USD 735.35 mn during 2023-2028, accelerating at a CAGR of 6.69% during the forecast period. The report on the vascular embolization devices market provides a holistic analysis, market size and forecast, trends, growth drivers, and challenges, as well as vendor analysis covering around 25 vendors.
The report offers an up-to-date analysis regarding the current market scenario, the latest trends and drivers, and the overall market environment. The market is driven by the increasing prevalence of vascular diseases, a rising number of new product launches related to vascular embolization devices, and a growing number of m and activities in related vascular disease products.
Technavio's vascular embolization devices market is segmented as below:
| Market Scope | |
|---|---|
| Base Year | 2024 |
| End Year | 2028 |
| Series Year | 2024-2028 |
| Growth Momentum | Accelerate |
| YOY 2024 | 5.94% |
| CAGR | 6.69% |
| Incremental Value | $735.35mn |
By End-user
- Hospitals
- Speciality clinics
- ASCs
By Product
- Coiling devices
- Non-coiling devices
By Geographical Landscape
- North America
- Europe
- Asia
- Rest of World (ROW)
This study identifies the rise in cases of automobile accidents as one of the prime reasons driving the vascular embolization devices market growth during the next few years. Also, funding for start-up embolization device companies from venture capitalists and government organizations and innovation in embolization products and procedures will lead to sizable demand in the market.
The report on the vascular embolization devices market covers the following areas:
- Vascular embolization devices market sizing
- Vascular embolization devices market forecast
- Vascular embolization devices market industry analysis
The robust vendor analysis is designed to help clients improve their market position, and in line with this, this report provides a detailed analysis of several leading vascular embolization devices market vendors that include Acandis GmbH, B.Braun SE, BALT Group, Boston Scientific Corp., Braile Biomedica, Eisai Co. Ltd., Embolx Inc., Guerbet, Johnson and Johnson Services Inc., Kaneka Corp., Medtronic, Merit Medical Systems Inc., Penumbra Inc., Shape Memory Medical Inc., Spartan Micro Inc., Stryker Corp., Wallby Medical LLC, Terumo Corp., Cook Group Inc., and Abbott Laboratories. Also, the vascular embolization devices market analysis report includes information on upcoming trends and challenges that will influence market growth. This is to help companies strategize and leverage all forthcoming growth opportunities.
The study was conducted using an objective combination of primary and secondary information including inputs from key participants in the industry. The report contains a comprehensive market and vendor landscape in addition to an analysis of the key vendors.
The publisher presents a detailed picture of the market by way of study, synthesis, and summation of data from multiple sources through an analysis of key parameters such as profit, pricing, competition, and promotions. It presents various market facets by identifying the key industry influencers. The data presented is comprehensive, reliable, and a result of extensive research - both primary and secondary. The market research reports provide a complete competitive landscape and an in-depth vendor selection methodology and analysis using qualitative and quantitative research to forecast accurate market growth.
Table of Contents
1 Executive Summary
- 1.1 Market overview
2 Market Landscape
- 2.1 Market ecosystem
3 Market Sizing
- 3.1 Market definition
- 3.2 Market segment analysis
- 3.3 Market size 2023
- 3.4 Market outlook: Forecast for 2023-2028
4 Historic Market Size
- 4.1 Global vascular embolization devices market 2018 - 2022
- 4.2 End-user Segment Analysis 2018 - 2022
- 4.3 Product Segment Analysis 2018 - 2022
- 4.4 Geography Segment Analysis 2018 - 2022
- 4.5 Country Segment Analysis 2018 - 2022
5 Five Forces Analysis
- 5.1 Five forces summary
- 5.2 Bargaining power of buyers
- 5.3 Bargaining power of suppliers
- 5.4 Threat of new entrants
- 5.5 Threat of substitutes
- 5.6 Threat of rivalry
- 5.7 Market condition
6 Market Segmentation by End-user
- 6.1 Market segments
- 6.2 Comparison by End-user
- 6.3 Hospitals - Market size and forecast 2023-2028
- 6.4 Speciality clinics - Market size and forecast 2023-2028
- 6.5 ASCs - Market size and forecast 2023-2028
- 6.6 Market opportunity by End-user
7 Market Segmentation by Product
- 7.1 Market segments
- 7.2 Comparison by Product
- 7.3 Coiling devices - Market size and forecast 2023-2028
- 7.4 Non-coiling devices - Market size and forecast 2023-2028
- 7.5 Market opportunity by Product
8 Customer Landscape
- 8.1 Customer landscape overview
9 Geographic Landscape
- 9.1 Geographic segmentation
- 9.2 Geographic comparison
- 9.3 North America - Market size and forecast 2023-2028
- 9.4 Europe - Market size and forecast 2023-2028
- 9.5 Asia - Market size and forecast 2023-2028
- 9.6 Rest of World (ROW) - Market size and forecast 2023-2028
- 9.7 US - Market size and forecast 2023-2028
- 9.8 Germany - Market size and forecast 2023-2028
- 9.9 France - Market size and forecast 2023-2028
- 9.10 UK - Market size and forecast 2023-2028
- 9.11 Japan - Market size and forecast 2023-2028
- 9.12 Market opportunity By Geographical Landscape
10 Drivers, Challenges, and Trends
- 10.1 Market drivers
- 10.2 Market challenges
- 10.3 Impact of drivers and challenges
- 10.4 Market trends
11 Vendor Landscape
- 11.1 Overview
- 11.2 Vendor landscape
- 11.3 Landscape disruption
- 11.4 Industry risks
12 Vendor Analysis
- 12.1 Vendors covered
- 12.2 Market positioning of vendors
- 12.3 Abbott Laboratories
- 12.4 Acandis GmbH
- 12.5 BALT Group
- 12.6 Boston Scientific Corp.
- 12.7 Braile Biomedica
- 12.8 Cook Group Inc.
- 12.9 Eisai Co. Ltd.
- 12.10 Embolx Inc.
- 12.11 Johnson and Johnson Services Inc.
- 12.12 Medtronic
- 12.13 Merit Medical Systems Inc.
- 12.14 Penumbra Inc.
- 12.15 Shape Memory Medical Inc.
- 12.16 Stryker Corp.
- 12.17 Terumo Corp.
13 Appendix
- 13.1 Scope of the report
- 13.2 Inclusions and exclusions checklist
- 13.3 Currency conversion rates for US$
- 13.4 Research methodology
- 13.5 List of abbreviations

