|
|
市場調査レポート
商品コード
1705144
消費者向けショッピングカートの世界市場 2025-2029Global Consumer Shopping Cart Market 2025-2029 |
||||||

|
|||||||
カスタマイズ可能
|
|||||||


| 消費者向けショッピングカートの世界市場 2025-2029 |
|
出版日: 2025年04月04日
発行: TechNavio
ページ情報: 英文 228 Pages
納期: 即納可能
|

全表示
- 概要
- 図表
- 目次
消費者向けショッピングカート市場は2024-2029年に1億3,220万米ドル、予測期間中のCAGRは2.7%で成長すると予測されます。
当レポートでは、消費者向けショッピングカート市場の全体的な分析、市場規模・予測、動向、成長促進要因、課題、約25のベンダーを網羅したベンダー分析などを掲載しています。
現在の市場シナリオ、最新動向と促進要因、市場環境全体に関する最新分析を提供しています。市場は、世界の小売セクターの拡大、ショッピングカートを通じた消費者の嗜好と体験の向上、ハイブリッドショッピングカートの利用可能性の増加が牽引しています。
| 市場範囲 | |
|---|---|
| 基準年 | 2025 |
| 終了年 | 2029 |
| 予測期間 | 2025-2029 |
| 成長モメンタム | 加速 |
| 前年比2025年 | 2.6% |
| CAGR | 2.7% |
| 増分額 | 1億3,220万米ドル |
本調査は、業界の主要参加者からのインプットを含め、一次情報と二次情報を客観的に組み合わせて実施しました。レポートには、主要企業の分析に加え、包括的な市場規模データ、地域別分析によるセグメント、ベンダー情勢が含まれています。レポートには過去データと予測データがあります。
本調査では、スマートショッピングカートの出現が、今後数年間の消費者向けショッピングカート市場の成長を促進する主要因の1つであると特定しています。また、市場に参入する新興企業の増加や、ショッピングカートに環境に優しい素材を使用することが、市場の大きな需要につながると考えられます。
目次
第1章 エグゼクティブサマリー
- 市場概要
第2章 Technavio分析
- 価格・ライフサイクル・顧客購入バスケット・採用率・購入基準の分析
- インプットの重要性と差別化の要因
- 混乱の要因
- 促進要因と課題の影響
第3章 市場情勢
- 市場エコシステム
- 市場の特徴
- バリューチェーン分析
第4章 市場規模
- 市場の定義
- 市場セグメント分析
- 市場規模 2024
- 市場の見通し 2024-2029
第5章 市場規模実績
- 消費者向けショッピングカートの世界市場 2019-2023
- 製品セグメント分析 2019-2023
- 流通チャネルセグメント分析 2019-2023
- タイプセグメント分析 2019-2023
- 製品タイプセグメント分析 2019-2023
- 地域別セグメント分析 2019-2023
- 国別セグメント分析 2019-2023
第6章 定性分析
- AIの影響:消費者向けショッピングカートの世界市場
第7章 ファイブフォース分析
- ファイブフォースの要約
- 買い手の交渉力
- 供給企業の交渉力
- 新規参入業者の脅威
- 代替品の脅威
- 競争の脅威
- 市況
第8章 市場セグメンテーション:製品別
- 市場セグメント
- 比較:製品別
- スチールカート:市場規模と予測 2024-2029
- プラスチックカート:市場規模と予測 2024-2029
- その他:市場規模と予測 2024-2029
- 市場機会:製品別
第9章 市場セグメンテーション:流通チャネル別
- 市場セグメント
- 比較:流通チャネル別
- 直接販売:市場規模と予測 2024-2029
- 販売代理店:市場規模と予測 2024-2029
- 市場機会:流通チャネル別
第10章 市場セグメンテーション:タイプ別
- 市場セグメント
- 比較:タイプ別
- 従来のショッピングカート:市場規模と予測 2024-2029
- スマートショッピングカート:市場規模と予測 2024-2029
- 市場機会:タイプ別
第11章 市場セグメンテーション:製品タイプ別
- 市場セグメント
- 比較:製品タイプ別
- ローラーバスケット:市場規模と予測 2024-2029
- 子供用カート:市場規模と予測 2024-2029
- その他:市場規模と予測 2024-2029
- 市場機会:製品タイプ別
第12章 顧客情勢
- 顧客情勢の概要
第13章 地域別情勢
- 地域別セグメンテーション
- 地域別比較
- 北米:市場規模と予測 2024-2029
- 欧州:市場規模と予測 2024-2029
- アジア太平洋:市場規模と予測 2024-2029
- 中東・アフリカ:市場規模と予測 2024-2029
- 南米:市場規模と予測 2024-2029
- 米国:市場規模と予測 2024-2029
- 英国:市場規模と予測 2024-2029
- カナダ:市場規模と予測 2024-2029
- 中国:市場規模と予測 2024-2029
- ドイツ:市場規模と予測 2024-2029
- オーストラリア:市場規模と予測 2024-2029
- フランス:市場規模と予測 2024-2029
- 日本:市場規模と予測 2024-2029
- イタリア:市場規模と予測 2024-2029
- 韓国:市場規模と予測 2024-2029
- 市場機会:地域情勢別
第14章 促進要因・課題・機会・抑制要因
- 市場促進要因
- 市場の課題
- 促進要因と課題の影響
- 市場の機会・抑制要因
第15章 競合情勢
- 概要
- 競合情勢
- 混乱の状況
- 業界のリスク
第16章 競合分析
- 企業プロファイル
- 企業ランキング指数
- 企業の市場ポジショニング
- Advance Carts Inc.
- Americana Co.
- Changshu Jinsheng Metal Products Factory
- Changshu Whale Metal Products Co. Ltd.
- Changshu Yirunda Business Equipment Factory
- CREACIONES MARSANZ S.A
- Foshan Yongchuangyi Shelf Manufacturing Co. Ltd.
- Kailiou Commercial Equipment Co. Ltd.
- National Cart Co.
- R.W. Rogers Co.
- Sambo Corp.
- The Peggs Co. Inc.
- Unarco Industries LLC
- Van Keulen Interieurbouw BV
- Versacart Systems Inc.
第17章 付録
Exhibits:
- Exhibits1: Executive Summary - Chart on Market Overview
- Exhibits2: Executive Summary - Data Table on Market Overview
- Exhibits3: Executive Summary - Chart on Global Market Characteristics
- Exhibits4: Executive Summary - Chart on Market By Geographical Landscape
- Exhibits5: Executive Summary - Chart on Market Segmentation by Product
- Exhibits6: Executive Summary - Chart on Market Segmentation by Distribution Channel
- Exhibits7: Executive Summary - Chart on Market Segmentation by Type
- Exhibits8: Executive Summary - Chart on Market Segmentation by Product Type
- Exhibits9: Executive Summary - Chart on Incremental Growth
- Exhibits10: Executive Summary - Data Table on Incremental Growth
- Exhibits11: Executive Summary - Chart on Company Market Positioning
- Exhibits12: Analysis of price sensitivity, lifecycle, customer purchase basket, adoption rates, and purchase criteria
- Exhibits13: Overview on criticality of inputs and factors of differentiation
- Exhibits14: Overview on factors of disruption
- Exhibits15: Impact of drivers and challenges in 2024 and 2029
- Exhibits16: Parent Market
- Exhibits17: Data Table on - Parent Market
- Exhibits18: Market characteristics analysis
- Exhibits19: Value chain analysis
- Exhibits20: Offerings of companies included in the market definition
- Exhibits21: Market segments
- Exhibits22: Chart on Global - Market size and forecast 2024-2029 ($ million)
- Exhibits23: Data Table on Global - Market size and forecast 2024-2029 ($ million)
- Exhibits24: Chart on Global Market: Year-over-year growth 2024-2029 (%)
- Exhibits25: Data Table on Global Market: Year-over-year growth 2024-2029 (%)
- Exhibits26: Historic Market Size - Data Table on Global Consumer Shopping Cart Market 2019 - 2023 ($ million)
- Exhibits27: Historic Market Size - Product Segment 2019 - 2023 ($ million)
- Exhibits28: Historic Market Size - Distribution Channel Segment 2019 - 2023 ($ million)
- Exhibits29: Historic Market Size - Type Segment 2019 - 2023 ($ million)
- Exhibits30: Historic Market Size - Product Type Segment 2019 - 2023 ($ million)
- Exhibits31: Historic Market Size - Geography Segment 2019 - 2023 ($ million)
- Exhibits32: Historic Market Size - Country Segment 2019 - 2023 ($ million)
- Exhibits33: Five forces analysis - Comparison between 2024 and 2029
- Exhibits34: Bargaining power of buyers - Impact of key factors 2024 and 2029
- Exhibits35: Bargaining power of suppliers - Impact of key factors in 2024 and 2029
- Exhibits36: Threat of new entrants - Impact of key factors in 2024 and 2029
- Exhibits37: Threat of substitutes - Impact of key factors in 2024 and 2029
- Exhibits38: Threat of rivalry - Impact of key factors in 2024 and 2029
- Exhibits39: Chart on Market condition - Five forces 2024 and 2029
- Exhibits40: Chart on Product - Market share 2024-2029 (%)
- Exhibits41: Data Table on Product - Market share 2024-2029 (%)
- Exhibits42: Chart on Comparison by Product
- Exhibits43: Data Table on Comparison by Product
- Exhibits44: Chart on Steel carts - Market size and forecast 2024-2029 ($ million)
- Exhibits45: Data Table on Steel carts - Market size and forecast 2024-2029 ($ million)
- Exhibits46: Chart on Steel carts - Year-over-year growth 2024-2029 (%)
- Exhibits47: Data Table on Steel carts - Year-over-year growth 2024-2029 (%)
- Exhibits48: Chart on Plastic carts - Market size and forecast 2024-2029 ($ million)
- Exhibits49: Data Table on Plastic carts - Market size and forecast 2024-2029 ($ million)
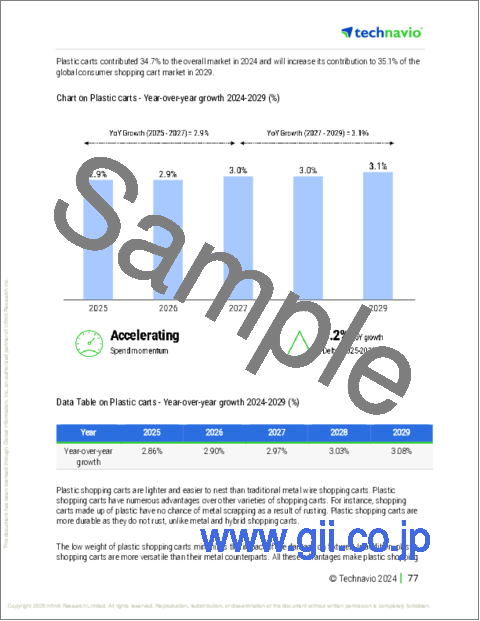
- Exhibits50: Chart on Plastic carts - Year-over-year growth 2024-2029 (%)
- Exhibits51: Data Table on Plastic carts - Year-over-year growth 2024-2029 (%)
- Exhibits52: Chart on Others - Market size and forecast 2024-2029 ($ million)
- Exhibits53: Data Table on Others - Market size and forecast 2024-2029 ($ million)
- Exhibits54: Chart on Others - Year-over-year growth 2024-2029 (%)
- Exhibits55: Data Table on Others - Year-over-year growth 2024-2029 (%)
- Exhibits56: Market opportunity by Product ($ million)
- Exhibits57: Data Table on Market opportunity by Product ($ million)
- Exhibits58: Chart on Distribution Channel - Market share 2024-2029 (%)
- Exhibits59: Data Table on Distribution Channel - Market share 2024-2029 (%)
- Exhibits60: Chart on Comparison by Distribution Channel
- Exhibits61: Data Table on Comparison by Distribution Channel
- Exhibits62: Chart on Direct sales - Market size and forecast 2024-2029 ($ million)
- Exhibits63: Data Table on Direct sales - Market size and forecast 2024-2029 ($ million)
- Exhibits64: Chart on Direct sales - Year-over-year growth 2024-2029 (%)
- Exhibits65: Data Table on Direct sales - Year-over-year growth 2024-2029 (%)
- Exhibits66: Chart on Distributors - Market size and forecast 2024-2029 ($ million)
- Exhibits67: Data Table on Distributors - Market size and forecast 2024-2029 ($ million)
- Exhibits68: Chart on Distributors - Year-over-year growth 2024-2029 (%)
- Exhibits69: Data Table on Distributors - Year-over-year growth 2024-2029 (%)
- Exhibits70: Market opportunity by Distribution Channel ($ million)
- Exhibits71: Data Table on Market opportunity by Distribution Channel ($ million)
- Exhibits72: Chart on Type - Market share 2024-2029 (%)
- Exhibits73: Data Table on Type - Market share 2024-2029 (%)
- Exhibits74: Chart on Comparison by Type
- Exhibits75: Data Table on Comparison by Type
- Exhibits76: Chart on Traditional shopping carts - Market size and forecast 2024-2029 ($ million)
- Exhibits77: Data Table on Traditional shopping carts - Market size and forecast 2024-2029 ($ million)
- Exhibits78: Chart on Traditional shopping carts - Year-over-year growth 2024-2029 (%)
- Exhibits79: Data Table on Traditional shopping carts - Year-over-year growth 2024-2029 (%)
- Exhibits80: Chart on Smart shopping carts - Market size and forecast 2024-2029 ($ million)
- Exhibits81: Data Table on Smart shopping carts - Market size and forecast 2024-2029 ($ million)
- Exhibits82: Chart on Smart shopping carts - Year-over-year growth 2024-2029 (%)
- Exhibits83: Data Table on Smart shopping carts - Year-over-year growth 2024-2029 (%)
- Exhibits84: Market opportunity by Type ($ million)
- Exhibits85: Data Table on Market opportunity by Type ($ million)
- Exhibits86: Chart on Product Type - Market share 2024-2029 (%)
- Exhibits87: Data Table on Product Type - Market share 2024-2029 (%)
- Exhibits88: Chart on Comparison by Product Type
- Exhibits89: Data Table on Comparison by Product Type
- Exhibits90: Chart on Roller basket - Market size and forecast 2024-2029 ($ million)
- Exhibits91: Data Table on Roller basket - Market size and forecast 2024-2029 ($ million)
- Exhibits92: Chart on Roller basket - Year-over-year growth 2024-2029 (%)
- Exhibits93: Data Table on Roller basket - Year-over-year growth 2024-2029 (%)
- Exhibits94: Chart on Child cart - Market size and forecast 2024-2029 ($ million)
- Exhibits95: Data Table on Child cart - Market size and forecast 2024-2029 ($ million)
- Exhibits96: Chart on Child cart - Year-over-year growth 2024-2029 (%)
- Exhibits97: Data Table on Child cart - Year-over-year growth 2024-2029 (%)
- Exhibits98: Chart on Others - Market size and forecast 2024-2029 ($ million)
- Exhibits99: Data Table on Others - Market size and forecast 2024-2029 ($ million)
- Exhibits100: Chart on Others - Year-over-year growth 2024-2029 (%)
- Exhibits101: Data Table on Others - Year-over-year growth 2024-2029 (%)
- Exhibits102: Market opportunity by Product Type ($ million)
- Exhibits103: Data Table on Market opportunity by Product Type ($ million)
- Exhibits104: Analysis of price sensitivity, lifecycle, customer purchase basket, adoption rates, and purchase criteria
- Exhibits105: Chart on Market share By Geographical Landscape 2024-2029 (%)
- Exhibits106: Data Table on Market share By Geographical Landscape 2024-2029 (%)
- Exhibits107: Chart on Geographic comparison
- Exhibits108: Data Table on Geographic comparison
- Exhibits109: Chart on North America - Market size and forecast 2024-2029 ($ million)
- Exhibits110: Data Table on North America - Market size and forecast 2024-2029 ($ million)
- Exhibits111: Chart on North America - Year-over-year growth 2024-2029 (%)
- Exhibits112: Data Table on North America - Year-over-year growth 2024-2029 (%)
- Exhibits113: Chart on Europe - Market size and forecast 2024-2029 ($ million)
- Exhibits114: Data Table on Europe - Market size and forecast 2024-2029 ($ million)
- Exhibits115: Chart on Europe - Year-over-year growth 2024-2029 (%)
- Exhibits116: Data Table on Europe - Year-over-year growth 2024-2029 (%)
- Exhibits117: Chart on APAC - Market size and forecast 2024-2029 ($ million)
- Exhibits118: Data Table on APAC - Market size and forecast 2024-2029 ($ million)
- Exhibits119: Chart on APAC - Year-over-year growth 2024-2029 (%)
- Exhibits120: Data Table on APAC - Year-over-year growth 2024-2029 (%)
- Exhibits121: Chart on Middle East and Africa - Market size and forecast 2024-2029 ($ million)
- Exhibits122: Data Table on Middle East and Africa - Market size and forecast 2024-2029 ($ million)
- Exhibits123: Chart on Middle East and Africa - Year-over-year growth 2024-2029 (%)
- Exhibits124: Data Table on Middle East and Africa - Year-over-year growth 2024-2029 (%)
- Exhibits125: Chart on South America - Market size and forecast 2024-2029 ($ million)
- Exhibits126: Data Table on South America - Market size and forecast 2024-2029 ($ million)
- Exhibits127: Chart on South America - Year-over-year growth 2024-2029 (%)
- Exhibits128: Data Table on South America - Year-over-year growth 2024-2029 (%)
- Exhibits129: Chart on US - Market size and forecast 2024-2029 ($ million)
- Exhibits130: Data Table on US - Market size and forecast 2024-2029 ($ million)
- Exhibits131: Chart on US - Year-over-year growth 2024-2029 (%)
- Exhibits132: Data Table on US - Year-over-year growth 2024-2029 (%)
- Exhibits133: Chart on UK - Market size and forecast 2024-2029 ($ million)
- Exhibits134: Data Table on UK - Market size and forecast 2024-2029 ($ million)
- Exhibits135: Chart on UK - Year-over-year growth 2024-2029 (%)
- Exhibits136: Data Table on UK - Year-over-year growth 2024-2029 (%)
- Exhibits137: Chart on Canada - Market size and forecast 2024-2029 ($ million)
- Exhibits138: Data Table on Canada - Market size and forecast 2024-2029 ($ million)
- Exhibits139: Chart on Canada - Year-over-year growth 2024-2029 (%)
- Exhibits140: Data Table on Canada - Year-over-year growth 2024-2029 (%)
- Exhibits141: Chart on China - Market size and forecast 2024-2029 ($ million)
- Exhibits142: Data Table on China - Market size and forecast 2024-2029 ($ million)
- Exhibits143: Chart on China - Year-over-year growth 2024-2029 (%)
- Exhibits144: Data Table on China - Year-over-year growth 2024-2029 (%)
- Exhibits145: Chart on Germany - Market size and forecast 2024-2029 ($ million)
- Exhibits146: Data Table on Germany - Market size and forecast 2024-2029 ($ million)
- Exhibits147: Chart on Germany - Year-over-year growth 2024-2029 (%)
- Exhibits148: Data Table on Germany - Year-over-year growth 2024-2029 (%)
- Exhibits149: Chart on Australia - Market size and forecast 2024-2029 ($ million)
- Exhibits150: Data Table on Australia - Market size and forecast 2024-2029 ($ million)
- Exhibits151: Chart on Australia - Year-over-year growth 2024-2029 (%)
- Exhibits152: Data Table on Australia - Year-over-year growth 2024-2029 (%)
- Exhibits153: Chart on France - Market size and forecast 2024-2029 ($ million)
- Exhibits154: Data Table on France - Market size and forecast 2024-2029 ($ million)
- Exhibits155: Chart on France - Year-over-year growth 2024-2029 (%)
- Exhibits156: Data Table on France - Year-over-year growth 2024-2029 (%)
- Exhibits157: Chart on Japan - Market size and forecast 2024-2029 ($ million)
- Exhibits158: Data Table on Japan - Market size and forecast 2024-2029 ($ million)
- Exhibits159: Chart on Japan - Year-over-year growth 2024-2029 (%)
- Exhibits160: Data Table on Japan - Year-over-year growth 2024-2029 (%)
- Exhibits161: Chart on Italy - Market size and forecast 2024-2029 ($ million)
- Exhibits162: Data Table on Italy - Market size and forecast 2024-2029 ($ million)
- Exhibits163: Chart on Italy - Year-over-year growth 2024-2029 (%)
- Exhibits164: Data Table on Italy - Year-over-year growth 2024-2029 (%)
- Exhibits165: Chart on South Korea - Market size and forecast 2024-2029 ($ million)
- Exhibits166: Data Table on South Korea - Market size and forecast 2024-2029 ($ million)
- Exhibits167: Chart on South Korea - Year-over-year growth 2024-2029 (%)
- Exhibits168: Data Table on South Korea - Year-over-year growth 2024-2029 (%)
- Exhibits169: Market opportunity By Geographical Landscape ($ million)
- Exhibits170: Data Tables on Market opportunity By Geographical Landscape ($ million)
- Exhibits171: Impact of drivers and challenges in 2024 and 2029
- Exhibits172: Overview on criticality of inputs and factors of differentiation
- Exhibits173: Overview on factors of disruption
- Exhibits174: Impact of key risks on business
- Exhibits175: Companies covered
- Exhibits176: Company ranking index
- Exhibits177: Matrix on companies position and classification
- Exhibits178: Advance Carts Inc. - Overview
- Exhibits179: Advance Carts Inc. - Product / Service
- Exhibits180: Advance Carts Inc. - Key offerings
- Exhibits181: SWOT
- Exhibits182: Americana Co. - Overview
- Exhibits183: Americana Co. - Product / Service
- Exhibits184: Americana Co. - Key offerings
- Exhibits185: SWOT
- Exhibits186: Changshu Jinsheng Metal Products Factory - Overview
- Exhibits187: Changshu Jinsheng Metal Products Factory - Product / Service
- Exhibits188: Changshu Jinsheng Metal Products Factory - Key offerings
- Exhibits189: SWOT
- Exhibits190: Changshu Whale Metal Products Co. Ltd. - Overview
- Exhibits191: Changshu Whale Metal Products Co. Ltd. - Product / Service
- Exhibits192: Changshu Whale Metal Products Co. Ltd. - Key offerings
- Exhibits193: SWOT
- Exhibits194: Changshu Yirunda Business Equipment Factory - Overview
- Exhibits195: Changshu Yirunda Business Equipment Factory - Product / Service
- Exhibits196: Changshu Yirunda Business Equipment Factory - Key offerings
- Exhibits197: SWOT
- Exhibits198: CREACIONES MARSANZ S.A - Overview
- Exhibits199: CREACIONES MARSANZ S.A - Product / Service
- Exhibits200: CREACIONES MARSANZ S.A - Key offerings
- Exhibits201: SWOT
- Exhibits202: Foshan Yongchuangyi Shelf Manufacturing Co. Ltd. - Overview
- Exhibits203: Foshan Yongchuangyi Shelf Manufacturing Co. Ltd. - Product / Service
- Exhibits204: Foshan Yongchuangyi Shelf Manufacturing Co. Ltd. - Key offerings
- Exhibits205: SWOT
- Exhibits206: Kailiou Commercial Equipment Co. Ltd. - Overview
- Exhibits207: Kailiou Commercial Equipment Co. Ltd. - Product / Service
- Exhibits208: Kailiou Commercial Equipment Co. Ltd. - Key offerings
- Exhibits209: SWOT
- Exhibits210: National Cart Co. - Overview
- Exhibits211: National Cart Co. - Product / Service
- Exhibits212: National Cart Co. - Key offerings
- Exhibits213: SWOT
- Exhibits214: R.W. Rogers Co. - Overview
- Exhibits215: R.W. Rogers Co. - Product / Service
- Exhibits216: R.W. Rogers Co. - Key offerings
- Exhibits217: SWOT
- Exhibits218: Sambo Corp. - Overview
- Exhibits219: Sambo Corp. - Product / Service
- Exhibits220: Sambo Corp. - Key offerings
- Exhibits221: SWOT
- Exhibits222: The Peggs Co. Inc. - Overview
- Exhibits223: The Peggs Co. Inc. - Product / Service
- Exhibits224: The Peggs Co. Inc. - Key offerings
- Exhibits225: SWOT
- Exhibits226: Unarco Industries LLC - Overview
- Exhibits227: Unarco Industries LLC - Product / Service
- Exhibits228: Unarco Industries LLC - Key offerings
- Exhibits229: SWOT
- Exhibits230: Van Keulen Interieurbouw BV - Overview
- Exhibits231: Van Keulen Interieurbouw BV - Product / Service
- Exhibits232: Van Keulen Interieurbouw BV - Key offerings
- Exhibits233: SWOT
- Exhibits234: Versacart Systems Inc. - Overview
- Exhibits235: Versacart Systems Inc. - Product / Service
- Exhibits236: Versacart Systems Inc. - Key offerings
- Exhibits237: SWOT
- Exhibits238: Inclusions checklist
- Exhibits239: Exclusions checklist
- Exhibits240: Currency conversion rates for US$
- Exhibits241: Research methodology
- Exhibits242: Information sources
- Exhibits243: Data validation
- Exhibits244: Validation techniques employed for market sizing
- Exhibits245: Data synthesis
- Exhibits246: 360 degree market analysis
- Exhibits247: List of abbreviations
The consumer shopping cart market is forecasted to grow by USD 132.2 mn during 2024-2029, accelerating at a CAGR of 2.7% during the forecast period. The report on the consumer shopping cart market provides a holistic analysis, market size and forecast, trends, growth drivers, and challenges, as well as vendor analysis covering around 25 vendors.
The report offers an up-to-date analysis regarding the current market scenario, the latest trends and drivers, and the overall market environment. The market is driven by expansion of retail sector worldwide, consumer preferences and experience enhancement through shopping carts, and increasing availability of hybrid shopping carts.
| Market Scope | |
|---|---|
| Base Year | 2025 |
| End Year | 2029 |
| Series Year | 2025-2029 |
| Growth Momentum | Accelerate |
| YOY 2025 | 2.6% |
| CAGR | 2.7% |
| Incremental Value | $132.2 mn |
The study was conducted using an objective combination of primary and secondary information including inputs from key participants in the industry. The report contains a comprehensive market size data, segment with regional analysis and vendor landscape in addition to an analysis of the key companies. Reports have historic and forecast data.
Technavio's consumer shopping cart market is segmented as below:
By Product
- Steel carts
- Plastic carts
- Others
By Distribution Channel
- Direct sales
- Distributors
By Type
- Traditional shopping carts
- Smart shopping carts
By Product Type
- Roller basket
- Child cart
- Others
By Geographical Landscape
- North America
- Europe
- APAC
- Middle East and Africa
- South America
This study identifies the emergence of smart shopping carts as one of the prime reasons driving the consumer shopping cart market growth during the next few years. Also, increasing number of startups entering market and using eco-friendly materials in shopping carts will lead to sizable demand in the market.
The report on the consumer shopping cart market covers the following areas:
- Consumer Shopping Cart Market sizing
- Consumer Shopping Cart Market forecast
- Consumer Shopping Cart Market industry analysis
The robust vendor analysis is designed to help clients improve their market position, and in line with this, this report provides a detailed analysis of several leading consumer shopping cart market vendors that include Advance Carts Inc., Americana Co., Bemis retail Solutions, Changshu Jinsheng Metal Products Factory, Changshu Whale Metal Products Co. Ltd., Changshu Yirunda Business Equipment Factory, CREACIONES MARSANZ S.A, Foshan Yongchuangyi Shelf Manufacturing Co. Ltd., Kailiou Commercial Equipment Co. Ltd., National Cart Co., R.W. Rogers Co., Sambo Corp., Shanghai Rongxin PetProduct Co. Ltd., The Peggs Co. Inc., Unarco Industries LLC, Van Keulen Interieurbouw BV, Versacart Systems Inc., and Wanzl GmbH and Co. KGaA. Also, the consumer shopping cart market analysis report includes information on upcoming trends and challenges that will influence market growth. This is to help companies strategize and leverage all forthcoming growth opportunities.
The publisher presents a detailed picture of the market by the way of study, synthesis, and summation of data from multiple sources by an analysis of key parameters such as profit, pricing, competition, and promotions. It presents various market facets by identifying the key industry influencers. The data presented is comprehensive, reliable, and a result of extensive primary and secondary research. The market research reports provide a complete competitive landscape and an in-depth vendor selection methodology and analysis using qualitative and quantitative research to forecast accurate market growth.
Table of Contents
1 Executive Summary
- 1.1 Market overview
- Executive Summary - Chart on Market Overview
- Executive Summary - Data Table on Market Overview
- Executive Summary - Chart on Global Market Characteristics
- Executive Summary - Chart on Market By Geographical Landscape
- Executive Summary - Chart on Market Segmentation by Product
- Executive Summary - Chart on Market Segmentation by Distribution Channel
- Executive Summary - Chart on Market Segmentation by Type
- Executive Summary - Chart on Market Segmentation by Product Type
- Executive Summary - Chart on Incremental Growth
- Executive Summary - Data Table on Incremental Growth
- Executive Summary - Chart on Company Market Positioning
2 Technavio Analysis
- 2.1 Analysis of price sensitivity, lifecycle, customer purchase basket, adoption rates, and purchase criteria
- Analysis of price sensitivity, lifecycle, customer purchase basket, adoption rates, and purchase criteria
- 2.2 Criticality of inputs and Factors of differentiation
- Overview on criticality of inputs and factors of differentiation
- 2.3 Factors of disruption
- Overview on factors of disruption
- 2.4 Impact of drivers and challenges
- Impact of drivers and challenges in 2024 and 2029
3 Market Landscape
- 3.1 Market ecosystem
- Parent Market
- Data Table on - Parent Market
- 3.2 Market characteristics
- Market characteristics analysis
- 3.3 Value chain analysis
- Value chain analysis
4 Market Sizing
- 4.1 Market definition
- Offerings of companies included in the market definition
- 4.2 Market segment analysis
- Market segments
- 4.3 Market size 2024
- 4.4 Market outlook: Forecast for 2024-2029
- Chart on Global - Market size and forecast 2024-2029 ($ million)
- Data Table on Global - Market size and forecast 2024-2029 ($ million)
- Chart on Global Market: Year-over-year growth 2024-2029 (%)
- Data Table on Global Market: Year-over-year growth 2024-2029 (%)
5 Historic Market Size
- 5.1 Global Consumer Shopping Cart Market 2019 - 2023
- Historic Market Size - Data Table on Global Consumer Shopping Cart Market 2019 - 2023 ($ million)
- 5.2 Product segment analysis 2019 - 2023
- Historic Market Size - Product Segment 2019 - 2023 ($ million)
- 5.3 Distribution Channel segment analysis 2019 - 2023
- Historic Market Size - Distribution Channel Segment 2019 - 2023 ($ million)
- 5.4 Type segment analysis 2019 - 2023
- Historic Market Size - Type Segment 2019 - 2023 ($ million)
- 5.5 Product Type segment analysis 2019 - 2023
- Historic Market Size - Product Type Segment 2019 - 2023 ($ million)
- 5.6 Geography segment analysis 2019 - 2023
- Historic Market Size - Geography Segment 2019 - 2023 ($ million)
- 5.7 Country segment analysis 2019 - 2023
- Historic Market Size - Country Segment 2019 - 2023 ($ million)
6 Qualitative Analysis
- 6.1 The AI impact on Global Consumer Shopping Cart Market
7 Five Forces Analysis
- 7.1 Five forces summary
- Five forces analysis - Comparison between 2024 and 2029
- 7.2 Bargaining power of buyers
- Bargaining power of buyers - Impact of key factors 2024 and 2029
- 7.3 Bargaining power of suppliers
- Bargaining power of suppliers - Impact of key factors in 2024 and 2029
- 7.4 Threat of new entrants
- Threat of new entrants - Impact of key factors in 2024 and 2029
- 7.5 Threat of substitutes
- Threat of substitutes - Impact of key factors in 2024 and 2029
- 7.6 Threat of rivalry
- Threat of rivalry - Impact of key factors in 2024 and 2029
- 7.7 Market condition
- Chart on Market condition - Five forces 2024 and 2029
8 Market Segmentation by Product
- 8.1 Market segments
- Chart on Product - Market share 2024-2029 (%)
- Data Table on Product - Market share 2024-2029 (%)
- 8.2 Comparison by Product
- Chart on Comparison by Product
- Data Table on Comparison by Product
- 8.3 Steel carts - Market size and forecast 2024-2029
- Chart on Steel carts - Market size and forecast 2024-2029 ($ million)
- Data Table on Steel carts - Market size and forecast 2024-2029 ($ million)
- Chart on Steel carts - Year-over-year growth 2024-2029 (%)
- Data Table on Steel carts - Year-over-year growth 2024-2029 (%)
- 8.4 Plastic carts - Market size and forecast 2024-2029
- Chart on Plastic carts - Market size and forecast 2024-2029 ($ million)
- Data Table on Plastic carts - Market size and forecast 2024-2029 ($ million)
- Chart on Plastic carts - Year-over-year growth 2024-2029 (%)
- Data Table on Plastic carts - Year-over-year growth 2024-2029 (%)
- 8.5 Others - Market size and forecast 2024-2029
- Chart on Others - Market size and forecast 2024-2029 ($ million)
- Data Table on Others - Market size and forecast 2024-2029 ($ million)
- Chart on Others - Year-over-year growth 2024-2029 (%)
- Data Table on Others - Year-over-year growth 2024-2029 (%)
- 8.6 Market opportunity by Product
- Market opportunity by Product ($ million)
- Data Table on Market opportunity by Product ($ million)
9 Market Segmentation by Distribution Channel
- 9.1 Market segments
- Chart on Distribution Channel - Market share 2024-2029 (%)
- Data Table on Distribution Channel - Market share 2024-2029 (%)
- 9.2 Comparison by Distribution Channel
- Chart on Comparison by Distribution Channel
- Data Table on Comparison by Distribution Channel
- 9.3 Direct sales - Market size and forecast 2024-2029
- Chart on Direct sales - Market size and forecast 2024-2029 ($ million)
- Data Table on Direct sales - Market size and forecast 2024-2029 ($ million)
- Chart on Direct sales - Year-over-year growth 2024-2029 (%)
- Data Table on Direct sales - Year-over-year growth 2024-2029 (%)
- 9.4 Distributors - Market size and forecast 2024-2029
- Chart on Distributors - Market size and forecast 2024-2029 ($ million)
- Data Table on Distributors - Market size and forecast 2024-2029 ($ million)
- Chart on Distributors - Year-over-year growth 2024-2029 (%)
- Data Table on Distributors - Year-over-year growth 2024-2029 (%)
- 9.5 Market opportunity by Distribution Channel
- Market opportunity by Distribution Channel ($ million)
- Data Table on Market opportunity by Distribution Channel ($ million)
10 Market Segmentation by Type
- 10.1 Market segments
- Chart on Type - Market share 2024-2029 (%)
- Data Table on Type - Market share 2024-2029 (%)
- 10.2 Comparison by Type
- Chart on Comparison by Type
- Data Table on Comparison by Type
- 10.3 Traditional shopping carts - Market size and forecast 2024-2029
- Chart on Traditional shopping carts - Market size and forecast 2024-2029 ($ million)
- Data Table on Traditional shopping carts - Market size and forecast 2024-2029 ($ million)
- Chart on Traditional shopping carts - Year-over-year growth 2024-2029 (%)
- Data Table on Traditional shopping carts - Year-over-year growth 2024-2029 (%)
- 10.4 Smart shopping carts - Market size and forecast 2024-2029
- Chart on Smart shopping carts - Market size and forecast 2024-2029 ($ million)
- Data Table on Smart shopping carts - Market size and forecast 2024-2029 ($ million)
- Chart on Smart shopping carts - Year-over-year growth 2024-2029 (%)
- Data Table on Smart shopping carts - Year-over-year growth 2024-2029 (%)
- 10.5 Market opportunity by Type
- Market opportunity by Type ($ million)
- Data Table on Market opportunity by Type ($ million)
11 Market Segmentation by Product Type
- 11.1 Market segments
- Chart on Product Type - Market share 2024-2029 (%)
- Data Table on Product Type - Market share 2024-2029 (%)
- 11.2 Comparison by Product Type
- Chart on Comparison by Product Type
- Data Table on Comparison by Product Type
- 11.3 Roller basket - Market size and forecast 2024-2029
- Chart on Roller basket - Market size and forecast 2024-2029 ($ million)
- Data Table on Roller basket - Market size and forecast 2024-2029 ($ million)
- Chart on Roller basket - Year-over-year growth 2024-2029 (%)
- Data Table on Roller basket - Year-over-year growth 2024-2029 (%)
- 11.4 Child cart - Market size and forecast 2024-2029
- Chart on Child cart - Market size and forecast 2024-2029 ($ million)
- Data Table on Child cart - Market size and forecast 2024-2029 ($ million)
- Chart on Child cart - Year-over-year growth 2024-2029 (%)
- Data Table on Child cart - Year-over-year growth 2024-2029 (%)
- 11.5 Others - Market size and forecast 2024-2029
- Chart on Others - Market size and forecast 2024-2029 ($ million)
- Data Table on Others - Market size and forecast 2024-2029 ($ million)
- Chart on Others - Year-over-year growth 2024-2029 (%)
- Data Table on Others - Year-over-year growth 2024-2029 (%)
- 11.6 Market opportunity by Product Type
- Market opportunity by Product Type ($ million)
- Data Table on Market opportunity by Product Type ($ million)
12 Customer Landscape
- 12.1 Customer landscape overview
- Analysis of price sensitivity, lifecycle, customer purchase basket, adoption rates, and purchase criteria
13 Geographic Landscape
- 13.1 Geographic segmentation
- Chart on Market share By Geographical Landscape 2024-2029 (%)
- Data Table on Market share By Geographical Landscape 2024-2029 (%)
- 13.2 Geographic comparison
- Chart on Geographic comparison
- Data Table on Geographic comparison
- 13.3 North America - Market size and forecast 2024-2029
- Chart on North America - Market size and forecast 2024-2029 ($ million)
- Data Table on North America - Market size and forecast 2024-2029 ($ million)
- Chart on North America - Year-over-year growth 2024-2029 (%)
- Data Table on North America - Year-over-year growth 2024-2029 (%)
- 13.4 Europe - Market size and forecast 2024-2029
- Chart on Europe - Market size and forecast 2024-2029 ($ million)
- Data Table on Europe - Market size and forecast 2024-2029 ($ million)
- Chart on Europe - Year-over-year growth 2024-2029 (%)
- Data Table on Europe - Year-over-year growth 2024-2029 (%)
- 13.5 APAC - Market size and forecast 2024-2029
- Chart on APAC - Market size and forecast 2024-2029 ($ million)
- Data Table on APAC - Market size and forecast 2024-2029 ($ million)
- Chart on APAC - Year-over-year growth 2024-2029 (%)
- Data Table on APAC - Year-over-year growth 2024-2029 (%)
- 13.6 Middle East and Africa - Market size and forecast 2024-2029
- Chart on Middle East and Africa - Market size and forecast 2024-2029 ($ million)
- Data Table on Middle East and Africa - Market size and forecast 2024-2029 ($ million)
- Chart on Middle East and Africa - Year-over-year growth 2024-2029 (%)
- Data Table on Middle East and Africa - Year-over-year growth 2024-2029 (%)
- 13.7 South America - Market size and forecast 2024-2029
- Chart on South America - Market size and forecast 2024-2029 ($ million)
- Data Table on South America - Market size and forecast 2024-2029 ($ million)
- Chart on South America - Year-over-year growth 2024-2029 (%)
- Data Table on South America - Year-over-year growth 2024-2029 (%)
- 13.8 US - Market size and forecast 2024-2029
- Chart on US - Market size and forecast 2024-2029 ($ million)
- Data Table on US - Market size and forecast 2024-2029 ($ million)
- Chart on US - Year-over-year growth 2024-2029 (%)
- Data Table on US - Year-over-year growth 2024-2029 (%)
- 13.9 UK - Market size and forecast 2024-2029
- Chart on UK - Market size and forecast 2024-2029 ($ million)
- Data Table on UK - Market size and forecast 2024-2029 ($ million)
- Chart on UK - Year-over-year growth 2024-2029 (%)
- Data Table on UK - Year-over-year growth 2024-2029 (%)
- 13.10 Canada - Market size and forecast 2024-2029
- Chart on Canada - Market size and forecast 2024-2029 ($ million)
- Data Table on Canada - Market size and forecast 2024-2029 ($ million)
- Chart on Canada - Year-over-year growth 2024-2029 (%)
- Data Table on Canada - Year-over-year growth 2024-2029 (%)
- 13.11 China - Market size and forecast 2024-2029
- Chart on China - Market size and forecast 2024-2029 ($ million)
- Data Table on China - Market size and forecast 2024-2029 ($ million)
- Chart on China - Year-over-year growth 2024-2029 (%)
- Data Table on China - Year-over-year growth 2024-2029 (%)
- 13.12 Germany - Market size and forecast 2024-2029
- Chart on Germany - Market size and forecast 2024-2029 ($ million)
- Data Table on Germany - Market size and forecast 2024-2029 ($ million)
- Chart on Germany - Year-over-year growth 2024-2029 (%)
- Data Table on Germany - Year-over-year growth 2024-2029 (%)
- 13.13 Australia - Market size and forecast 2024-2029
- Chart on Australia - Market size and forecast 2024-2029 ($ million)
- Data Table on Australia - Market size and forecast 2024-2029 ($ million)
- Chart on Australia - Year-over-year growth 2024-2029 (%)
- Data Table on Australia - Year-over-year growth 2024-2029 (%)
- 13.14 France - Market size and forecast 2024-2029
- Chart on France - Market size and forecast 2024-2029 ($ million)
- Data Table on France - Market size and forecast 2024-2029 ($ million)
- Chart on France - Year-over-year growth 2024-2029 (%)
- Data Table on France - Year-over-year growth 2024-2029 (%)
- 13.15 Japan - Market size and forecast 2024-2029
- Chart on Japan - Market size and forecast 2024-2029 ($ million)
- Data Table on Japan - Market size and forecast 2024-2029 ($ million)
- Chart on Japan - Year-over-year growth 2024-2029 (%)
- Data Table on Japan - Year-over-year growth 2024-2029 (%)
- 13.16 Italy - Market size and forecast 2024-2029
- Chart on Italy - Market size and forecast 2024-2029 ($ million)
- Data Table on Italy - Market size and forecast 2024-2029 ($ million)
- Chart on Italy - Year-over-year growth 2024-2029 (%)
- Data Table on Italy - Year-over-year growth 2024-2029 (%)
- 13.17 South Korea - Market size and forecast 2024-2029
- Chart on South Korea - Market size and forecast 2024-2029 ($ million)
- Data Table on South Korea - Market size and forecast 2024-2029 ($ million)
- Chart on South Korea - Year-over-year growth 2024-2029 (%)
- Data Table on South Korea - Year-over-year growth 2024-2029 (%)
- 13.18 Market opportunity By Geographical Landscape
- Market opportunity By Geographical Landscape ($ million)
- Data Tables on Market opportunity By Geographical Landscape ($ million)
14 Drivers, Challenges, and Opportunity/Restraints
- 14.1 Market drivers
- 14.2 Market challenges
- 14.3 Impact of drivers and challenges
- Impact of drivers and challenges in 2024 and 2029
- 14.4 Market opportunities/restraints
15 Competitive Landscape
- 15.1 Overview
- 15.2 Competitive Landscape
- Overview on criticality of inputs and factors of differentiation
- 15.3 Landscape disruption
- Overview on factors of disruption
- 15.4 Industry risks
- Impact of key risks on business
16 Competitive Analysis
- 16.1 Companies profiled
- Companies covered
- 16.2 Company ranking index
- Company ranking index
- 16.3 Market positioning of companies
- Matrix on companies position and classification
- 16.4 Advance Carts Inc.
- Advance Carts Inc. - Overview
- Advance Carts Inc. - Product / Service
- Advance Carts Inc. - Key offerings
- SWOT
- 16.5 Americana Co.
- Americana Co. - Overview
- Americana Co. - Product / Service
- Americana Co. - Key offerings
- SWOT
- 16.6 Changshu Jinsheng Metal Products Factory
- Changshu Jinsheng Metal Products Factory - Overview
- Changshu Jinsheng Metal Products Factory - Product / Service
- Changshu Jinsheng Metal Products Factory - Key offerings
- SWOT
- 16.7 Changshu Whale Metal Products Co. Ltd.
- Changshu Whale Metal Products Co. Ltd. - Overview
- Changshu Whale Metal Products Co. Ltd. - Product / Service
- Changshu Whale Metal Products Co. Ltd. - Key offerings
- SWOT
- 16.8 Changshu Yirunda Business Equipment Factory
- Changshu Yirunda Business Equipment Factory - Overview
- Changshu Yirunda Business Equipment Factory - Product / Service
- Changshu Yirunda Business Equipment Factory - Key offerings
- SWOT
- 16.9 CREACIONES MARSANZ S.A
- CREACIONES MARSANZ S.A - Overview
- CREACIONES MARSANZ S.A - Product / Service
- CREACIONES MARSANZ S.A - Key offerings
- SWOT
- 16.10 Foshan Yongchuangyi Shelf Manufacturing Co. Ltd.
- Foshan Yongchuangyi Shelf Manufacturing Co. Ltd. - Overview
- Foshan Yongchuangyi Shelf Manufacturing Co. Ltd. - Product / Service
- Foshan Yongchuangyi Shelf Manufacturing Co. Ltd. - Key offerings
- SWOT
- 16.11 Kailiou Commercial Equipment Co. Ltd.
- Kailiou Commercial Equipment Co. Ltd. - Overview
- Kailiou Commercial Equipment Co. Ltd. - Product / Service
- Kailiou Commercial Equipment Co. Ltd. - Key offerings
- SWOT
- 16.12 National Cart Co.
- National Cart Co. - Overview
- National Cart Co. - Product / Service
- National Cart Co. - Key offerings
- SWOT
- 16.13 R.W. Rogers Co.
- R.W. Rogers Co. - Overview
- R.W. Rogers Co. - Product / Service
- R.W. Rogers Co. - Key offerings
- SWOT
- 16.14 Sambo Corp.
- Sambo Corp. - Overview
- Sambo Corp. - Product / Service
- Sambo Corp. - Key offerings
- SWOT
- 16.15 The Peggs Co. Inc.
- The Peggs Co. Inc. - Overview
- The Peggs Co. Inc. - Product / Service
- The Peggs Co. Inc. - Key offerings
- SWOT
- 16.16 Unarco Industries LLC
- Unarco Industries LLC - Overview
- Unarco Industries LLC - Product / Service
- Unarco Industries LLC - Key offerings
- SWOT
- 16.17 Van Keulen Interieurbouw BV
- Van Keulen Interieurbouw BV - Overview
- Van Keulen Interieurbouw BV - Product / Service
- Van Keulen Interieurbouw BV - Key offerings
- SWOT
- 16.18 Versacart Systems Inc.
- Versacart Systems Inc. - Overview
- Versacart Systems Inc. - Product / Service
- Versacart Systems Inc. - Key offerings
- SWOT
17 Appendix
- 17.1 Scope of the report
- 17.2 Inclusions and exclusions checklist
- Inclusions checklist
- Exclusions checklist
- 17.3 Currency conversion rates for US$
- Currency conversion rates for US$
- 17.4 Research methodology
- Research methodology
- 17.5 Data procurement
- Information sources
- 17.6 Data validation
- Data validation
- 17.7 Validation techniques employed for market sizing
- Validation techniques employed for market sizing
- 17.8 Data synthesis
- Data synthesis
- 17.9 360 degree market analysis
- 360 degree market analysis
- 17.10 List of abbreviations
- List of abbreviations

