|
|
市場調査レポート
商品コード
1626778
翼状肉腫治療の世界市場 2025-2029年Global Ewings Sarcoma Treatment Market 2025-2029 |
||||||

|
|||||||
カスタマイズ可能
|
|||||||


| 翼状肉腫治療の世界市場 2025-2029年 |
|
出版日: 2024年12月19日
発行: TechNavio
ページ情報: 英文 197 Pages
納期: 即納可能
|

全表示
- 概要
- 図表
- 目次
翼状肉腫治療市場 2025-2029年
翼状肉腫治療市場は2024-2029年に1億8,130万米ドル、予測期間中のCAGRは5.6%で成長すると予測されます。当レポートでは、翼状肉腫治療市場の全体的な分析、市場規模・予測、動向、成長促進要因、課題、約25のベンダーを網羅したベンダー分析などを掲載しています。
現在の市場シナリオ、最新動向と促進要因、市場環境全体に関する最新分析を提供しています。この市場を牽引しているのは、翼状肉腫に対する認知度の向上と資金提供、翼状肉腫治療に対する規制上の優遇措置、財政支援プログラムや償還制度などです。
| 市場範囲 | |
|---|---|
| 基準年 | 2025 |
| 終了年 | 2029 |
| 予測期間 | 2025-2029 |
| 成長モメンタム | 加速 |
| 前年比2025年 | 5.3% |
| CAGR | 5.6% |
| 増分額 | 1億8,130万米ドル |
本調査では、今後数年間における翼状肉腫治療市場の成長を促進する主な理由の一つとして、再生療法の出現を挙げています。また、CRISPR-Cas9技術の出現と強力な研究助成金は、市場の大きな需要につながります。
目次
第1章 エグゼクティブサマリー
- 市場概要
第2章 Technavio別分析
- 価格・ライフサイクル・顧客購入バスケット・採用率・購入基準の分析
- インプットの重要性と差別化の要因
- 混乱の要因
- 促進要因と課題の影響
第3章 市場情勢
- 市場エコシステム
- 市場の特徴
- バリューチェーン分析
第4章 市場規模
- 市場の定義
- 市場セグメント分析
- 市場規模 2024
- 市場の見通し 2024-2029
第5章 市場規模実績
- 翼状肉腫治療の世界市場 2019-2023
- タイプ別セグメント分析 2019-2023
- エンドユーザー別セグメント分析 2019-2023
- 地域別セグメント分析 2019-2023
- 国別セグメント分析 2019-2023
第6章 定性分析
- AIの影響:翼状肉腫治療の世界市場
第7章 ファイブフォース分析
- ファイブフォースの要約
- 買い手の交渉力
- 供給企業の交渉力
- 新規参入業者の脅威
- 代替品の脅威
- 競争の脅威
- 市況
第8章 市場セグメンテーション:タイプ別
- 市場セグメント
- 比較:タイプ別
- 併用療法:市場規模と予測 2024-2029
- 単独療法:市場規模と予測 2024-2029
- 市場機会:タイプ別
第9章 市場セグメンテーション:エンドユーザー別
- 市場セグメント
- 比較:エンドユーザー別
- 病院:市場規模と予測 2024-2029
- 専門クリニック:市場規模と予測 2024-2029
- その他:市場規模と予測 2024-2029
- 市場機会:エンドユーザー別
第10章 顧客情勢
- 顧客情勢の概要
第11章 地域別情勢
- 地域別セグメンテーション
- 地域別比較
- 北米:市場規模と予測 2024-2029
- 欧州:市場規模と予測 2024-2029
- アジア:市場規模と予測 2024-2029
- 世界のその他の地域:市場規模と予測 2024-2029
- 米国:市場規模と予測 2024-2029
- カナダ:市場規模と予測 2024-2029
- 英国:市場規模と予測 2024-2029
- 中国:市場規模と予測 2024-2029
- ドイツ:市場規模と予測 2024-2029
- 日本:市場規模と予測 2024-2029
- インド:市場規模と予測 2024-2029
- 韓国:市場規模と予測 2024-2029
- フランス:市場規模と予測 2024-2029
- イタリア:市場規模と予測 2024-2029
- 市場機会:地域情勢別
第12章 促進要因・課題・機会・抑制要因
- 市場促進要因
- 市場の課題
- 促進要因と課題の影響
- 市場の機会・抑制要因
第13章 競合情勢
- 概要
- 競合情勢
- 混乱の状況
- 業界のリスク
第14章 競合分析
- 企業プロファイル
- 企業ランキング指数
- 企業の市場ポジショニング
- Advantech Co. Ltd.
- Amneal Pharmaceuticals Inc.
- Baxter International Inc.
- Bristol Myers Squibb Co.
- Cellectar Biosciences Inc.
- Daiichi Sankyo Co. Ltd.
- Eli Lilly and Co.
- Fresenius Kabi AG
- GlaxoSmithKline Plc
- Gradalis Inc.
- Johnson and Johnson Inc.
- Novartis AG
- Ocean pharmaceutical
- Pfizer Inc.
- PharmaMar SA
第15章 付録
Exhibits:
- Exhibits1: Executive Summary - Chart on Market Overview
- Exhibits2: Executive Summary - Data Table on Market Overview
- Exhibits3: Executive Summary - Chart on Global Market Characteristics
- Exhibits4: Executive Summary - Chart on Market By Geographical Landscape
- Exhibits5: Executive Summary - Chart on Market Segmentation by Type
- Exhibits6: Executive Summary - Chart on Market Segmentation by End-user
- Exhibits7: Executive Summary - Chart on Incremental Growth
- Exhibits8: Executive Summary - Data Table on Incremental Growth
- Exhibits9: Executive Summary - Chart on Company Market Positioning
- Exhibits10: Analysis of price sensitivity, lifecycle, customer purchase basket, adoption rates, and purchase criteria
- Exhibits11: Overview on criticality of inputs and factors of differentiation
- Exhibits12: Overview on factors of disruption
- Exhibits13: Impact of drivers and challenges in 2024 and 2029
- Exhibits14: Parent Market
- Exhibits15: Data Table on - Parent Market
- Exhibits16: Market characteristics analysis
- Exhibits17: Value chain analysis
- Exhibits18: Offerings of companies included in the market definition
- Exhibits19: Market segments
- Exhibits20: Chart on Global - Market size and forecast 2024-2029 ($ million)
- Exhibits21: Data Table on Global - Market size and forecast 2024-2029 ($ million)
- Exhibits22: Chart on Global Market: Year-over-year growth 2024-2029 (%)
- Exhibits23: Data Table on Global Market: Year-over-year growth 2024-2029 (%)
- Exhibits24: Historic Market Size - Data Table on Global Ewings Sarcoma Treatment Market 2019 - 2023 ($ million)
- Exhibits25: Historic Market Size - Type Segment 2019 - 2023 ($ million)
- Exhibits26: Historic Market Size - End-user Segment 2019 - 2023 ($ million)
- Exhibits27: Historic Market Size - Geography Segment 2019 - 2023 ($ million)
- Exhibits28: Historic Market Size - Country Segment 2019 - 2023 ($ million)
- Exhibits29: Five forces analysis - Comparison between 2024 and 2029
- Exhibits30: Bargaining power of buyers - Impact of key factors 2024 and 2029
- Exhibits31: Bargaining power of suppliers - Impact of key factors in 2024 and 2029
- Exhibits32: Threat of new entrants - Impact of key factors in 2024 and 2029
- Exhibits33: Threat of substitutes - Impact of key factors in 2024 and 2029
- Exhibits34: Threat of rivalry - Impact of key factors in 2024 and 2029
- Exhibits35: Chart on Market condition - Five forces 2024 and 2029
- Exhibits36: Chart on Type - Market share 2024-2029 (%)
- Exhibits37: Data Table on Type - Market share 2024-2029 (%)
- Exhibits38: Chart on Comparison by Type
- Exhibits39: Data Table on Comparison by Type
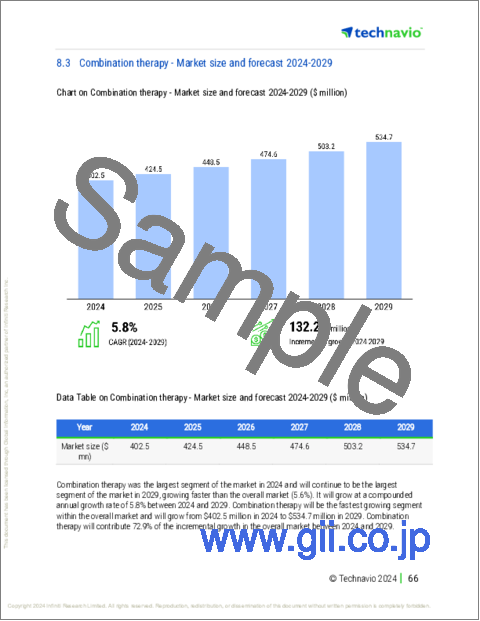
- Exhibits40: Chart on Combination therapy - Market size and forecast 2024-2029 ($ million)
- Exhibits41: Data Table on Combination therapy - Market size and forecast 2024-2029 ($ million)
- Exhibits42: Chart on Combination therapy - Year-over-year growth 2024-2029 (%)
- Exhibits43: Data Table on Combination therapy - Year-over-year growth 2024-2029 (%)
- Exhibits44: Chart on Monotherapy - Market size and forecast 2024-2029 ($ million)
- Exhibits45: Data Table on Monotherapy - Market size and forecast 2024-2029 ($ million)
- Exhibits46: Chart on Monotherapy - Year-over-year growth 2024-2029 (%)
- Exhibits47: Data Table on Monotherapy - Year-over-year growth 2024-2029 (%)
- Exhibits48: Market opportunity by Type ($ million)
- Exhibits49: Data Table on Market opportunity by Type ($ million)
- Exhibits50: Chart on End-user - Market share 2024-2029 (%)
- Exhibits51: Data Table on End-user - Market share 2024-2029 (%)
- Exhibits52: Chart on Comparison by End-user
- Exhibits53: Data Table on Comparison by End-user
- Exhibits54: Chart on Hospitals - Market size and forecast 2024-2029 ($ million)
- Exhibits55: Data Table on Hospitals - Market size and forecast 2024-2029 ($ million)
- Exhibits56: Chart on Hospitals - Year-over-year growth 2024-2029 (%)
- Exhibits57: Data Table on Hospitals - Year-over-year growth 2024-2029 (%)
- Exhibits58: Chart on Specialty clinics - Market size and forecast 2024-2029 ($ million)
- Exhibits59: Data Table on Specialty clinics - Market size and forecast 2024-2029 ($ million)
- Exhibits60: Chart on Specialty clinics - Year-over-year growth 2024-2029 (%)
- Exhibits61: Data Table on Specialty clinics - Year-over-year growth 2024-2029 (%)
- Exhibits62: Chart on Others - Market size and forecast 2024-2029 ($ million)
- Exhibits63: Data Table on Others - Market size and forecast 2024-2029 ($ million)
- Exhibits64: Chart on Others - Year-over-year growth 2024-2029 (%)
- Exhibits65: Data Table on Others - Year-over-year growth 2024-2029 (%)
- Exhibits66: Market opportunity by End-user ($ million)
- Exhibits67: Data Table on Market opportunity by End-user ($ million)
- Exhibits68: Analysis of price sensitivity, lifecycle, customer purchase basket, adoption rates, and purchase criteria
- Exhibits69: Chart on Market share By Geographical Landscape 2024-2029 (%)
- Exhibits70: Data Table on Market share By Geographical Landscape 2024-2029 (%)
- Exhibits71: Chart on Geographic comparison
- Exhibits72: Data Table on Geographic comparison
- Exhibits73: Chart on North America - Market size and forecast 2024-2029 ($ million)
- Exhibits74: Data Table on North America - Market size and forecast 2024-2029 ($ million)
- Exhibits75: Chart on North America - Year-over-year growth 2024-2029 (%)
- Exhibits76: Data Table on North America - Year-over-year growth 2024-2029 (%)
- Exhibits77: Chart on Europe - Market size and forecast 2024-2029 ($ million)
- Exhibits78: Data Table on Europe - Market size and forecast 2024-2029 ($ million)
- Exhibits79: Chart on Europe - Year-over-year growth 2024-2029 (%)
- Exhibits80: Data Table on Europe - Year-over-year growth 2024-2029 (%)
- Exhibits81: Chart on Asia - Market size and forecast 2024-2029 ($ million)
- Exhibits82: Data Table on Asia - Market size and forecast 2024-2029 ($ million)
- Exhibits83: Chart on Asia - Year-over-year growth 2024-2029 (%)
- Exhibits84: Data Table on Asia - Year-over-year growth 2024-2029 (%)
- Exhibits85: Chart on Rest of World (ROW) - Market size and forecast 2024-2029 ($ million)
- Exhibits86: Data Table on Rest of World (ROW) - Market size and forecast 2024-2029 ($ million)
- Exhibits87: Chart on Rest of World (ROW) - Year-over-year growth 2024-2029 (%)
- Exhibits88: Data Table on Rest of World (ROW) - Year-over-year growth 2024-2029 (%)
- Exhibits89: Chart on US - Market size and forecast 2024-2029 ($ million)
- Exhibits90: Data Table on US - Market size and forecast 2024-2029 ($ million)
- Exhibits91: Chart on US - Year-over-year growth 2024-2029 (%)
- Exhibits92: Data Table on US - Year-over-year growth 2024-2029 (%)
- Exhibits93: Chart on Canada - Market size and forecast 2024-2029 ($ million)
- Exhibits94: Data Table on Canada - Market size and forecast 2024-2029 ($ million)
- Exhibits95: Chart on Canada - Year-over-year growth 2024-2029 (%)
- Exhibits96: Data Table on Canada - Year-over-year growth 2024-2029 (%)
- Exhibits97: Chart on UK - Market size and forecast 2024-2029 ($ million)
- Exhibits98: Data Table on UK - Market size and forecast 2024-2029 ($ million)
- Exhibits99: Chart on UK - Year-over-year growth 2024-2029 (%)
- Exhibits100: Data Table on UK - Year-over-year growth 2024-2029 (%)
- Exhibits101: Chart on China - Market size and forecast 2024-2029 ($ million)
- Exhibits102: Data Table on China - Market size and forecast 2024-2029 ($ million)
- Exhibits103: Chart on China - Year-over-year growth 2024-2029 (%)
- Exhibits104: Data Table on China - Year-over-year growth 2024-2029 (%)
- Exhibits105: Chart on Germany - Market size and forecast 2024-2029 ($ million)
- Exhibits106: Data Table on Germany - Market size and forecast 2024-2029 ($ million)
- Exhibits107: Chart on Germany - Year-over-year growth 2024-2029 (%)
- Exhibits108: Data Table on Germany - Year-over-year growth 2024-2029 (%)
- Exhibits109: Chart on Japan - Market size and forecast 2024-2029 ($ million)
- Exhibits110: Data Table on Japan - Market size and forecast 2024-2029 ($ million)
- Exhibits111: Chart on Japan - Year-over-year growth 2024-2029 (%)
- Exhibits112: Data Table on Japan - Year-over-year growth 2024-2029 (%)
- Exhibits113: Chart on India - Market size and forecast 2024-2029 ($ million)
- Exhibits114: Data Table on India - Market size and forecast 2024-2029 ($ million)
- Exhibits115: Chart on India - Year-over-year growth 2024-2029 (%)
- Exhibits116: Data Table on India - Year-over-year growth 2024-2029 (%)
- Exhibits117: Chart on South Korea - Market size and forecast 2024-2029 ($ million)
- Exhibits118: Data Table on South Korea - Market size and forecast 2024-2029 ($ million)
- Exhibits119: Chart on South Korea - Year-over-year growth 2024-2029 (%)
- Exhibits120: Data Table on South Korea - Year-over-year growth 2024-2029 (%)
- Exhibits121: Chart on France - Market size and forecast 2024-2029 ($ million)
- Exhibits122: Data Table on France - Market size and forecast 2024-2029 ($ million)
- Exhibits123: Chart on France - Year-over-year growth 2024-2029 (%)
- Exhibits124: Data Table on France - Year-over-year growth 2024-2029 (%)
- Exhibits125: Chart on Italy - Market size and forecast 2024-2029 ($ million)
- Exhibits126: Data Table on Italy - Market size and forecast 2024-2029 ($ million)
- Exhibits127: Chart on Italy - Year-over-year growth 2024-2029 (%)
- Exhibits128: Data Table on Italy - Year-over-year growth 2024-2029 (%)
- Exhibits129: Market opportunity By Geographical Landscape ($ million)
- Exhibits130: Data Tables on Market opportunity By Geographical Landscape ($ million)
- Exhibits131: Impact of drivers and challenges in 2024 and 2029
- Exhibits132: Overview on criticality of inputs and factors of differentiation
- Exhibits133: Overview on factors of disruption
- Exhibits134: Impact of key risks on business
- Exhibits135: Companies covered
- Exhibits136: Company ranking index
- Exhibits137: Matrix on companies position and classification
- Exhibits138: Advantech Co. Ltd. - Overview
- Exhibits139: Advantech Co. Ltd. - Business segments
- Exhibits140: Advantech Co. Ltd. - Key news
- Exhibits141: Advantech Co. Ltd. - Key offerings
- Exhibits142: Advantech Co. Ltd. - Segment focus
- Exhibits143: SWOT
- Exhibits144: Amneal Pharmaceuticals Inc. - Overview
- Exhibits145: Amneal Pharmaceuticals Inc. - Business segments
- Exhibits146: Amneal Pharmaceuticals Inc. - Key news
- Exhibits147: Amneal Pharmaceuticals Inc. - Key offerings
- Exhibits148: Amneal Pharmaceuticals Inc. - Segment focus
- Exhibits149: SWOT
- Exhibits150: Baxter International Inc. - Overview
- Exhibits151: Baxter International Inc. - Business segments
- Exhibits152: Baxter International Inc. - Key news
- Exhibits153: Baxter International Inc. - Key offerings
- Exhibits154: Baxter International Inc. - Segment focus
- Exhibits155: SWOT
- Exhibits156: Bristol Myers Squibb Co. - Overview
- Exhibits157: Bristol Myers Squibb Co. - Product / Service
- Exhibits158: Bristol Myers Squibb Co. - Key news
- Exhibits159: Bristol Myers Squibb Co. - Key offerings
- Exhibits160: SWOT
- Exhibits161: Cellectar Biosciences Inc. - Overview
- Exhibits162: Cellectar Biosciences Inc. - Product / Service
- Exhibits163: Cellectar Biosciences Inc. - Key offerings
- Exhibits164: SWOT
- Exhibits165: Daiichi Sankyo Co. Ltd. - Overview
- Exhibits166: Daiichi Sankyo Co. Ltd. - Product / Service
- Exhibits167: Daiichi Sankyo Co. Ltd. - Key news
- Exhibits168: Daiichi Sankyo Co. Ltd. - Key offerings
- Exhibits169: SWOT
- Exhibits170: Eli Lilly and Co. - Overview
- Exhibits171: Eli Lilly and Co. - Product / Service
- Exhibits172: Eli Lilly and Co. - Key offerings
- Exhibits173: SWOT
- Exhibits174: Fresenius Kabi AG - Overview
- Exhibits175: Fresenius Kabi AG - Product / Service
- Exhibits176: Fresenius Kabi AG - Key offerings
- Exhibits177: SWOT
- Exhibits178: GlaxoSmithKline Plc - Overview
- Exhibits179: GlaxoSmithKline Plc - Business segments
- Exhibits180: GlaxoSmithKline Plc - Key news
- Exhibits181: GlaxoSmithKline Plc - Key offerings
- Exhibits182: GlaxoSmithKline Plc - Segment focus
- Exhibits183: SWOT
- Exhibits184: Gradalis Inc. - Overview
- Exhibits185: Gradalis Inc. - Product / Service
- Exhibits186: Gradalis Inc. - Key offerings
- Exhibits187: SWOT
- Exhibits188: Johnson and Johnson Inc. - Overview
- Exhibits189: Johnson and Johnson Inc. - Business segments
- Exhibits190: Johnson and Johnson Inc. - Key news
- Exhibits191: Johnson and Johnson Inc. - Key offerings
- Exhibits192: Johnson and Johnson Inc. - Segment focus
- Exhibits193: SWOT
- Exhibits194: Novartis AG - Overview
- Exhibits195: Novartis AG - Business segments
- Exhibits196: Novartis AG - Key news
- Exhibits197: Novartis AG - Key offerings
- Exhibits198: Novartis AG - Segment focus
- Exhibits199: SWOT
- Exhibits200: Ocean pharmaceutical - Overview
- Exhibits201: Ocean pharmaceutical - Product / Service
- Exhibits202: Ocean pharmaceutical - Key offerings
- Exhibits203: SWOT
- Exhibits204: Pfizer Inc. - Overview
- Exhibits205: Pfizer Inc. - Product / Service
- Exhibits206: Pfizer Inc. - Key news
- Exhibits207: Pfizer Inc. - Key offerings
- Exhibits208: SWOT
- Exhibits209: PharmaMar SA - Overview
- Exhibits210: PharmaMar SA - Business segments
- Exhibits211: PharmaMar SA - Key offerings
- Exhibits212: PharmaMar SA - Segment focus
- Exhibits213: SWOT
- Exhibits214: Inclusions checklist
- Exhibits215: Exclusions checklist
- Exhibits216: Currency conversion rates for US$
- Exhibits217: Research methodology
- Exhibits218: Information sources
- Exhibits219: Data validation
- Exhibits220: Validation techniques employed for market sizing
- Exhibits221: Data synthesis
- Exhibits222: 360 degree market analysis
- Exhibits223: List of abbreviations
Ewings Sarcoma Treatment Market 2025-2029
The ewings sarcoma treatment market is forecasted to grow by USD 181.3 mn during 2024-2029, accelerating at a CAGR of 5.6% during the forecast period. The report on the ewings sarcoma treatment market provides a holistic analysis, market size and forecast, trends, growth drivers, and challenges, as well as vendor analysis covering around 25 vendors.
The report offers an up-to-date analysis regarding the current market scenario, the latest trends and drivers, and the overall market environment. The market is driven by growing awareness about and funding for ewings sarcoma, regulatory incentives for ewings sarcoma treatment, and financial assistance programs and reimbursement schemes.
| Market Scope | |
|---|---|
| Base Year | 2025 |
| End Year | 2029 |
| Series Year | 2025-2029 |
| Growth Momentum | Accelerate |
| YOY 2025 | 5.3% |
| CAGR | 5.6% |
| Incremental Value | $181.3 mn |
Technavio's ewings sarcoma treatment market is segmented as below:
By Type
- Combination therapy
- Monotherapy
By End-user
- Hospitals
- Specialty clinics
- Others
By Geographical Landscape
- North America
- Europe
- Asia
- Rest of World (ROW)
This study identifies the emergence of regenerative therapies as one of the prime reasons driving the ewings sarcoma treatment market growth during the next few years. Also, advent of crispr-cas9 technology and strong research grants will lead to sizable demand in the market.
The report on the ewings sarcoma treatment market covers the following areas:
- Ewings Sarcoma Treatment Market sizing
- Ewings Sarcoma Treatment Market forecast
- Ewings Sarcoma Treatment Market industry analysis
The robust vendor analysis is designed to help clients improve their market position, and in line with this, this report provides a detailed analysis of several leading ewings sarcoma treatment market vendors that include Actiza Pharmaceutical Pvt. Ltd., Advantech Co. Ltd., Amneal Pharmaceuticals Inc., Baxter International Inc., Bristol Myers Squibb Co., Cellectar Biosciences Inc., Daiichi Sankyo Co. Ltd., Eli Lilly and Co., Fresenius Kabi AG, GlaxoSmithKline Plc, Gradalis Inc., Johnson and Johnson Inc., LGM Pharma LLC, Merck and Co. Inc., Novartis AG, Ocean pharmaceutical, Pfizer Inc., PharmaMar SA, Salvavidas, and UPMC Hillman Cancer Center. Also, the ewings sarcoma treatment market analysis report includes information on upcoming trends and challenges that will influence market growth. This is to help companies strategize and leverage all forthcoming growth opportunities.
The study was conducted using an objective combination of primary and secondary information including inputs from key participants in the industry. The report contains a comprehensive market and vendor landscape in addition to an analysis of the key vendors.
The publisher presents a detailed picture of the market by the way of study, synthesis, and summation of data from multiple sources by an analysis of key parameters such as profit, pricing, competition, and promotions. It presents various market facets by identifying the key industry influencers. The data presented is comprehensive, reliable, and a result of extensive primary and secondary research. The market research reports provide a complete competitive landscape and an in-depth vendor selection methodology and analysis using qualitative and quantitative research to forecast accurate market growth.
Table of Contents
1 Executive Summary
- 1.1 Market overview
- Executive Summary - Chart on Market Overview
- Executive Summary - Data Table on Market Overview
- Executive Summary - Chart on Global Market Characteristics
- Executive Summary - Chart on Market By Geographical Landscape
- Executive Summary - Chart on Market Segmentation by Type
- Executive Summary - Chart on Market Segmentation by End-user
- Executive Summary - Chart on Incremental Growth
- Executive Summary - Data Table on Incremental Growth
- Executive Summary - Chart on Company Market Positioning
2 Technavio Analysis
- 2.1 Analysis of price sensitivity, lifecycle, customer purchase basket, adoption rates, and purchase criteria
- Analysis of price sensitivity, lifecycle, customer purchase basket, adoption rates, and purchase criteria
- 2.2 Criticality of inputs and Factors of differentiation
- Overview on criticality of inputs and factors of differentiation
- 2.3 Factors of disruption
- Overview on factors of disruption
- 2.4 Impact of drivers and challenges
- Impact of drivers and challenges in 2024 and 2029
3 Market Landscape
- 3.1 Market ecosystem
- Parent Market
- Data Table on - Parent Market
- 3.2 Market characteristics
- Market characteristics analysis
- 3.3 Value chain analysis
- Value chain analysis
4 Market Sizing
- 4.1 Market definition
- Offerings of companies included in the market definition
- 4.2 Market segment analysis
- Market segments
- 4.3 Market size 2024
- 4.4 Market outlook: Forecast for 2024-2029
- Chart on Global - Market size and forecast 2024-2029 ($ million)
- Data Table on Global - Market size and forecast 2024-2029 ($ million)
- Chart on Global Market: Year-over-year growth 2024-2029 (%)
- Data Table on Global Market: Year-over-year growth 2024-2029 (%)
5 Historic Market Size
- 5.1 Global Ewings Sarcoma Treatment Market 2019 - 2023
- Historic Market Size - Data Table on Global Ewings Sarcoma Treatment Market 2019 - 2023 ($ million)
- 5.2 Type segment analysis 2019 - 2023
- Historic Market Size - Type Segment 2019 - 2023 ($ million)
- 5.3 End-user segment analysis 2019 - 2023
- Historic Market Size - End-user Segment 2019 - 2023 ($ million)
- 5.4 Geography segment analysis 2019 - 2023
- Historic Market Size - Geography Segment 2019 - 2023 ($ million)
- 5.5 Country segment analysis 2019 - 2023
- Historic Market Size - Country Segment 2019 - 2023 ($ million)
6 Qualitative Analysis
- 6.1 Impact of AI on the Global Ewings Sarcoma Treatment Market
7 Five Forces Analysis
- 7.1 Five forces summary
- Five forces analysis - Comparison between 2024 and 2029
- 7.2 Bargaining power of buyers
- Bargaining power of buyers - Impact of key factors 2024 and 2029
- 7.3 Bargaining power of suppliers
- Bargaining power of suppliers - Impact of key factors in 2024 and 2029
- 7.4 Threat of new entrants
- Threat of new entrants - Impact of key factors in 2024 and 2029
- 7.5 Threat of substitutes
- Threat of substitutes - Impact of key factors in 2024 and 2029
- 7.6 Threat of rivalry
- Threat of rivalry - Impact of key factors in 2024 and 2029
- 7.7 Market condition
- Chart on Market condition - Five forces 2024 and 2029
8 Market Segmentation by Type
- 8.1 Market segments
- Chart on Type - Market share 2024-2029 (%)
- Data Table on Type - Market share 2024-2029 (%)
- 8.2 Comparison by Type
- Chart on Comparison by Type
- Data Table on Comparison by Type
- 8.3 Combination therapy - Market size and forecast 2024-2029
- Chart on Combination therapy - Market size and forecast 2024-2029 ($ million)
- Data Table on Combination therapy - Market size and forecast 2024-2029 ($ million)
- Chart on Combination therapy - Year-over-year growth 2024-2029 (%)
- Data Table on Combination therapy - Year-over-year growth 2024-2029 (%)
- 8.4 Monotherapy - Market size and forecast 2024-2029
- Chart on Monotherapy - Market size and forecast 2024-2029 ($ million)
- Data Table on Monotherapy - Market size and forecast 2024-2029 ($ million)
- Chart on Monotherapy - Year-over-year growth 2024-2029 (%)
- Data Table on Monotherapy - Year-over-year growth 2024-2029 (%)
- 8.5 Market opportunity by Type
- Market opportunity by Type ($ million)
- Data Table on Market opportunity by Type ($ million)
9 Market Segmentation by End-user
- 9.1 Market segments
- Chart on End-user - Market share 2024-2029 (%)
- Data Table on End-user - Market share 2024-2029 (%)
- 9.2 Comparison by End-user
- Chart on Comparison by End-user
- Data Table on Comparison by End-user
- 9.3 Hospitals - Market size and forecast 2024-2029
- Chart on Hospitals - Market size and forecast 2024-2029 ($ million)
- Data Table on Hospitals - Market size and forecast 2024-2029 ($ million)
- Chart on Hospitals - Year-over-year growth 2024-2029 (%)
- Data Table on Hospitals - Year-over-year growth 2024-2029 (%)
- 9.4 Specialty clinics - Market size and forecast 2024-2029
- Chart on Specialty clinics - Market size and forecast 2024-2029 ($ million)
- Data Table on Specialty clinics - Market size and forecast 2024-2029 ($ million)
- Chart on Specialty clinics - Year-over-year growth 2024-2029 (%)
- Data Table on Specialty clinics - Year-over-year growth 2024-2029 (%)
- 9.5 Others - Market size and forecast 2024-2029
- Chart on Others - Market size and forecast 2024-2029 ($ million)
- Data Table on Others - Market size and forecast 2024-2029 ($ million)
- Chart on Others - Year-over-year growth 2024-2029 (%)
- Data Table on Others - Year-over-year growth 2024-2029 (%)
- 9.6 Market opportunity by End-user
- Market opportunity by End-user ($ million)
- Data Table on Market opportunity by End-user ($ million)
10 Customer Landscape
- 10.1 Customer landscape overview
- Analysis of price sensitivity, lifecycle, customer purchase basket, adoption rates, and purchase criteria
11 Geographic Landscape
- 11.1 Geographic segmentation
- Chart on Market share By Geographical Landscape 2024-2029 (%)
- Data Table on Market share By Geographical Landscape 2024-2029 (%)
- 11.2 Geographic comparison
- Chart on Geographic comparison
- Data Table on Geographic comparison
- 11.3 North America - Market size and forecast 2024-2029
- Chart on North America - Market size and forecast 2024-2029 ($ million)
- Data Table on North America - Market size and forecast 2024-2029 ($ million)
- Chart on North America - Year-over-year growth 2024-2029 (%)
- Data Table on North America - Year-over-year growth 2024-2029 (%)
- 11.4 Europe - Market size and forecast 2024-2029
- Chart on Europe - Market size and forecast 2024-2029 ($ million)
- Data Table on Europe - Market size and forecast 2024-2029 ($ million)
- Chart on Europe - Year-over-year growth 2024-2029 (%)
- Data Table on Europe - Year-over-year growth 2024-2029 (%)
- 11.5 Asia - Market size and forecast 2024-2029
- Chart on Asia - Market size and forecast 2024-2029 ($ million)
- Data Table on Asia - Market size and forecast 2024-2029 ($ million)
- Chart on Asia - Year-over-year growth 2024-2029 (%)
- Data Table on Asia - Year-over-year growth 2024-2029 (%)
- 11.6 Rest of World (ROW) - Market size and forecast 2024-2029
- Chart on Rest of World (ROW) - Market size and forecast 2024-2029 ($ million)
- Data Table on Rest of World (ROW) - Market size and forecast 2024-2029 ($ million)
- Chart on Rest of World (ROW) - Year-over-year growth 2024-2029 (%)
- Data Table on Rest of World (ROW) - Year-over-year growth 2024-2029 (%)
- 11.7 US - Market size and forecast 2024-2029
- Chart on US - Market size and forecast 2024-2029 ($ million)
- Data Table on US - Market size and forecast 2024-2029 ($ million)
- Chart on US - Year-over-year growth 2024-2029 (%)
- Data Table on US - Year-over-year growth 2024-2029 (%)
- 11.8 Canada - Market size and forecast 2024-2029
- Chart on Canada - Market size and forecast 2024-2029 ($ million)
- Data Table on Canada - Market size and forecast 2024-2029 ($ million)
- Chart on Canada - Year-over-year growth 2024-2029 (%)
- Data Table on Canada - Year-over-year growth 2024-2029 (%)
- 11.9 UK - Market size and forecast 2024-2029
- Chart on UK - Market size and forecast 2024-2029 ($ million)
- Data Table on UK - Market size and forecast 2024-2029 ($ million)
- Chart on UK - Year-over-year growth 2024-2029 (%)
- Data Table on UK - Year-over-year growth 2024-2029 (%)
- 11.10 China - Market size and forecast 2024-2029
- Chart on China - Market size and forecast 2024-2029 ($ million)
- Data Table on China - Market size and forecast 2024-2029 ($ million)
- Chart on China - Year-over-year growth 2024-2029 (%)
- Data Table on China - Year-over-year growth 2024-2029 (%)
- 11.11 Germany - Market size and forecast 2024-2029
- Chart on Germany - Market size and forecast 2024-2029 ($ million)
- Data Table on Germany - Market size and forecast 2024-2029 ($ million)
- Chart on Germany - Year-over-year growth 2024-2029 (%)
- Data Table on Germany - Year-over-year growth 2024-2029 (%)
- 11.12 Japan - Market size and forecast 2024-2029
- Chart on Japan - Market size and forecast 2024-2029 ($ million)
- Data Table on Japan - Market size and forecast 2024-2029 ($ million)
- Chart on Japan - Year-over-year growth 2024-2029 (%)
- Data Table on Japan - Year-over-year growth 2024-2029 (%)
- 11.13 India - Market size and forecast 2024-2029
- Chart on India - Market size and forecast 2024-2029 ($ million)
- Data Table on India - Market size and forecast 2024-2029 ($ million)
- Chart on India - Year-over-year growth 2024-2029 (%)
- Data Table on India - Year-over-year growth 2024-2029 (%)
- 11.14 South Korea - Market size and forecast 2024-2029
- Chart on South Korea - Market size and forecast 2024-2029 ($ million)
- Data Table on South Korea - Market size and forecast 2024-2029 ($ million)
- Chart on South Korea - Year-over-year growth 2024-2029 (%)
- Data Table on South Korea - Year-over-year growth 2024-2029 (%)
- 11.15 France - Market size and forecast 2024-2029
- Chart on France - Market size and forecast 2024-2029 ($ million)
- Data Table on France - Market size and forecast 2024-2029 ($ million)
- Chart on France - Year-over-year growth 2024-2029 (%)
- Data Table on France - Year-over-year growth 2024-2029 (%)
- 11.16 Italy - Market size and forecast 2024-2029
- Chart on Italy - Market size and forecast 2024-2029 ($ million)
- Data Table on Italy - Market size and forecast 2024-2029 ($ million)
- Chart on Italy - Year-over-year growth 2024-2029 (%)
- Data Table on Italy - Year-over-year growth 2024-2029 (%)
- 11.17 Market opportunity By Geographical Landscape
- Market opportunity By Geographical Landscape ($ million)
- Data Tables on Market opportunity By Geographical Landscape ($ million)
12 Drivers, Challenges, and Opportunity/Restraints
- 12.1 Market drivers
- 12.2 Market challenges
- 12.3 Impact of drivers and challenges
- Impact of drivers and challenges in 2024 and 2029
- 12.4 Market opportunities/restraints
13 Competitive Landscape
- 13.1 Overview
- 13.2 Competitive Landscape
- Overview on criticality of inputs and factors of differentiation
- 13.3 Landscape disruption
- Overview on factors of disruption
- 13.4 Industry risks
- Impact of key risks on business
14 Competitive Analysis
- 14.1 Companies profiled
- Companies covered
- 14.2 Company ranking index
- Company ranking index
- 14.3 Market positioning of companies
- Matrix on companies position and classification
- 14.4 Advantech Co. Ltd.
- Advantech Co. Ltd. - Overview
- Advantech Co. Ltd. - Business segments
- Advantech Co. Ltd. - Key news
- Advantech Co. Ltd. - Key offerings
- Advantech Co. Ltd. - Segment focus
- SWOT
- 14.5 Amneal Pharmaceuticals Inc.
- Amneal Pharmaceuticals Inc. - Overview
- Amneal Pharmaceuticals Inc. - Business segments
- Amneal Pharmaceuticals Inc. - Key news
- Amneal Pharmaceuticals Inc. - Key offerings
- Amneal Pharmaceuticals Inc. - Segment focus
- SWOT
- 14.6 Baxter International Inc.
- Baxter International Inc. - Overview
- Baxter International Inc. - Business segments
- Baxter International Inc. - Key news
- Baxter International Inc. - Key offerings
- Baxter International Inc. - Segment focus
- SWOT
- 14.7 Bristol Myers Squibb Co.
- Bristol Myers Squibb Co. - Overview
- Bristol Myers Squibb Co. - Product / Service
- Bristol Myers Squibb Co. - Key news
- Bristol Myers Squibb Co. - Key offerings
- SWOT
- 14.8 Cellectar Biosciences Inc.
- Cellectar Biosciences Inc. - Overview
- Cellectar Biosciences Inc. - Product / Service
- Cellectar Biosciences Inc. - Key offerings
- SWOT
- 14.9 Daiichi Sankyo Co. Ltd.
- Daiichi Sankyo Co. Ltd. - Overview
- Daiichi Sankyo Co. Ltd. - Product / Service
- Daiichi Sankyo Co. Ltd. - Key news
- Daiichi Sankyo Co. Ltd. - Key offerings
- SWOT
- 14.10 Eli Lilly and Co.
- Eli Lilly and Co. - Overview
- Eli Lilly and Co. - Product / Service
- Eli Lilly and Co. - Key offerings
- SWOT
- 14.11 Fresenius Kabi AG
- Fresenius Kabi AG - Overview
- Fresenius Kabi AG - Product / Service
- Fresenius Kabi AG - Key offerings
- SWOT
- 14.12 GlaxoSmithKline Plc
- GlaxoSmithKline Plc - Overview
- GlaxoSmithKline Plc - Business segments
- GlaxoSmithKline Plc - Key news
- GlaxoSmithKline Plc - Key offerings
- GlaxoSmithKline Plc - Segment focus
- SWOT
- 14.13 Gradalis Inc.
- Gradalis Inc. - Overview
- Gradalis Inc. - Product / Service
- Gradalis Inc. - Key offerings
- SWOT
- 14.14 Johnson and Johnson Inc.
- Johnson and Johnson Inc. - Overview
- Johnson and Johnson Inc. - Business segments
- Johnson and Johnson Inc. - Key news
- Johnson and Johnson Inc. - Key offerings
- Johnson and Johnson Inc. - Segment focus
- SWOT
- 14.15 Novartis AG
- Novartis AG - Overview
- Novartis AG - Business segments
- Novartis AG - Key news
- Novartis AG - Key offerings
- Novartis AG - Segment focus
- SWOT
- 14.16 Ocean pharmaceutical
- Ocean pharmaceutical - Overview
- Ocean pharmaceutical - Product / Service
- Ocean pharmaceutical - Key offerings
- SWOT
- 14.17 Pfizer Inc.
- Pfizer Inc. - Overview
- Pfizer Inc. - Product / Service
- Pfizer Inc. - Key news
- Pfizer Inc. - Key offerings
- SWOT
- 14.18 PharmaMar SA
- PharmaMar SA - Overview
- PharmaMar SA - Business segments
- PharmaMar SA - Key offerings
- PharmaMar SA - Segment focus
- SWOT
15 Appendix
- 15.1 Scope of the report
- 15.2 Inclusions and exclusions checklist
- Inclusions checklist
- Exclusions checklist
- 15.3 Currency conversion rates for US$
- Currency conversion rates for US$
- 15.4 Research methodology
- Research methodology
- 15.5 Data procurement
- Information sources
- 15.6 Data validation
- Data validation
- 15.7 Validation techniques employed for market sizing
- Validation techniques employed for market sizing
- 15.8 Data synthesis
- Data synthesis
- 15.9 360 degree market analysis
- 360 degree market analysis
- 15.10 List of abbreviations
- List of abbreviations

