|
|
市場調査レポート
商品コード
1645634
天然ガス液(NGLS)の世界市場 2025~2029年Global Natural Gas Liquids (ngls) Market 2025-2029 |
||||||

|
|||||||
カスタマイズ可能
|
|||||||

| 天然ガス液(NGLS)の世界市場 2025~2029年 |
|
出版日: 2025年01月21日
発行: TechNavio
ページ情報: 英文 207 Pages
納期: 即納可能
|

全表示
- 概要
- 図表
- 目次
天然ガス液(NGLS)市場は2024~2029年に215億240万米ドル、予測期間中のCAGRは6.7%で成長すると予測されます。
当レポートでは、天然ガス液(NGLS)市場の全体的な分析、市場規模・予測、動向、成長促進要因、課題、約25のベンダーを網羅したベンダー分析などを掲載しています。
現在の市場シナリオ、最新動向と促進要因、市場環境全体に関する最新分析を提供しています。市場は、再生可能エネルギー需要の増加、石油化学原料需要の増加、クリーンエネルギーへの移行の高まりによって牽引されています。
| 市場範囲 | |
|---|---|
| 基準年 | 2025年 |
| 終了年 | 2029年 |
| 予測期間 | 2025~2029年 |
| 成長モメンタム | 加速 |
| 前年比[2025年] | 6.2% |
| CAGR | 6.7% |
| 増分額 | 215億240万米ドル |
本調査では、石油化学産業の成長が、今後数年間の天然ガス液(NGLS)市場成長を牽引する主要因の1つであるとしています。また、シェールガス・石油生産量の増加やNGLS抽出技術の技術的進歩は、市場の大きな需要につながります。
目次
第1章 エグゼクティブサマリー
- 市場概要
第2章 Technavio分析
- 価格・ライフサイクル・顧客購入バスケット・採用率・購入基準の分析
- インプットの重要性と差別化の要因
- 混乱の要因
- 促進要因と課題の影響
第3章 市場情勢
- 市場エコシステム
- 市場の特徴
- バリューチェーン分析
第4章 市場規模
- 市場の定義
- 市場セグメント分析
- 市場規模 2024年
- 市場の展望 2024~2029年
第5章 市場規模実績
- 天然ガス液(NGLS)の世界市場 2019~2023年
- 用途別セグメント分析 2019~2023年
- 製品別セグメント分析 2019~2023年
- 地域別セグメント分析 2019~2023年
- 国別セグメント分析 2019~2023年
第6章 定性分析
- AIの影響:天然ガス液(NGLS)の世界市場
第7章 ファイブフォース分析
- ファイブフォースの要約
- 買い手の交渉力
- 供給企業の交渉力
- 新規参入業者の脅威
- 代替品の脅威
- 競争の脅威
- 市況
第8章 市場セグメンテーション:用途別
- 市場セグメント
- 比較:用途別
- 産業用:市場規模と予測 2024~2029年
- 住宅用:市場規模と予測 2024~2029年
- 業務用:市場規模と予測 2024~2029年
- 市場機会:用途別
第9章 市場セグメンテーション:製品別
- 市場セグメント
- 比較:製品別
- プロパン:市場規模と予測 2024~2029年
- ブタン:市場規模と予測 2024~2029年
- ペンタン:市場規模と予測 2024~2029年
- エタン:市場規模と予測 2024~2029年
- 市場機会:製品別
第10章 顧客情勢
- 顧客情勢概要
第11章 地域別情勢
- 地域別セグメンテーション
- 比較:地域別
- 北米:市場規模と予測 2024~2029年
- 中東・アフリカ:市場規模と予測 2024~2029年
- 欧州:市場規模と予測 2024~2029年
- アジア太平洋:市場規模と予測 2024~2029年
- 南米:市場規模と予測 2024~2029年
- 米国:市場規模と予測 2024~2029年
- ロシア:市場規模と予測 2024~2029年
- 中国:市場規模と予測 2024~2029年
- イラン:市場規模と予測 2024~2029年
- サウジアラビア:市場規模と予測 2024~2029年
- カナダ:市場規模と予測 2024~2029年
- カタール:市場規模と予測 2024~2029年
- アラブ首長国連邦:市場規模と予測 2024~2029年
- ノルウェー:市場規模と予測 2024~2029年
- オーストラリア:市場規模と予測 2024~2029年
- 地域情勢による市場機会
第12章 促進要因・課題・機会・抑制要因
- 市場促進要因
- 市場課題
- 促進要因と課題の影響
- 市場機会・抑制要因
第13章 競合情勢
- 概要
- 競合情勢
- 混乱の状況
- 産業のリスク
第14章 競合分析
- 企業プロファイル
- 企業ランキング指数
- 企業の市場ポジショニング
- BP Plc
- Canadian Natural Resources Ltd.
- Chevron Corp.
- ConocoPhillips Co.
- Equinor ASA
- Expand Energy Corp.
- Exxon Mobil Corp.
- Nigeria LNG Ltd.
- Ovintiv Inc.
- Petroleos de Venezuela SA
- PJSC LUKOIL
- PT Pertamina Persero
- Saudi Arabian Oil Co.
- Shell plc
- Valero Energy Corp.
第15章 付録
Exhibits:
- Exhibits1: Executive Summary - Chart on Market Overview
- Exhibits2: Executive Summary - Data Table on Market Overview
- Exhibits3: Executive Summary - Chart on Global Market Characteristics
- Exhibits4: Executive Summary - Chart on Market By Geographical Landscape
- Exhibits5: Executive Summary - Chart on Market Segmentation by Application
- Exhibits6: Executive Summary - Chart on Market Segmentation by Product
- Exhibits7: Executive Summary - Chart on Incremental Growth
- Exhibits8: Executive Summary - Data Table on Incremental Growth
- Exhibits9: Executive Summary - Chart on Company Market Positioning
- Exhibits10: Analysis of price sensitivity, lifecycle, customer purchase basket, adoption rates, and purchase criteria
- Exhibits11: Overview on criticality of inputs and factors of differentiation
- Exhibits12: Overview on factors of disruption
- Exhibits13: Impact of drivers and challenges in 2024 and 2029
- Exhibits14: Parent Market
- Exhibits15: Data Table on - Parent Market
- Exhibits16: Market characteristics analysis
- Exhibits17: Value chain analysis
- Exhibits18: Offerings of companies included in the market definition
- Exhibits19: Market segments
- Exhibits20: Chart on Global - Market size and forecast 2024-2029 ($ million)
- Exhibits21: Data Table on Global - Market size and forecast 2024-2029 ($ million)
- Exhibits22: Chart on Global Market: Year-over-year growth 2024-2029 (%)
- Exhibits23: Data Table on Global Market: Year-over-year growth 2024-2029 (%)
- Exhibits24: Historic Market Size - Data Table on Global Natural Gas Liquids (NGLs) Market 2019 - 2023 ($ million)
- Exhibits25: Historic Market Size - Application Segment 2019 - 2023 ($ million)
- Exhibits26: Historic Market Size - Product Segment 2019 - 2023 ($ million)
- Exhibits27: Historic Market Size - Geography Segment 2019 - 2023 ($ million)
- Exhibits28: Historic Market Size - Country Segment 2019 - 2023 ($ million)
- Exhibits29: Five forces analysis - Comparison between 2024 and 2029
- Exhibits30: Bargaining power of buyers - Impact of key factors 2024 and 2029
- Exhibits31: Bargaining power of suppliers - Impact of key factors in 2024 and 2029
- Exhibits32: Threat of new entrants - Impact of key factors in 2024 and 2029
- Exhibits33: Threat of substitutes - Impact of key factors in 2024 and 2029
- Exhibits34: Threat of rivalry - Impact of key factors in 2024 and 2029
- Exhibits35: Chart on Market condition - Five forces 2024 and 2029
- Exhibits36: Chart on Application - Market share 2024-2029 (%)
- Exhibits37: Data Table on Application - Market share 2024-2029 (%)
- Exhibits38: Chart on Comparison by Application
- Exhibits39: Data Table on Comparison by Application
- Exhibits40: Chart on Industrial - Market size and forecast 2024-2029 ($ million)
- Exhibits41: Data Table on Industrial - Market size and forecast 2024-2029 ($ million)
- Exhibits42: Chart on Industrial - Year-over-year growth 2024-2029 (%)
- Exhibits43: Data Table on Industrial - Year-over-year growth 2024-2029 (%)
- Exhibits44: Chart on Residential - Market size and forecast 2024-2029 ($ million)
- Exhibits45: Data Table on Residential - Market size and forecast 2024-2029 ($ million)
- Exhibits46: Chart on Residential - Year-over-year growth 2024-2029 (%)
- Exhibits47: Data Table on Residential - Year-over-year growth 2024-2029 (%)
- Exhibits48: Chart on Commercial - Market size and forecast 2024-2029 ($ million)
- Exhibits49: Data Table on Commercial - Market size and forecast 2024-2029 ($ million)
- Exhibits50: Chart on Commercial - Year-over-year growth 2024-2029 (%)
- Exhibits51: Data Table on Commercial - Year-over-year growth 2024-2029 (%)
- Exhibits52: Market opportunity by Application ($ million)
- Exhibits53: Data Table on Market opportunity by Application ($ million)
- Exhibits54: Chart on Product - Market share 2024-2029 (%)
- Exhibits55: Data Table on Product - Market share 2024-2029 (%)
- Exhibits56: Chart on Comparison by Product
- Exhibits57: Data Table on Comparison by Product
- Exhibits58: Chart on Propane - Market size and forecast 2024-2029 ($ million)
- Exhibits59: Data Table on Propane - Market size and forecast 2024-2029 ($ million)
- Exhibits60: Chart on Propane - Year-over-year growth 2024-2029 (%)
- Exhibits61: Data Table on Propane - Year-over-year growth 2024-2029 (%)
- Exhibits62: Chart on Butane - Market size and forecast 2024-2029 ($ million)
- Exhibits63: Data Table on Butane - Market size and forecast 2024-2029 ($ million)
- Exhibits64: Chart on Butane - Year-over-year growth 2024-2029 (%)
- Exhibits65: Data Table on Butane - Year-over-year growth 2024-2029 (%)
- Exhibits66: Chart on Pentane - Market size and forecast 2024-2029 ($ million)
- Exhibits67: Data Table on Pentane - Market size and forecast 2024-2029 ($ million)
- Exhibits68: Chart on Pentane - Year-over-year growth 2024-2029 (%)
- Exhibits69: Data Table on Pentane - Year-over-year growth 2024-2029 (%)
- Exhibits70: Chart on Ethane - Market size and forecast 2024-2029 ($ million)
- Exhibits71: Data Table on Ethane - Market size and forecast 2024-2029 ($ million)
- Exhibits72: Chart on Ethane - Year-over-year growth 2024-2029 (%)
- Exhibits73: Data Table on Ethane - Year-over-year growth 2024-2029 (%)
- Exhibits74: Market opportunity by Product ($ million)
- Exhibits75: Data Table on Market opportunity by Product ($ million)
- Exhibits76: Analysis of price sensitivity, lifecycle, customer purchase basket, adoption rates, and purchase criteria
- Exhibits77: Chart on Market share By Geographical Landscape 2024-2029 (%)
- Exhibits78: Data Table on Market share By Geographical Landscape 2024-2029 (%)
- Exhibits79: Chart on Geographic comparison
- Exhibits80: Data Table on Geographic comparison
- Exhibits81: Chart on North America - Market size and forecast 2024-2029 ($ million)
- Exhibits82: Data Table on North America - Market size and forecast 2024-2029 ($ million)
- Exhibits83: Chart on North America - Year-over-year growth 2024-2029 (%)
- Exhibits84: Data Table on North America - Year-over-year growth 2024-2029 (%)
- Exhibits85: Chart on Middle East and Africa - Market size and forecast 2024-2029 ($ million)
- Exhibits86: Data Table on Middle East and Africa - Market size and forecast 2024-2029 ($ million)
- Exhibits87: Chart on Middle East and Africa - Year-over-year growth 2024-2029 (%)
- Exhibits88: Data Table on Middle East and Africa - Year-over-year growth 2024-2029 (%)
- Exhibits89: Chart on Europe - Market size and forecast 2024-2029 ($ million)
- Exhibits90: Data Table on Europe - Market size and forecast 2024-2029 ($ million)
- Exhibits91: Chart on Europe - Year-over-year growth 2024-2029 (%)
- Exhibits92: Data Table on Europe - Year-over-year growth 2024-2029 (%)
- Exhibits93: Chart on APAC - Market size and forecast 2024-2029 ($ million)
- Exhibits94: Data Table on APAC - Market size and forecast 2024-2029 ($ million)
- Exhibits95: Chart on APAC - Year-over-year growth 2024-2029 (%)
- Exhibits96: Data Table on APAC - Year-over-year growth 2024-2029 (%)
- Exhibits97: Chart on South America - Market size and forecast 2024-2029 ($ million)
- Exhibits98: Data Table on South America - Market size and forecast 2024-2029 ($ million)
- Exhibits99: Chart on South America - Year-over-year growth 2024-2029 (%)
- Exhibits100: Data Table on South America - Year-over-year growth 2024-2029 (%)
- Exhibits101: Chart on US - Market size and forecast 2024-2029 ($ million)
- Exhibits102: Data Table on US - Market size and forecast 2024-2029 ($ million)
- Exhibits103: Chart on US - Year-over-year growth 2024-2029 (%)
- Exhibits104: Data Table on US - Year-over-year growth 2024-2029 (%)
- Exhibits105: Chart on Russia - Market size and forecast 2024-2029 ($ million)
- Exhibits106: Data Table on Russia - Market size and forecast 2024-2029 ($ million)
- Exhibits107: Chart on Russia - Year-over-year growth 2024-2029 (%)
- Exhibits108: Data Table on Russia - Year-over-year growth 2024-2029 (%)
- Exhibits109: Chart on China - Market size and forecast 2024-2029 ($ million)
- Exhibits110: Data Table on China - Market size and forecast 2024-2029 ($ million)
- Exhibits111: Chart on China - Year-over-year growth 2024-2029 (%)
- Exhibits112: Data Table on China - Year-over-year growth 2024-2029 (%)
- Exhibits113: Chart on Iran - Market size and forecast 2024-2029 ($ million)
- Exhibits114: Data Table on Iran - Market size and forecast 2024-2029 ($ million)
- Exhibits115: Chart on Iran - Year-over-year growth 2024-2029 (%)
- Exhibits116: Data Table on Iran - Year-over-year growth 2024-2029 (%)
- Exhibits117: Chart on Saudi Arabia - Market size and forecast 2024-2029 ($ million)
- Exhibits118: Data Table on Saudi Arabia - Market size and forecast 2024-2029 ($ million)
- Exhibits119: Chart on Saudi Arabia - Year-over-year growth 2024-2029 (%)
- Exhibits120: Data Table on Saudi Arabia - Year-over-year growth 2024-2029 (%)
- Exhibits121: Chart on Canada - Market size and forecast 2024-2029 ($ million)
- Exhibits122: Data Table on Canada - Market size and forecast 2024-2029 ($ million)
- Exhibits123: Chart on Canada - Year-over-year growth 2024-2029 (%)
- Exhibits124: Data Table on Canada - Year-over-year growth 2024-2029 (%)
- Exhibits125: Chart on Qatar - Market size and forecast 2024-2029 ($ million)
- Exhibits126: Data Table on Qatar - Market size and forecast 2024-2029 ($ million)
- Exhibits127: Chart on Qatar - Year-over-year growth 2024-2029 (%)
- Exhibits128: Data Table on Qatar - Year-over-year growth 2024-2029 (%)
- Exhibits129: Chart on UAE - Market size and forecast 2024-2029 ($ million)
- Exhibits130: Data Table on UAE - Market size and forecast 2024-2029 ($ million)
- Exhibits131: Chart on UAE - Year-over-year growth 2024-2029 (%)
- Exhibits132: Data Table on UAE - Year-over-year growth 2024-2029 (%)
- Exhibits133: Chart on Norway - Market size and forecast 2024-2029 ($ million)
- Exhibits134: Data Table on Norway - Market size and forecast 2024-2029 ($ million)
- Exhibits135: Chart on Norway - Year-over-year growth 2024-2029 (%)
- Exhibits136: Data Table on Norway - Year-over-year growth 2024-2029 (%)
- Exhibits137: Chart on Australia - Market size and forecast 2024-2029 ($ million)
- Exhibits138: Data Table on Australia - Market size and forecast 2024-2029 ($ million)
- Exhibits139: Chart on Australia - Year-over-year growth 2024-2029 (%)
- Exhibits140: Data Table on Australia - Year-over-year growth 2024-2029 (%)
- Exhibits141: Market opportunity By Geographical Landscape ($ million)
- Exhibits142: Data Tables on Market opportunity By Geographical Landscape ($ million)
- Exhibits143: Impact of drivers and challenges in 2024 and 2029
- Exhibits144: Overview on criticality of inputs and factors of differentiation
- Exhibits145: Overview on factors of disruption
- Exhibits146: Impact of key risks on business
- Exhibits147: Companies covered
- Exhibits148: Company ranking index
- Exhibits149: Matrix on companies position and classification
- Exhibits150: BP Plc - Overview
- Exhibits151: BP Plc - Business segments
- Exhibits152: BP Plc - Key news
- Exhibits153: BP Plc - Key offerings
- Exhibits154: BP Plc - Segment focus
- Exhibits155: SWOT
- Exhibits156: Canadian Natural Resources Ltd. - Overview
- Exhibits157: Canadian Natural Resources Ltd. - Product / Service
- Exhibits158: Canadian Natural Resources Ltd. - Key offerings
- Exhibits159: SWOT
- Exhibits160: Chevron Corp. - Overview
- Exhibits161: Chevron Corp. - Business segments
- Exhibits162: Chevron Corp. - Key news
- Exhibits163: Chevron Corp. - Key offerings
- Exhibits164: Chevron Corp. - Segment focus
- Exhibits165: SWOT
- Exhibits166: ConocoPhillips Co. - Overview
- Exhibits167: ConocoPhillips Co. - Business segments
- Exhibits168: ConocoPhillips Co. - Key offerings
- Exhibits169: ConocoPhillips Co. - Segment focus
- Exhibits170: SWOT
- Exhibits171: Equinor ASA - Overview
- Exhibits172: Equinor ASA - Business segments
- Exhibits173: Equinor ASA - Key news
- Exhibits174: Equinor ASA - Key offerings
- Exhibits175: Equinor ASA - Segment focus
- Exhibits176: SWOT
- Exhibits177: Expand Energy Corp. - Overview
- Exhibits178: Expand Energy Corp. - Product / Service
- Exhibits179: Expand Energy Corp. - Key offerings
- Exhibits180: SWOT
- Exhibits181: Exxon Mobil Corp. - Overview
- Exhibits182: Exxon Mobil Corp. - Business segments
- Exhibits183: Exxon Mobil Corp. - Key news
- Exhibits184: Exxon Mobil Corp. - Key offerings
- Exhibits185: Exxon Mobil Corp. - Segment focus
- Exhibits186: SWOT
- Exhibits187: Nigeria LNG Ltd. - Overview
- Exhibits188: Nigeria LNG Ltd. - Product / Service
- Exhibits189: Nigeria LNG Ltd. - Key offerings
- Exhibits190: SWOT
- Exhibits191: Ovintiv Inc. - Overview
- Exhibits192: Ovintiv Inc. - Business segments
- Exhibits193: Ovintiv Inc. - Key offerings
- Exhibits194: Ovintiv Inc. - Segment focus
- Exhibits195: SWOT
- Exhibits196: Petroleos de Venezuela SA - Overview
- Exhibits197: Petroleos de Venezuela SA - Product / Service
- Exhibits198: Petroleos de Venezuela SA - Key offerings
- Exhibits199: SWOT
- Exhibits200: PJSC LUKOIL - Overview
- Exhibits201: PJSC LUKOIL - Product / Service
- Exhibits202: PJSC LUKOIL - Key offerings
- Exhibits203: SWOT
- Exhibits204: PT Pertamina Persero - Overview
- Exhibits205: PT Pertamina Persero - Business segments
- Exhibits206: PT Pertamina Persero - Key offerings
- Exhibits207: PT Pertamina Persero - Segment focus
- Exhibits208: SWOT
- Exhibits209: Saudi Arabian Oil Co. - Overview
- Exhibits210: Saudi Arabian Oil Co. - Product / Service
- Exhibits211: Saudi Arabian Oil Co. - Key offerings
- Exhibits212: SWOT
- Exhibits213: Shell plc - Overview
- Exhibits214: Shell plc - Business segments
- Exhibits215: Shell plc - Key news
- Exhibits216: Shell plc - Key offerings
- Exhibits217: Shell plc - Segment focus
- Exhibits218: SWOT
- Exhibits219: Valero Energy Corp. - Overview
- Exhibits220: Valero Energy Corp. - Business segments
- Exhibits221: Valero Energy Corp. - Key offerings
- Exhibits222: Valero Energy Corp. - Segment focus
- Exhibits223: SWOT
- Exhibits224: Inclusions checklist
- Exhibits225: Exclusions checklist
- Exhibits226: Currency conversion rates for US$
- Exhibits227: Research methodology
- Exhibits228: Information sources
- Exhibits229: Data validation
- Exhibits230: Validation techniques employed for market sizing
- Exhibits231: Data synthesis
- Exhibits232: 360 degree market analysis
- Exhibits233: List of abbreviations
The natural gas liquids (NGLs) market is forecasted to grow by USD 21502.4 mn during 2024-2029, accelerating at a CAGR of 6.7% during the forecast period. The report on the natural gas liquids (NGLs) market provides a holistic analysis, market size and forecast, trends, growth drivers, and challenges, as well as vendor analysis covering around 25 vendors.
The report offers an up-to-date analysis regarding the current market scenario, the latest trends and drivers, and the overall market environment. The market is driven by increasing renewable energy demand, increasing demand for petrochemical feedstock, and rising transition to clean energy.
| Market Scope | |
|---|---|
| Base Year | 2025 |
| End Year | 2029 |
| Series Year | 2025-2029 |
| Growth Momentum | Accelerate |
| YOY 2025 | 6.2% |
| CAGR | 6.7% |
| Incremental Value | $21502.4 mn |
Technavio's natural gas liquids (NGLs) market is segmented as below:
By Application
- Industrial
- Residential
- Commercial
By Product
- Propane
- Butane
- Pentane
- Ethane
By Geographical Landscape
- North America
- Middle East and Africa
- Europe
- APAC
- South America
This study identifies the growth in petrochemical industry as one of the prime reasons driving the natural gas liquids (NGLs) market growth during the next few years. Also, rise in shale gas and oil production and technological advancements in ngls extraction technologies will lead to sizable demand in the market.
The report on the natural gas liquids (NGLs) market covers the following areas:
- Natural Gas Liquids (NGLs) Market sizing
- Natural Gas Liquids (NGLs) Market forecast
- Natural Gas Liquids (NGLs) Market industry analysis
The robust vendor analysis is designed to help clients improve their market position, and in line with this, this report provides a detailed analysis of several leading natural gas liquids (NGLs) market vendors that include BP Plc, Canadian Natural Resources Ltd., Chevron Corp., Citizen Energy, ConocoPhillips Co., Equinor ASA, Expand Energy Corp., Exxon Mobil Corp., Nigeria LNG Ltd., Ovintiv Inc., Petroleos de Venezuela SA, PJSC LUKOIL, PT Pertamina Persero, Repsol S.A., Saudi Arabian Oil Co., Shell plc, SilverBow Resources Inc., SM ENERGY CO., TotalEnergies SE, and Valero Energy Corp.. Also, the natural gas liquids (NGLs) market analysis report includes information on upcoming trends and challenges that will influence market growth. This is to help companies strategize and leverage all forthcoming growth opportunities.
The study was conducted using an objective combination of primary and secondary information including inputs from key participants in the industry. The report contains a comprehensive market and vendor landscape in addition to an analysis of the key vendors.
The publisher presents a detailed picture of the market by the way of study, synthesis, and summation of data from multiple sources by an analysis of key parameters such as profit, pricing, competition, and promotions. It presents various market facets by identifying the key industry influencers. The data presented is comprehensive, reliable, and a result of extensive primary and secondary research. The market research reports provide a complete competitive landscape and an in-depth vendor selection methodology and analysis using qualitative and quantitative research to forecast accurate market growth.
Table of Contents
1 Executive Summary
- 1.1 Market overview
- Executive Summary - Chart on Market Overview
- Executive Summary - Data Table on Market Overview
- Executive Summary - Chart on Global Market Characteristics
- Executive Summary - Chart on Market By Geographical Landscape
- Executive Summary - Chart on Market Segmentation by Application
- Executive Summary - Chart on Market Segmentation by Product
- Executive Summary - Chart on Incremental Growth
- Executive Summary - Data Table on Incremental Growth
- Executive Summary - Chart on Company Market Positioning
2 Technavio Analysis
- 2.1 Analysis of price sensitivity, lifecycle, customer purchase basket, adoption rates, and purchase criteria
- Analysis of price sensitivity, lifecycle, customer purchase basket, adoption rates, and purchase criteria
- 2.2 Criticality of inputs and Factors of differentiation
- Overview on criticality of inputs and factors of differentiation
- 2.3 Factors of disruption
- Overview on factors of disruption
- 2.4 Impact of drivers and challenges
- Impact of drivers and challenges in 2024 and 2029
3 Market Landscape
- 3.1 Market ecosystem
- Parent Market
- Data Table on - Parent Market
- 3.2 Market characteristics
- Market characteristics analysis
- 3.3 Value chain analysis
- Value chain analysis
4 Market Sizing
- 4.1 Market definition
- Offerings of companies included in the market definition
- 4.2 Market segment analysis
- Market segments
- 4.3 Market size 2024
- 4.4 Market outlook: Forecast for 2024-2029
- Chart on Global - Market size and forecast 2024-2029 ($ million)
- Data Table on Global - Market size and forecast 2024-2029 ($ million)
- Chart on Global Market: Year-over-year growth 2024-2029 (%)
- Data Table on Global Market: Year-over-year growth 2024-2029 (%)
5 Historic Market Size
- 5.1 Global Natural Gas Liquids (NGLs) Market 2019 - 2023
- Historic Market Size - Data Table on Global Natural Gas Liquids (NGLs) Market 2019 - 2023 ($ million)
- 5.2 Application segment analysis 2019 - 2023
- Historic Market Size - Application Segment 2019 - 2023 ($ million)
- 5.3 Product segment analysis 2019 - 2023
- Historic Market Size - Product Segment 2019 - 2023 ($ million)
- 5.4 Geography segment analysis 2019 - 2023
- Historic Market Size - Geography Segment 2019 - 2023 ($ million)
- 5.5 Country segment analysis 2019 - 2023
- Historic Market Size - Country Segment 2019 - 2023 ($ million)
6 Qualitative Analysis
- 6.1 The AI impact on Global Natural Gas Liquids (NGLs) Market
7 Five Forces Analysis
- 7.1 Five forces summary
- Five forces analysis - Comparison between 2024 and 2029
- 7.2 Bargaining power of buyers
- Bargaining power of buyers - Impact of key factors 2024 and 2029
- 7.3 Bargaining power of suppliers
- Bargaining power of suppliers - Impact of key factors in 2024 and 2029
- 7.4 Threat of new entrants
- Threat of new entrants - Impact of key factors in 2024 and 2029
- 7.5 Threat of substitutes
- Threat of substitutes - Impact of key factors in 2024 and 2029
- 7.6 Threat of rivalry
- Threat of rivalry - Impact of key factors in 2024 and 2029
- 7.7 Market condition
- Chart on Market condition - Five forces 2024 and 2029
8 Market Segmentation by Application
- 8.1 Market segments
- Chart on Application - Market share 2024-2029 (%)
- Data Table on Application - Market share 2024-2029 (%)
- 8.2 Comparison by Application
- Chart on Comparison by Application
- Data Table on Comparison by Application
- 8.3 Industrial - Market size and forecast 2024-2029
- Chart on Industrial - Market size and forecast 2024-2029 ($ million)
- Data Table on Industrial - Market size and forecast 2024-2029 ($ million)
- Chart on Industrial - Year-over-year growth 2024-2029 (%)
- Data Table on Industrial - Year-over-year growth 2024-2029 (%)
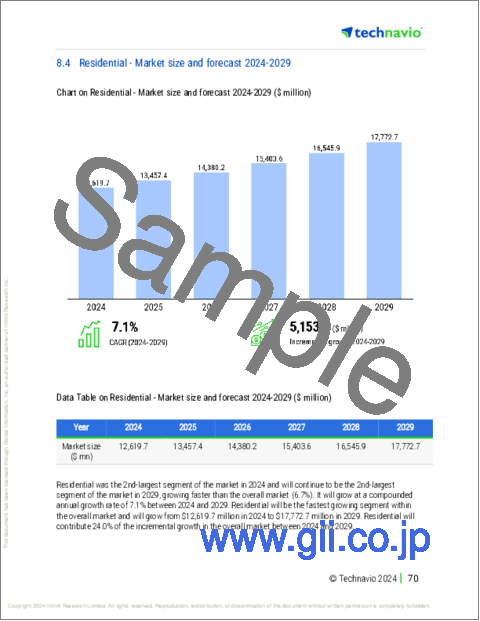
- 8.4 Residential - Market size and forecast 2024-2029
- Chart on Residential - Market size and forecast 2024-2029 ($ million)
- Data Table on Residential - Market size and forecast 2024-2029 ($ million)
- Chart on Residential - Year-over-year growth 2024-2029 (%)
- Data Table on Residential - Year-over-year growth 2024-2029 (%)
- 8.5 Commercial - Market size and forecast 2024-2029
- Chart on Commercial - Market size and forecast 2024-2029 ($ million)
- Data Table on Commercial - Market size and forecast 2024-2029 ($ million)
- Chart on Commercial - Year-over-year growth 2024-2029 (%)
- Data Table on Commercial - Year-over-year growth 2024-2029 (%)
- 8.6 Market opportunity by Application
- Market opportunity by Application ($ million)
- Data Table on Market opportunity by Application ($ million)
9 Market Segmentation by Product
- 9.1 Market segments
- Chart on Product - Market share 2024-2029 (%)
- Data Table on Product - Market share 2024-2029 (%)
- 9.2 Comparison by Product
- Chart on Comparison by Product
- Data Table on Comparison by Product
- 9.3 Propane - Market size and forecast 2024-2029
- Chart on Propane - Market size and forecast 2024-2029 ($ million)
- Data Table on Propane - Market size and forecast 2024-2029 ($ million)
- Chart on Propane - Year-over-year growth 2024-2029 (%)
- Data Table on Propane - Year-over-year growth 2024-2029 (%)
- 9.4 Butane - Market size and forecast 2024-2029
- Chart on Butane - Market size and forecast 2024-2029 ($ million)
- Data Table on Butane - Market size and forecast 2024-2029 ($ million)
- Chart on Butane - Year-over-year growth 2024-2029 (%)
- Data Table on Butane - Year-over-year growth 2024-2029 (%)
- 9.5 Pentane - Market size and forecast 2024-2029
- Chart on Pentane - Market size and forecast 2024-2029 ($ million)
- Data Table on Pentane - Market size and forecast 2024-2029 ($ million)
- Chart on Pentane - Year-over-year growth 2024-2029 (%)
- Data Table on Pentane - Year-over-year growth 2024-2029 (%)
- 9.6 Ethane - Market size and forecast 2024-2029
- Chart on Ethane - Market size and forecast 2024-2029 ($ million)
- Data Table on Ethane - Market size and forecast 2024-2029 ($ million)
- Chart on Ethane - Year-over-year growth 2024-2029 (%)
- Data Table on Ethane - Year-over-year growth 2024-2029 (%)
- 9.7 Market opportunity by Product
- Market opportunity by Product ($ million)
- Data Table on Market opportunity by Product ($ million)
10 Customer Landscape
- 10.1 Customer landscape overview
- Analysis of price sensitivity, lifecycle, customer purchase basket, adoption rates, and purchase criteria
11 Geographic Landscape
- 11.1 Geographic segmentation
- Chart on Market share By Geographical Landscape 2024-2029 (%)
- Data Table on Market share By Geographical Landscape 2024-2029 (%)
- 11.2 Geographic comparison
- Chart on Geographic comparison
- Data Table on Geographic comparison
- 11.3 North America - Market size and forecast 2024-2029
- Chart on North America - Market size and forecast 2024-2029 ($ million)
- Data Table on North America - Market size and forecast 2024-2029 ($ million)
- Chart on North America - Year-over-year growth 2024-2029 (%)
- Data Table on North America - Year-over-year growth 2024-2029 (%)
- 11.4 Middle East and Africa - Market size and forecast 2024-2029
- Chart on Middle East and Africa - Market size and forecast 2024-2029 ($ million)
- Data Table on Middle East and Africa - Market size and forecast 2024-2029 ($ million)
- Chart on Middle East and Africa - Year-over-year growth 2024-2029 (%)
- Data Table on Middle East and Africa - Year-over-year growth 2024-2029 (%)
- 11.5 Europe - Market size and forecast 2024-2029
- Chart on Europe - Market size and forecast 2024-2029 ($ million)
- Data Table on Europe - Market size and forecast 2024-2029 ($ million)
- Chart on Europe - Year-over-year growth 2024-2029 (%)
- Data Table on Europe - Year-over-year growth 2024-2029 (%)
- 11.6 APAC - Market size and forecast 2024-2029
- Chart on APAC - Market size and forecast 2024-2029 ($ million)
- Data Table on APAC - Market size and forecast 2024-2029 ($ million)
- Chart on APAC - Year-over-year growth 2024-2029 (%)
- Data Table on APAC - Year-over-year growth 2024-2029 (%)
- 11.7 South America - Market size and forecast 2024-2029
- Chart on South America - Market size and forecast 2024-2029 ($ million)
- Data Table on South America - Market size and forecast 2024-2029 ($ million)
- Chart on South America - Year-over-year growth 2024-2029 (%)
- Data Table on South America - Year-over-year growth 2024-2029 (%)
- 11.8 US - Market size and forecast 2024-2029
- Chart on US - Market size and forecast 2024-2029 ($ million)
- Data Table on US - Market size and forecast 2024-2029 ($ million)
- Chart on US - Year-over-year growth 2024-2029 (%)
- Data Table on US - Year-over-year growth 2024-2029 (%)
- 11.9 Russia - Market size and forecast 2024-2029
- Chart on Russia - Market size and forecast 2024-2029 ($ million)
- Data Table on Russia - Market size and forecast 2024-2029 ($ million)
- Chart on Russia - Year-over-year growth 2024-2029 (%)
- Data Table on Russia - Year-over-year growth 2024-2029 (%)
- 11.10 China - Market size and forecast 2024-2029
- Chart on China - Market size and forecast 2024-2029 ($ million)
- Data Table on China - Market size and forecast 2024-2029 ($ million)
- Chart on China - Year-over-year growth 2024-2029 (%)
- Data Table on China - Year-over-year growth 2024-2029 (%)
- 11.11 Iran - Market size and forecast 2024-2029
- Chart on Iran - Market size and forecast 2024-2029 ($ million)
- Data Table on Iran - Market size and forecast 2024-2029 ($ million)
- Chart on Iran - Year-over-year growth 2024-2029 (%)
- Data Table on Iran - Year-over-year growth 2024-2029 (%)
- 11.12 Saudi Arabia - Market size and forecast 2024-2029
- Chart on Saudi Arabia - Market size and forecast 2024-2029 ($ million)
- Data Table on Saudi Arabia - Market size and forecast 2024-2029 ($ million)
- Chart on Saudi Arabia - Year-over-year growth 2024-2029 (%)
- Data Table on Saudi Arabia - Year-over-year growth 2024-2029 (%)
- 11.13 Canada - Market size and forecast 2024-2029
- Chart on Canada - Market size and forecast 2024-2029 ($ million)
- Data Table on Canada - Market size and forecast 2024-2029 ($ million)
- Chart on Canada - Year-over-year growth 2024-2029 (%)
- Data Table on Canada - Year-over-year growth 2024-2029 (%)
- 11.14 Qatar - Market size and forecast 2024-2029
- Chart on Qatar - Market size and forecast 2024-2029 ($ million)
- Data Table on Qatar - Market size and forecast 2024-2029 ($ million)
- Chart on Qatar - Year-over-year growth 2024-2029 (%)
- Data Table on Qatar - Year-over-year growth 2024-2029 (%)
- 11.15 UAE - Market size and forecast 2024-2029
- Chart on UAE - Market size and forecast 2024-2029 ($ million)
- Data Table on UAE - Market size and forecast 2024-2029 ($ million)
- Chart on UAE - Year-over-year growth 2024-2029 (%)
- Data Table on UAE - Year-over-year growth 2024-2029 (%)
- 11.16 Norway - Market size and forecast 2024-2029
- Chart on Norway - Market size and forecast 2024-2029 ($ million)
- Data Table on Norway - Market size and forecast 2024-2029 ($ million)
- Chart on Norway - Year-over-year growth 2024-2029 (%)
- Data Table on Norway - Year-over-year growth 2024-2029 (%)
- 11.17 Australia - Market size and forecast 2024-2029
- Chart on Australia - Market size and forecast 2024-2029 ($ million)
- Data Table on Australia - Market size and forecast 2024-2029 ($ million)
- Chart on Australia - Year-over-year growth 2024-2029 (%)
- Data Table on Australia - Year-over-year growth 2024-2029 (%)
- 11.18 Market opportunity By Geographical Landscape
- Market opportunity By Geographical Landscape ($ million)
- Data Tables on Market opportunity By Geographical Landscape ($ million)
12 Drivers, Challenges, and Opportunity/Restraints
- 12.1 Market drivers
- 12.2 Market challenges
- 12.3 Impact of drivers and challenges
- Impact of drivers and challenges in 2024 and 2029
- 12.4 Market opportunities/restraints
13 Competitive Landscape
- 13.1 Overview
- 13.2 Competitive Landscape
- Overview on criticality of inputs and factors of differentiation
- 13.3 Landscape disruption
- Overview on factors of disruption
- 13.4 Industry risks
- Impact of key risks on business
14 Competitive Analysis
- 14.1 Companies profiled
- Companies covered
- 14.2 Company ranking index
- Company ranking index
- 14.3 Market positioning of companies
- Matrix on companies position and classification
- 14.4 BP Plc
- BP Plc - Overview
- BP Plc - Business segments
- BP Plc - Key news
- BP Plc - Key offerings
- BP Plc - Segment focus
- SWOT
- 14.5 Canadian Natural Resources Ltd.
- Canadian Natural Resources Ltd. - Overview
- Canadian Natural Resources Ltd. - Product / Service
- Canadian Natural Resources Ltd. - Key offerings
- SWOT
- 14.6 Chevron Corp.
- Chevron Corp. - Overview
- Chevron Corp. - Business segments
- Chevron Corp. - Key news
- Chevron Corp. - Key offerings
- Chevron Corp. - Segment focus
- SWOT
- 14.7 ConocoPhillips Co.
- ConocoPhillips Co. - Overview
- ConocoPhillips Co. - Business segments
- ConocoPhillips Co. - Key offerings
- ConocoPhillips Co. - Segment focus
- SWOT
- 14.8 Equinor ASA
- Equinor ASA - Overview
- Equinor ASA - Business segments
- Equinor ASA - Key news
- Equinor ASA - Key offerings
- Equinor ASA - Segment focus
- SWOT
- 14.9 Expand Energy Corp.
- Expand Energy Corp. - Overview
- Expand Energy Corp. - Product / Service
- Expand Energy Corp. - Key offerings
- SWOT
- 14.10 Exxon Mobil Corp.
- Exxon Mobil Corp. - Overview
- Exxon Mobil Corp. - Business segments
- Exxon Mobil Corp. - Key news
- Exxon Mobil Corp. - Key offerings
- Exxon Mobil Corp. - Segment focus
- SWOT
- 14.11 Nigeria LNG Ltd.
- Nigeria LNG Ltd. - Overview
- Nigeria LNG Ltd. - Product / Service
- Nigeria LNG Ltd. - Key offerings
- SWOT
- 14.12 Ovintiv Inc.
- Ovintiv Inc. - Overview
- Ovintiv Inc. - Business segments
- Ovintiv Inc. - Key offerings
- Ovintiv Inc. - Segment focus
- SWOT
- 14.13 Petroleos de Venezuela SA
- Petroleos de Venezuela SA - Overview
- Petroleos de Venezuela SA - Product / Service
- Petroleos de Venezuela SA - Key offerings
- SWOT
- 14.14 PJSC LUKOIL
- PJSC LUKOIL - Overview
- PJSC LUKOIL - Product / Service
- PJSC LUKOIL - Key offerings
- SWOT
- 14.15 PT Pertamina Persero
- PT Pertamina Persero - Overview
- PT Pertamina Persero - Business segments
- PT Pertamina Persero - Key offerings
- PT Pertamina Persero - Segment focus
- SWOT
- 14.16 Saudi Arabian Oil Co.
- Saudi Arabian Oil Co. - Overview
- Saudi Arabian Oil Co. - Product / Service
- Saudi Arabian Oil Co. - Key offerings
- SWOT
- 14.17 Shell plc
- Shell plc - Overview
- Shell plc - Business segments
- Shell plc - Key news
- Shell plc - Key offerings
- Shell plc - Segment focus
- SWOT
- 14.18 Valero Energy Corp.
- Valero Energy Corp. - Overview
- Valero Energy Corp. - Business segments
- Valero Energy Corp. - Key offerings
- Valero Energy Corp. - Segment focus
- SWOT
15 Appendix
- 15.1 Scope of the report
- 15.2 Inclusions and exclusions checklist
- Inclusions checklist
- Exclusions checklist
- 15.3 Currency conversion rates for US$
- Currency conversion rates for US$
- 15.4 Research methodology
- Research methodology
- 15.5 Data procurement
- Information sources
- 15.6 Data validation
- Data validation
- 15.7 Validation techniques employed for market sizing
- Validation techniques employed for market sizing
- 15.8 Data synthesis
- Data synthesis
- 15.9 360 degree market analysis
- 360 degree market analysis
- 15.10 List of abbreviations
- List of abbreviations

