|
|
市場調査レポート
商品コード
1652827
鉄鉱石の世界市場、2025-2029年Global Iron Ore Market 2025-2029 |
||||||
|
|||||||
カスタマイズ可能
|
|||||||

| 鉄鉱石の世界市場、2025-2029年 |
|
出版日: 2025年01月23日
発行: TechNavio
ページ情報: 英文 203 Pages
納期: 即納可能
|

全表示
- 概要
- 目次
鉄鉱石市場は2024-2029年に609億米ドル、予測期間中のCAGRは3.3%で成長すると予測されます。
この調査レポートは、鉄鉱石市場の全体分析、市場規模・予測、動向、成長促進要因、課題、約25のベンダーを網羅したベンダー分析などを掲載しています。
現在の市場シナリオ、最新動向と促進要因、市場環境全体に関する最新分析を提供しています。市場は、高強度鋼や鋼材の消費の急増、新興諸国における工業化、建設業界からの需要の高まりによって牽引されています。
| 市場範囲 | |
|---|---|
| 基準年 | 2025 |
| 終了年 | 2029 |
| 予測期間 | 2025-2029 |
| 成長モメンタム | 加速 |
| 前年比2025年 | 3.1% |
| CAGR | 3.3% |
| 増分額 | 609億米ドル |
本調査では、今後数年間の鉄鉱石市場成長を牽引する主な要因の一つとして、ステンレス鋼需要を押し上げる中国とインドの経済成長を挙げています。また、産業用アプリケーションにおける鉄鋼の普及拡大や、再生可能エネルギー分野における鋳鉄製品の消費急増も、市場の大きな需要につながると思われます。
目次
第1章 エグゼクティブサマリー
- 市場概要
第2章 Technavio分析
- 価格・ライフサイクル・顧客購入バスケット・採用率・購入基準の分析
- インプットの重要性と差別化の要因
- 混乱の要因
- 促進要因と課題の影響
第3章 市場情勢
- 市場エコシステム
- 市場の特徴
- バリューチェーン分析
第4章 市場規模
- 市場の定義
- 市場セグメント分析
- 市場規模 2024
- 市場の見通し 2024-2029
第5章 市場規模実績
- 鉄鉱石の世界市場 2019-2023
- 製品セグメント分析 2019-2023
- ソースセグメント分析 2019-2023
- 地域別セグメント分析 2019-2023
- 国別セグメント分析 2019-2023
第6章 定性分析
- AIの影響:鉄鉱石の世界市場
第7章 ファイブフォース分析
- ファイブフォースの要約
- 買い手の交渉力
- 供給企業の交渉力
- 新規参入業者の脅威
- 代替品の脅威
- 競争の脅威
- 市況
第8章 市場セグメンテーション:製品別
- 市場セグメント
- 比較:製品別
- ファイン:市場規模と予測 2024-2029
- ペレット:市場規模と予測 2024-2029
- ランプ:市場規模と予測 2024-2029
- HBI/DRI:市場規模と予測 2024-2029
- 市場機会:製品別
第9章 市場セグメンテーション:ソース別
- 市場セグメント
- 比較:ソース別
- 露天採掘:市場規模と予測 2024-2029
- 地下採掘:市場規模と予測 2024-2029
- 市場機会:ソース別
第10章 顧客情勢
- 顧客情勢の概要
第11章 地域別情勢
- 地域別セグメンテーション
- 地域別比較
- アジア太平洋:市場規模と予測 2024-2029
- 欧州:市場規模と予測 2024-2029
- 南米:市場規模と予測 2024-2029
- 北米:市場規模と予測 2024-2029
- 中東・アフリカ:市場規模と予測 2024-2029
- ロシア:市場規模と予測 2024-2029
- オーストラリア:市場規模と予測 2024-2029
- 中国:市場規模と予測 2024-2029
- インド:市場規模と予測 2024-2029
- ブラジル:市場規模と予測 2024-2029
- 日本:市場規模と予測 2024-2029
- スウェーデン:市場規模と予測 2024-2029
- 米国:市場規模と予測 2024-2029
- ドイツ:市場規模と予測 2024-2029
- ベネズエラ:市場規模と予測 2024-2029
- 市場機会:地域情勢別
第12章 促進要因・課題・機会・抑制要因
- 市場促進要因
- 市場の課題
- 促進要因と課題の影響
- 市場の機会・抑制要因
第13章 競合情勢
- 概要
- 競合情勢
- 混乱の状況
- 業界のリスク
第14章 競合分析
- 企業プロファイル
- 企業ランキング指数
- 企業の市場ポジショニング
- Anglo American plc
- Ansteel Group Corp. Ltd.
- ArcelorMittal SA
- Atlas Iron Pty Ltd.
- BHP Group Ltd.
- Eurasian Resources Group Sarl
- Ferrexpo Plc
- Fortescue Metals Group Ltd.
- GFG Alliance
- KIOCL Ltd.
- Luossavaara Kiirunavaara AB
- Metinvest BV
- NMDC Ltd.
- Rio Tinto Ltd.
- Vale SA
第15章 付録
The iron ore market is forecasted to grow by $ 60.9 bn during 2024-2029, accelerating at a CAGR of 3.3% during the forecast period. The report on the iron ore market provides a holistic analysis, market size and forecast, trends, growth drivers, and challenges, as well as vendor analysis covering around 25 vendors.
The report offers an up-to-date analysis regarding the current market scenario, the latest trends and drivers, and the overall market environment. The market is driven by upsurge in consumption of high-strength iron ore and steel, industrialization in developing countries, and growing demand from construction industry.
| Market Scope | |
|---|---|
| Base Year | 2025 |
| End Year | 2029 |
| Series Year | 2025-2029 |
| Growth Momentum | Accelerate |
| YOY 2025 | 3.1% |
| CAGR | 3.3% |
| Incremental Value | $60.9 bn |
Technavio's iron ore market is segmented as below:
By Product
- Fines
- Pellets
- Lump
- HBI/DRI
By Source
- Surface mining
- Underground mining
By Geographical Landscape
- APAC
- Europe
- South America
- North America
- Middle East and Africa
This study identifies the economic growth in china and india boosting demand for stainless steel as one of the prime reasons driving the iron ore market growth during the next few years. Also, increased penetration of steel in industrial applications and surge in consumption of cast iron products in renewable energy segment will lead to sizable demand in the market.
The report on the iron ore market covers the following areas:
- Iron Ore Market sizing
- Iron Ore Market forecast
- Iron Ore Market industry analysis
The robust vendor analysis is designed to help clients improve their market position, and in line with this, this report provides a detailed analysis of several leading iron ore market vendors that include Anglo American plc, Ansteel Group Corp. Ltd., ArcelorMittal SA, Atlas Iron Pty Ltd., BCI Minerals Ltd., BHP Group Ltd., China Hanking Holdings Ltd., Eurasian Resources Group Sarl, Ferrexpo Plc, Fortescue Metals Group Ltd., GFG Alliance, KIOCL Ltd., Luossavaara Kiirunavaara AB, Metinvest BV, Mideast Integrated Steel Ltd., Mount Gibson Iron Ltd., NMDC Ltd., Rio Tinto Ltd., and Vale SA. Also, the iron ore market analysis report includes information on upcoming trends and challenges that will influence market growth. This is to help companies strategize and leverage all forthcoming growth opportunities.
The study was conducted using an objective combination of primary and secondary information including inputs from key participants in the industry. The report contains a comprehensive market and vendor landscape in addition to an analysis of the key vendors.
The publisher presents a detailed picture of the market by the way of study, synthesis, and summation of data from multiple sources by an analysis of key parameters such as profit, pricing, competition, and promotions. It presents various market facets by identifying the key industry influencers. The data presented is comprehensive, reliable, and a result of extensive primary and secondary research. The market research reports provide a complete competitive landscape and an in-depth vendor selection methodology and analysis using qualitative and quantitative research to forecast accurate market growth.
Table of Contents
1 Executive Summary
- 1.1 Market overview
- Executive Summary - Chart on Market Overview
- Executive Summary - Data Table on Market Overview
- Executive Summary - Chart on Global Market Characteristics
- Executive Summary - Chart on Market By Geographical Landscape
- Executive Summary - Chart on Market Segmentation by Product
- Executive Summary - Chart on Market Segmentation by Source
- Executive Summary - Chart on Incremental Growth
- Executive Summary - Data Table on Incremental Growth
- Executive Summary - Chart on Company Market Positioning
2 Technavio Analysis
- 2.1 Analysis of price sensitivity, lifecycle, customer purchase basket, adoption rates, and purchase criteria
- Analysis of price sensitivity, lifecycle, customer purchase basket, adoption rates, and purchase criteria
- 2.2 Criticality of inputs and Factors of differentiation
- Overview on criticality of inputs and factors of differentiation
- 2.3 Factors of disruption
- Overview on factors of disruption
- 2.4 Impact of drivers and challenges
- Impact of drivers and challenges in 2024 and 2029
3 Market Landscape
- 3.1 Market ecosystem
- Parent Market
- Data Table on - Parent Market
- 3.2 Market characteristics
- Market characteristics analysis
- 3.3 Value chain analysis
- Value chain analysis
4 Market Sizing
- 4.1 Market definition
- Offerings of companies included in the market definition
- 4.2 Market segment analysis
- Market segments
- 4.3 Market size 2024
- 4.4 Market outlook: Forecast for 2024-2029
- Chart on Global - Market size and forecast 2024-2029 ($ billion)
- Data Table on Global - Market size and forecast 2024-2029 ($ billion)
- Chart on Global Market: Year-over-year growth 2024-2029 (%)
- Data Table on Global Market: Year-over-year growth 2024-2029 (%)
5 Historic Market Size
- 5.1 Global Iron Ore Market 2019 - 2023
- Historic Market Size - Data Table on Global Iron Ore Market 2019 - 2023 ($ billion)
- 5.2 Product segment analysis 2019 - 2023
- Historic Market Size - Product Segment 2019 - 2023 ($ billion)
- 5.3 Source segment analysis 2019 - 2023
- Historic Market Size - Source Segment 2019 - 2023 ($ billion)
- 5.4 Geography segment analysis 2019 - 2023
- Historic Market Size - Geography Segment 2019 - 2023 ($ billion)
- 5.5 Country segment analysis 2019 - 2023
- Historic Market Size - Country Segment 2019 - 2023 ($ billion)
6 Qualitative Analysis
- 6.1 Impact of AI on Global Iron Ore Market
7 Five Forces Analysis
- 7.1 Five forces summary
- Five forces analysis - Comparison between 2024 and 2029
- 7.2 Bargaining power of buyers
- Bargaining power of buyers - Impact of key factors 2024 and 2029
- 7.3 Bargaining power of suppliers
- Bargaining power of suppliers - Impact of key factors in 2024 and 2029
- 7.4 Threat of new entrants
- Threat of new entrants - Impact of key factors in 2024 and 2029
- 7.5 Threat of substitutes
- Threat of substitutes - Impact of key factors in 2024 and 2029
- 7.6 Threat of rivalry
- Threat of rivalry - Impact of key factors in 2024 and 2029
- 7.7 Market condition
- Chart on Market condition - Five forces 2024 and 2029
8 Market Segmentation by Product
- 8.1 Market segments
- Chart on Product - Market share 2024-2029 (%)
- Data Table on Product - Market share 2024-2029 (%)
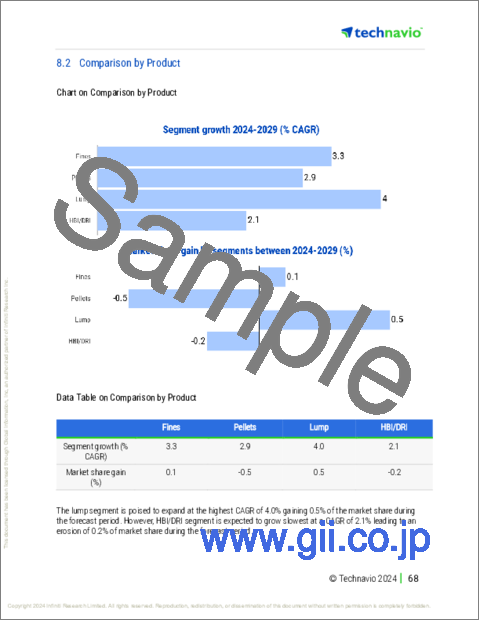
- 8.2 Comparison by Product
- Chart on Comparison by Product
- Data Table on Comparison by Product
- 8.3 Fines - Market size and forecast 2024-2029
- Chart on Fines - Market size and forecast 2024-2029 ($ billion)
- Data Table on Fines - Market size and forecast 2024-2029 ($ billion)
- Chart on Fines - Year-over-year growth 2024-2029 (%)
- Data Table on Fines - Year-over-year growth 2024-2029 (%)
- 8.4 Pellets - Market size and forecast 2024-2029
- Chart on Pellets - Market size and forecast 2024-2029 ($ billion)
- Data Table on Pellets - Market size and forecast 2024-2029 ($ billion)
- Chart on Pellets - Year-over-year growth 2024-2029 (%)
- Data Table on Pellets - Year-over-year growth 2024-2029 (%)
- 8.5 Lump - Market size and forecast 2024-2029
- Chart on Lump - Market size and forecast 2024-2029 ($ billion)
- Data Table on Lump - Market size and forecast 2024-2029 ($ billion)
- Chart on Lump - Year-over-year growth 2024-2029 (%)
- Data Table on Lump - Year-over-year growth 2024-2029 (%)
- 8.6 HBI/DRI - Market size and forecast 2024-2029
- Chart on HBI/DRI - Market size and forecast 2024-2029 ($ billion)
- Data Table on HBI/DRI - Market size and forecast 2024-2029 ($ billion)
- Chart on HBI/DRI - Year-over-year growth 2024-2029 (%)
- Data Table on HBI/DRI - Year-over-year growth 2024-2029 (%)
- 8.7 Market opportunity by Product
- Market opportunity by Product ($ billion)
- Data Table on Market opportunity by Product ($ billion)
9 Market Segmentation by Source
- 9.1 Market segments
- Chart on Source - Market share 2024-2029 (%)
- Data Table on Source - Market share 2024-2029 (%)
- 9.2 Comparison by Source
- Chart on Comparison by Source
- Data Table on Comparison by Source
- 9.3 Surface mining - Market size and forecast 2024-2029
- Chart on Surface mining - Market size and forecast 2024-2029 ($ billion)
- Data Table on Surface mining - Market size and forecast 2024-2029 ($ billion)
- Chart on Surface mining - Year-over-year growth 2024-2029 (%)
- Data Table on Surface mining - Year-over-year growth 2024-2029 (%)
- 9.4 Underground mining - Market size and forecast 2024-2029
- Chart on Underground mining - Market size and forecast 2024-2029 ($ billion)
- Data Table on Underground mining - Market size and forecast 2024-2029 ($ billion)
- Chart on Underground mining - Year-over-year growth 2024-2029 (%)
- Data Table on Underground mining - Year-over-year growth 2024-2029 (%)
- 9.5 Market opportunity by Source
- Market opportunity by Source ($ billion)
- Data Table on Market opportunity by Source ($ billion)
10 Customer Landscape
- 10.1 Customer landscape overview
- Analysis of price sensitivity, lifecycle, customer purchase basket, adoption rates, and purchase criteria
11 Geographic Landscape
- 11.1 Geographic segmentation
- Chart on Market share By Geographical Landscape 2024-2029 (%)
- Data Table on Market share By Geographical Landscape 2024-2029 (%)
- 11.2 Geographic comparison
- Chart on Geographic comparison
- Data Table on Geographic comparison
- 11.3 APAC - Market size and forecast 2024-2029
- Chart on APAC - Market size and forecast 2024-2029 ($ billion)
- Data Table on APAC - Market size and forecast 2024-2029 ($ billion)
- Chart on APAC - Year-over-year growth 2024-2029 (%)
- Data Table on APAC - Year-over-year growth 2024-2029 (%)
- 11.4 Europe - Market size and forecast 2024-2029
- Chart on Europe - Market size and forecast 2024-2029 ($ billion)
- Data Table on Europe - Market size and forecast 2024-2029 ($ billion)
- Chart on Europe - Year-over-year growth 2024-2029 (%)
- Data Table on Europe - Year-over-year growth 2024-2029 (%)
- 11.5 South America - Market size and forecast 2024-2029
- Chart on South America - Market size and forecast 2024-2029 ($ billion)
- Data Table on South America - Market size and forecast 2024-2029 ($ billion)
- Chart on South America - Year-over-year growth 2024-2029 (%)
- Data Table on South America - Year-over-year growth 2024-2029 (%)
- 11.6 North America - Market size and forecast 2024-2029
- Chart on North America - Market size and forecast 2024-2029 ($ billion)
- Data Table on North America - Market size and forecast 2024-2029 ($ billion)
- Chart on North America - Year-over-year growth 2024-2029 (%)
- Data Table on North America - Year-over-year growth 2024-2029 (%)
- 11.7 Middle East and Africa - Market size and forecast 2024-2029
- Chart on Middle East and Africa - Market size and forecast 2024-2029 ($ billion)
- Data Table on Middle East and Africa - Market size and forecast 2024-2029 ($ billion)
- Chart on Middle East and Africa - Year-over-year growth 2024-2029 (%)
- Data Table on Middle East and Africa - Year-over-year growth 2024-2029 (%)
- 11.8 Russia - Market size and forecast 2024-2029
- Chart on Russia - Market size and forecast 2024-2029 ($ billion)
- Data Table on Russia - Market size and forecast 2024-2029 ($ billion)
- Chart on Russia - Year-over-year growth 2024-2029 (%)
- Data Table on Russia - Year-over-year growth 2024-2029 (%)
- 11.9 Australia - Market size and forecast 2024-2029
- Chart on Australia - Market size and forecast 2024-2029 ($ billion)
- Data Table on Australia - Market size and forecast 2024-2029 ($ billion)
- Chart on Australia - Year-over-year growth 2024-2029 (%)
- Data Table on Australia - Year-over-year growth 2024-2029 (%)
- 11.10 China - Market size and forecast 2024-2029
- Chart on China - Market size and forecast 2024-2029 ($ billion)
- Data Table on China - Market size and forecast 2024-2029 ($ billion)
- Chart on China - Year-over-year growth 2024-2029 (%)
- Data Table on China - Year-over-year growth 2024-2029 (%)
- 11.11 India - Market size and forecast 2024-2029
- Chart on India - Market size and forecast 2024-2029 ($ billion)
- Data Table on India - Market size and forecast 2024-2029 ($ billion)
- Chart on India - Year-over-year growth 2024-2029 (%)
- Data Table on India - Year-over-year growth 2024-2029 (%)
- 11.12 Brazil - Market size and forecast 2024-2029
- Chart on Brazil - Market size and forecast 2024-2029 ($ billion)
- Data Table on Brazil - Market size and forecast 2024-2029 ($ billion)
- Chart on Brazil - Year-over-year growth 2024-2029 (%)
- Data Table on Brazil - Year-over-year growth 2024-2029 (%)
- 11.13 Japan - Market size and forecast 2024-2029
- Chart on Japan - Market size and forecast 2024-2029 ($ billion)
- Data Table on Japan - Market size and forecast 2024-2029 ($ billion)
- Chart on Japan - Year-over-year growth 2024-2029 (%)
- Data Table on Japan - Year-over-year growth 2024-2029 (%)
- 11.14 Sweden - Market size and forecast 2024-2029
- Chart on Sweden - Market size and forecast 2024-2029 ($ billion)
- Data Table on Sweden - Market size and forecast 2024-2029 ($ billion)
- Chart on Sweden - Year-over-year growth 2024-2029 (%)
- Data Table on Sweden - Year-over-year growth 2024-2029 (%)
- 11.15 US - Market size and forecast 2024-2029
- Chart on US - Market size and forecast 2024-2029 ($ billion)
- Data Table on US - Market size and forecast 2024-2029 ($ billion)
- Chart on US - Year-over-year growth 2024-2029 (%)
- Data Table on US - Year-over-year growth 2024-2029 (%)
- 11.16 Germany - Market size and forecast 2024-2029
- Chart on Germany - Market size and forecast 2024-2029 ($ billion)
- Data Table on Germany - Market size and forecast 2024-2029 ($ billion)
- Chart on Germany - Year-over-year growth 2024-2029 (%)
- Data Table on Germany - Year-over-year growth 2024-2029 (%)
- 11.17 Venezuela - Market size and forecast 2024-2029
- Chart on Venezuela - Market size and forecast 2024-2029 ($ billion)
- Data Table on Venezuela - Market size and forecast 2024-2029 ($ billion)
- Chart on Venezuela - Year-over-year growth 2024-2029 (%)
- Data Table on Venezuela - Year-over-year growth 2024-2029 (%)
- 11.18 Market opportunity By Geographical Landscape
- Market opportunity By Geographical Landscape ($ billion)
- Data Tables on Market opportunity By Geographical Landscape ($ billion)
12 Drivers, Challenges, and Opportunity/Restraints
- 12.1 Market drivers
- 12.2 Market challenges
- 12.3 Impact of drivers and challenges
- Impact of drivers and challenges in 2024 and 2029
- 12.4 Market opportunities/restraints
13 Competitive Landscape
- 13.1 Overview
- 13.2 Competitive Landscape
- Overview on criticality of inputs and factors of differentiation
- 13.3 Landscape disruption
- Overview on factors of disruption
- 13.4 Industry risks
- Impact of key risks on business
14 Competitive Analysis
- 14.1 Companies profiled
- Companies covered
- 14.2 Company ranking index
- Company ranking index
- 14.3 Market positioning of companies
- Matrix on companies position and classification
- 14.4 Anglo American plc
- Anglo American plc - Overview
- Anglo American plc - Business segments
- Anglo American plc - Key news
- Anglo American plc - Key offerings
- Anglo American plc - Segment focus
- SWOT
- 14.5 Ansteel Group Corp. Ltd.
- Ansteel Group Corp. Ltd. - Overview
- Ansteel Group Corp. Ltd. - Product / Service
- Ansteel Group Corp. Ltd. - Key offerings
- SWOT
- 14.6 ArcelorMittal SA
- ArcelorMittal SA - Overview
- ArcelorMittal SA - Business segments
- ArcelorMittal SA - Key news
- ArcelorMittal SA - Key offerings
- ArcelorMittal SA - Segment focus
- SWOT
- 14.7 Atlas Iron Pty Ltd.
- Atlas Iron Pty Ltd. - Overview
- Atlas Iron Pty Ltd. - Product / Service
- Atlas Iron Pty Ltd. - Key offerings
- SWOT
- 14.8 BHP Group Ltd.
- BHP Group Ltd. - Overview
- BHP Group Ltd. - Business segments
- BHP Group Ltd. - Key offerings
- BHP Group Ltd. - Segment focus
- SWOT
- 14.9 Eurasian Resources Group Sarl
- Eurasian Resources Group Sarl - Overview
- Eurasian Resources Group Sarl - Product / Service
- Eurasian Resources Group Sarl - Key offerings
- SWOT
- 14.10 Ferrexpo Plc
- Ferrexpo Plc - Overview
- Ferrexpo Plc - Product / Service
- Ferrexpo Plc - Key offerings
- SWOT
- 14.11 Fortescue Metals Group Ltd.
- Fortescue Metals Group Ltd. - Overview
- Fortescue Metals Group Ltd. - Product / Service
- Fortescue Metals Group Ltd. - Key news
- Fortescue Metals Group Ltd. - Key offerings
- SWOT
- 14.12 GFG Alliance
- GFG Alliance - Overview
- GFG Alliance - Product / Service
- GFG Alliance - Key offerings
- SWOT
- 14.13 KIOCL Ltd.
- KIOCL Ltd. - Overview
- KIOCL Ltd. - Product / Service
- KIOCL Ltd. - Key offerings
- SWOT
- 14.14 Luossavaara Kiirunavaara AB
- Luossavaara Kiirunavaara AB - Overview
- Luossavaara Kiirunavaara AB - Product / Service
- Luossavaara Kiirunavaara AB - Key offerings
- SWOT
- 14.15 Metinvest BV
- Metinvest BV - Overview
- Metinvest BV - Product / Service
- Metinvest BV - Key offerings
- SWOT
- 14.16 NMDC Ltd.
- NMDC Ltd. - Overview
- NMDC Ltd. - Product / Service
- NMDC Ltd. - Key news
- NMDC Ltd. - Key offerings
- SWOT
- 14.17 Rio Tinto Ltd.
- Rio Tinto Ltd. - Overview
- Rio Tinto Ltd. - Business segments
- Rio Tinto Ltd. - Key news
- Rio Tinto Ltd. - Key offerings
- Rio Tinto Ltd. - Segment focus
- SWOT
- 14.18 Vale SA
- Vale SA - Overview
- Vale SA - Product / Service
- Vale SA - Key offerings
- SWOT
15 Appendix
- 15.1 Scope of the report
- 15.2 Inclusions and exclusions checklist
- Inclusions checklist
- Exclusions checklist
- 15.3 Currency conversion rates for US$
- Currency conversion rates for US$
- 15.4 Research methodology
- Research methodology
- 15.5 Data procurement
- Information sources
- 15.6 Data validation
- Data validation
- 15.7 Validation techniques employed for market sizing
- Validation techniques employed for market sizing
- 15.8 Data synthesis
- Data synthesis
- 15.9 360 degree market analysis
- 360 degree market analysis
- 15.10 List of abbreviations
- List of abbreviations

