|
|
市場調査レポート
商品コード
1738183
スマート楽器の世界市場 2025-2029年Global Smart Musical Instruments Market 2025-2029 |
||||||
|
|||||||
カスタマイズ可能
|
|||||||


| スマート楽器の世界市場 2025-2029年 |
|
出版日: 2025年05月22日
発行: TechNavio
ページ情報: 英文 214 Pages
納期: 即納可能
|

全表示
- 概要
- 図表
- 目次
スマート楽器市場は2024-2029年に1,971万7,900米ドル、予測期間中のCAGRは4.9%で成長すると予測されます。
当レポートでは、スマート楽器市場の全体的な分析、市場規模・予測、動向、成長促進要因、課題、約25のベンダーを網羅したベンダー分析などを掲載しています。
現在の市場シナリオ、最新動向と促進要因、市場環境全体に関する最新分析を提供しています。市場は、スマートエレクトロニクスやスマート楽器におけるモーションセンサーの採用増加、オンライン流通チャネルを通じたスマート楽器の販売急増、高速学習を可能にするスマート楽器の採用増加などが牽引しています。
| 市場範囲 | |
|---|---|
| 基準年 | 2025 |
| 終了年 | 2029 |
| 予測期間 | 2025-2029 |
| 成長モメンタム | 加速 |
| 前年比 | 4.5% |
| CAGR | 4.9% |
| 増分額 | 1,971万7,900米ドル |
本調査は、業界の主要参加者からのインプットを含め、一次情報と二次情報を客観的に組み合わせて実施しました。レポートには、主要企業の分析に加え、包括的な市場規模データ、地域分析によるセグメント、ベンダー情勢が含まれています。レポートには過去データと予測データがあります。
本調査では、今後数年間のスマート楽器市場の成長を促進する主な要因の一つとして、楽器へのAIの浸透を挙げています。また、音楽と教育との融合が進み、音楽関連活動への消費支出が増加していることも、市場の大きな需要につながると思われます。
目次
第1章 エグゼクティブサマリー
- 市場概要
第2章 Technavio分析
- 価格・ライフサイクル・顧客購入バスケット・採用率・購入基準の分析
- インプットの重要性と差別化の要因
- 混乱の要因
- 促進要因と課題の影響
第3章 市場情勢
- 市場エコシステム
- 市場の特徴
- バリューチェーン分析
第4章 市場規模
- 市場の定義
- 市場セグメント分析
- 市場規模 2024
- 市場の見通し 2024-2029
第5章 市場規模実績
- スマート楽器の世界市場 2019-2023
- 技術別セグメント分析 2019-2023
- エンドユーザー別セグメント分析 2019-2023
- コネクティビティ別セグメント分析 2019-2023
- 地域別セグメント分析 2019-2023
- 国別セグメント分析 2019-2023
第6章 定性分析
- AIの影響:スマート楽器の世界市場
第7章 ファイブフォース分析
- ファイブフォースの要約
- 買い手の交渉力
- 供給企業の交渉力
- 新規参入業者の脅威
- 代替品の脅威
- 競争の脅威
- 市況
第8章 市場セグメンテーション:技術別
- 市場セグメント
- 比較:技術別
- コネクティビティ機器:市場規模と予測 2024-2029
- ウェアラブル:市場規模と予測 2024-2029
- 市場機会:技術別
第9章 市場セグメンテーション:エンドユーザー別
- 市場セグメント
- 比較:エンドユーザー別
- プロ:市場規模と予測 2024-2029
- 趣味:市場規模と予測 2024-2029
- 市場機会:エンドユーザー別
第10章 市場セグメンテーション:コネクティビティ別
- 市場セグメント
- 比較:コネクティビティ別
- Bluetooth:市場規模と予測 2024-2029
- Wi-Fi:市場規模と予測 2024-2029
- アプリ統合デバイス:市場規模と予測 2024-2029
- USB:市場規模と予測 2024-2029
- 市場機会:コネクティビティ別
第11章 顧客情勢
- 顧客情勢の概要
第12章 地域別情勢
- 地域別セグメンテーション
- 地域別比較
- 北米:市場規模と予測 2024-2029
- アジア太平洋:市場規模と予測 2024-2029
- 欧州:市場規模と予測 2024-2029
- 南米:市場規模と予測 2024-2029
- 中東・アフリカ:市場規模と予測 2024-2029
- 米国:市場規模と予測 2024-2029
- 中国:市場規模と予測 2024-2029
- カナダ:市場規模と予測 2024-2029
- ドイツ:市場規模と予測 2024-2029
- 日本:市場規模と予測 2024-2029
- インド:市場規模と予測 2024-2029
- 英国:市場規模と予測 2024-2029
- メキシコ:市場規模と予測 2024-2029
- フランス:市場規模と予測 2024-2029
- 韓国:市場規模と予測 2024-2029
- 市場機会:地域情勢別
第13章 促進要因・課題・機会・抑制要因
- 市場促進要因
- 市場の課題
- 促進要因と課題の影響
- 市場の機会・抑制要因
第14章 競合情勢
- 概要
- 競合情勢
- 混乱の状況
- 業界のリスク
第15章 競合分析
- 企業プロファイル
- 企業ランキング指数
- 企業の市場ポジショニング
- Artiphon Inc.
- Audiotonix Ltd.
- CASIO Computer Co. Ltd.
- CME PTE. LTD.
- HyVibe
- inMusic Brands Inc.
- Kawai Musical Instruments Mfg. Co. Ltd.
- Kickstarter PBC
- Kurv Music Ltd.
- Roland Corp.
- Steinway Inc.
- The ONE Music Group
- Xiaomi Inc.
- Yamaha Corp.
- Zivix LLC
第16章 付録
Exhibits:
- Exhibits1: Executive Summary - Chart on Market Overview
- Exhibits2: Executive Summary - Data Table on Market Overview
- Exhibits3: Executive Summary - Chart on Global Market Characteristics
- Exhibits4: Executive Summary - Chart on Market By Geographical Landscape
- Exhibits5: Executive Summary - Chart on Market Segmentation by Technology
- Exhibits6: Executive Summary - Chart on Market Segmentation by End-user
- Exhibits7: Executive Summary - Chart on Market Segmentation by Connectivity
- Exhibits8: Executive Summary - Chart on Incremental Growth
- Exhibits9: Executive Summary - Data Table on Incremental Growth
- Exhibits10: Executive Summary - Chart on Company Market Positioning
- Exhibits11: Analysis of price sensitivity, lifecycle, customer purchase basket, adoption rates, and purchase criteria
- Exhibits12: Overview on criticality of inputs and factors of differentiation
- Exhibits13: Overview on factors of disruption
- Exhibits14: Impact of drivers and challenges in 2024 and 2029
- Exhibits15: Parent Market
- Exhibits16: Data Table on - Parent Market
- Exhibits17: Market characteristics analysis
- Exhibits18: Value chain analysis
- Exhibits19: Offerings of companies included in the market definition
- Exhibits20: Market segments
- Exhibits21: Chart on Global - Market size and forecast 2024-2029 ($ thousand)
- Exhibits22: Data Table on Global - Market size and forecast 2024-2029 ($ thousand)
- Exhibits23: Chart on Global Market: Year-over-year growth 2024-2029 (%)
- Exhibits24: Data Table on Global Market: Year-over-year growth 2024-2029 (%)
- Exhibits25: Historic Market Size - Data Table on Global Smart Musical Instruments Market 2019 - 2023 ($ thousand)
- Exhibits26: Historic Market Size - Technology Segment 2019 - 2023 ($ thousand)
- Exhibits27: Historic Market Size - End-user Segment 2019 - 2023 ($ thousand)
- Exhibits28: Historic Market Size - Connectivity Segment 2019 - 2023 ($ thousand)
- Exhibits29: Historic Market Size - Geography Segment 2019 - 2023 ($ thousand)
- Exhibits30: Historic Market Size - Country Segment 2019 - 2023 ($ thousand)
- Exhibits31: Five forces analysis - Comparison between 2024 and 2029
- Exhibits32: Bargaining power of buyers - Impact of key factors 2024 and 2029
- Exhibits33: Bargaining power of suppliers - Impact of key factors in 2024 and 2029
- Exhibits34: Threat of new entrants - Impact of key factors in 2024 and 2029
- Exhibits35: Threat of substitutes - Impact of key factors in 2024 and 2029
- Exhibits36: Threat of rivalry - Impact of key factors in 2024 and 2029
- Exhibits37: Chart on Market condition - Five forces 2024 and 2029
- Exhibits38: Chart on Technology - Market share 2024-2029 (%)
- Exhibits39: Data Table on Technology - Market share 2024-2029 (%)
- Exhibits40: Chart on Comparison by Technology
- Exhibits41: Data Table on Comparison by Technology
- Exhibits42: Chart on Connected instruments - Market size and forecast 2024-2029 ($ thousand)
- Exhibits43: Data Table on Connected instruments - Market size and forecast 2024-2029 ($ thousand)
- Exhibits44: Chart on Connected instruments - Year-over-year growth 2024-2029 (%)
- Exhibits45: Data Table on Connected instruments - Year-over-year growth 2024-2029 (%)
- Exhibits46: Chart on Wearables - Market size and forecast 2024-2029 ($ thousand)
- Exhibits47: Data Table on Wearables - Market size and forecast 2024-2029 ($ thousand)
- Exhibits48: Chart on Wearables - Year-over-year growth 2024-2029 (%)
- Exhibits49: Data Table on Wearables - Year-over-year growth 2024-2029 (%)
- Exhibits50: Market opportunity by Technology ($ thousand)
- Exhibits51: Data Table on Market opportunity by Technology ($ thousand)
- Exhibits52: Chart on End-user - Market share 2024-2029 (%)
- Exhibits53: Data Table on End-user - Market share 2024-2029 (%)
- Exhibits54: Chart on Comparison by End-user
- Exhibits55: Data Table on Comparison by End-user
- Exhibits56: Chart on Professionals - Market size and forecast 2024-2029 ($ thousand)
- Exhibits57: Data Table on Professionals - Market size and forecast 2024-2029 ($ thousand)
- Exhibits58: Chart on Professionals - Year-over-year growth 2024-2029 (%)
- Exhibits59: Data Table on Professionals - Year-over-year growth 2024-2029 (%)
- Exhibits60: Chart on Hobbyists - Market size and forecast 2024-2029 ($ thousand)
- Exhibits61: Data Table on Hobbyists - Market size and forecast 2024-2029 ($ thousand)
- Exhibits62: Chart on Hobbyists - Year-over-year growth 2024-2029 (%)
- Exhibits63: Data Table on Hobbyists - Year-over-year growth 2024-2029 (%)
- Exhibits64: Market opportunity by End-user ($ thousand)
- Exhibits65: Data Table on Market opportunity by End-user ($ thousand)
- Exhibits66: Chart on Connectivity - Market share 2024-2029 (%)
- Exhibits67: Data Table on Connectivity - Market share 2024-2029 (%)
- Exhibits68: Chart on Comparison by Connectivity
- Exhibits69: Data Table on Comparison by Connectivity
- Exhibits70: Chart on Bluetooth - Market size and forecast 2024-2029 ($ thousand)
- Exhibits71: Data Table on Bluetooth - Market size and forecast 2024-2029 ($ thousand)
- Exhibits72: Chart on Bluetooth - Year-over-year growth 2024-2029 (%)
- Exhibits73: Data Table on Bluetooth - Year-over-year growth 2024-2029 (%)
- Exhibits74: Chart on Wi-Fi - Market size and forecast 2024-2029 ($ thousand)
- Exhibits75: Data Table on Wi-Fi - Market size and forecast 2024-2029 ($ thousand)
- Exhibits76: Chart on Wi-Fi - Year-over-year growth 2024-2029 (%)
- Exhibits77: Data Table on Wi-Fi - Year-over-year growth 2024-2029 (%)
- Exhibits78: Chart on App-integrated devices - Market size and forecast 2024-2029 ($ thousand)
- Exhibits79: Data Table on App-integrated devices - Market size and forecast 2024-2029 ($ thousand)
- Exhibits80: Chart on App-integrated devices - Year-over-year growth 2024-2029 (%)
- Exhibits81: Data Table on App-integrated devices - Year-over-year growth 2024-2029 (%)
- Exhibits82: Chart on USB - Market size and forecast 2024-2029 ($ thousand)
- Exhibits83: Data Table on USB - Market size and forecast 2024-2029 ($ thousand)
- Exhibits84: Chart on USB - Year-over-year growth 2024-2029 (%)
- Exhibits85: Data Table on USB - Year-over-year growth 2024-2029 (%)
- Exhibits86: Market opportunity by Connectivity ($ thousand)
- Exhibits87: Data Table on Market opportunity by Connectivity ($ thousand)
- Exhibits88: Analysis of price sensitivity, lifecycle, customer purchase basket, adoption rates, and purchase criteria
- Exhibits89: Chart on Market share By Geographical Landscape 2024-2029 (%)
- Exhibits90: Data Table on Market share By Geographical Landscape 2024-2029 (%)
- Exhibits91: Chart on Geographic comparison
- Exhibits92: Data Table on Geographic comparison
- Exhibits93: Chart on North America - Market size and forecast 2024-2029 ($ thousand)
- Exhibits94: Data Table on North America - Market size and forecast 2024-2029 ($ thousand)
- Exhibits95: Chart on North America - Year-over-year growth 2024-2029 (%)
- Exhibits96: Data Table on North America - Year-over-year growth 2024-2029 (%)
- Exhibits97: Chart on APAC - Market size and forecast 2024-2029 ($ thousand)
- Exhibits98: Data Table on APAC - Market size and forecast 2024-2029 ($ thousand)
- Exhibits99: Chart on APAC - Year-over-year growth 2024-2029 (%)
- Exhibits100: Data Table on APAC - Year-over-year growth 2024-2029 (%)
- Exhibits101: Chart on Europe - Market size and forecast 2024-2029 ($ thousand)
- Exhibits102: Data Table on Europe - Market size and forecast 2024-2029 ($ thousand)
- Exhibits103: Chart on Europe - Year-over-year growth 2024-2029 (%)
- Exhibits104: Data Table on Europe - Year-over-year growth 2024-2029 (%)
- Exhibits105: Chart on South America - Market size and forecast 2024-2029 ($ thousand)
- Exhibits106: Data Table on South America - Market size and forecast 2024-2029 ($ thousand)
- Exhibits107: Chart on South America - Year-over-year growth 2024-2029 (%)
- Exhibits108: Data Table on South America - Year-over-year growth 2024-2029 (%)
- Exhibits109: Chart on Middle East and Africa - Market size and forecast 2024-2029 ($ thousand)
- Exhibits110: Data Table on Middle East and Africa - Market size and forecast 2024-2029 ($ thousand)
- Exhibits111: Chart on Middle East and Africa - Year-over-year growth 2024-2029 (%)
- Exhibits112: Data Table on Middle East and Africa - Year-over-year growth 2024-2029 (%)
- Exhibits113: Chart on US - Market size and forecast 2024-2029 ($ thousand)
- Exhibits114: Data Table on US - Market size and forecast 2024-2029 ($ thousand)
- Exhibits115: Chart on US - Year-over-year growth 2024-2029 (%)
- Exhibits116: Data Table on US - Year-over-year growth 2024-2029 (%)
- Exhibits117: Chart on China - Market size and forecast 2024-2029 ($ thousand)
- Exhibits118: Data Table on China - Market size and forecast 2024-2029 ($ thousand)
- Exhibits119: Chart on China - Year-over-year growth 2024-2029 (%)
- Exhibits120: Data Table on China - Year-over-year growth 2024-2029 (%)
- Exhibits121: Chart on Canada - Market size and forecast 2024-2029 ($ thousand)
- Exhibits122: Data Table on Canada - Market size and forecast 2024-2029 ($ thousand)
- Exhibits123: Chart on Canada - Year-over-year growth 2024-2029 (%)
- Exhibits124: Data Table on Canada - Year-over-year growth 2024-2029 (%)
- Exhibits125: Chart on Germany - Market size and forecast 2024-2029 ($ thousand)
- Exhibits126: Data Table on Germany - Market size and forecast 2024-2029 ($ thousand)
- Exhibits127: Chart on Germany - Year-over-year growth 2024-2029 (%)
- Exhibits128: Data Table on Germany - Year-over-year growth 2024-2029 (%)
- Exhibits129: Chart on Japan - Market size and forecast 2024-2029 ($ thousand)
- Exhibits130: Data Table on Japan - Market size and forecast 2024-2029 ($ thousand)
- Exhibits131: Chart on Japan - Year-over-year growth 2024-2029 (%)
- Exhibits132: Data Table on Japan - Year-over-year growth 2024-2029 (%)
- Exhibits133: Chart on India - Market size and forecast 2024-2029 ($ thousand)
- Exhibits134: Data Table on India - Market size and forecast 2024-2029 ($ thousand)
- Exhibits135: Chart on India - Year-over-year growth 2024-2029 (%)
- Exhibits136: Data Table on India - Year-over-year growth 2024-2029 (%)
- Exhibits137: Chart on UK - Market size and forecast 2024-2029 ($ thousand)
- Exhibits138: Data Table on UK - Market size and forecast 2024-2029 ($ thousand)
- Exhibits139: Chart on UK - Year-over-year growth 2024-2029 (%)
- Exhibits140: Data Table on UK - Year-over-year growth 2024-2029 (%)
- Exhibits141: Chart on Mexico - Market size and forecast 2024-2029 ($ thousand)
- Exhibits142: Data Table on Mexico - Market size and forecast 2024-2029 ($ thousand)
- Exhibits143: Chart on Mexico - Year-over-year growth 2024-2029 (%)
- Exhibits144: Data Table on Mexico - Year-over-year growth 2024-2029 (%)
- Exhibits145: Chart on France - Market size and forecast 2024-2029 ($ thousand)
- Exhibits146: Data Table on France - Market size and forecast 2024-2029 ($ thousand)
- Exhibits147: Chart on France - Year-over-year growth 2024-2029 (%)
- Exhibits148: Data Table on France - Year-over-year growth 2024-2029 (%)
- Exhibits149: Chart on South Korea - Market size and forecast 2024-2029 ($ thousand)
- Exhibits150: Data Table on South Korea - Market size and forecast 2024-2029 ($ thousand)
- Exhibits151: Chart on South Korea - Year-over-year growth 2024-2029 (%)
- Exhibits152: Data Table on South Korea - Year-over-year growth 2024-2029 (%)
- Exhibits153: Market opportunity By Geographical Landscape ($ thousand)
- Exhibits154: Data Tables on Market opportunity By Geographical Landscape ($ thousand)
- Exhibits155: Impact of drivers and challenges in 2024 and 2029
- Exhibits156: Overview on criticality of inputs and factors of differentiation
- Exhibits157: Overview on factors of disruption
- Exhibits158: Impact of key risks on business
- Exhibits159: Companies covered
- Exhibits160: Company ranking index
- Exhibits161: Matrix on companies position and classification
- Exhibits162: Artiphon Inc. - Overview
- Exhibits163: Artiphon Inc. - Product / Service
- Exhibits164: Artiphon Inc. - Key offerings
- Exhibits165: SWOT
- Exhibits166: Audiotonix Ltd. - Overview
- Exhibits167: Audiotonix Ltd. - Product / Service
- Exhibits168: Audiotonix Ltd. - Key offerings
- Exhibits169: SWOT
- Exhibits170: CASIO Computer Co. Ltd. - Overview
- Exhibits171: CASIO Computer Co. Ltd. - Business segments
- Exhibits172: CASIO Computer Co. Ltd. - Key offerings
- Exhibits173: CASIO Computer Co. Ltd. - Segment focus
- Exhibits174: SWOT
- Exhibits175: CME PTE. LTD. - Overview
- Exhibits176: CME PTE. LTD. - Product / Service
- Exhibits177: CME PTE. LTD. - Key offerings
- Exhibits178: SWOT
- Exhibits179: HyVibe - Overview
- Exhibits180: HyVibe - Product / Service
- Exhibits181: HyVibe - Key offerings
- Exhibits182: SWOT
- Exhibits183: inMusic Brands Inc. - Overview
- Exhibits184: inMusic Brands Inc. - Product / Service
- Exhibits185: inMusic Brands Inc. - Key offerings
- Exhibits186: SWOT
- Exhibits187: Kawai Musical Instruments Mfg. Co. Ltd. - Overview
- Exhibits188: Kawai Musical Instruments Mfg. Co. Ltd. - Product / Service
- Exhibits189: Kawai Musical Instruments Mfg. Co. Ltd. - Key offerings
- Exhibits190: SWOT
- Exhibits191: Kickstarter PBC - Overview
- Exhibits192: Kickstarter PBC - Product / Service
- Exhibits193: Kickstarter PBC - Key offerings
- Exhibits194: SWOT
- Exhibits195: Kurv Music Ltd. - Overview
- Exhibits196: Kurv Music Ltd. - Product / Service
- Exhibits197: Kurv Music Ltd. - Key offerings
- Exhibits198: SWOT
- Exhibits199: Roland Corp. - Overview
- Exhibits200: Roland Corp. - Product / Service
- Exhibits201: Roland Corp. - Key news
- Exhibits202: Roland Corp. - Key offerings
- Exhibits203: SWOT
- Exhibits204: Steinway Inc. - Overview
- Exhibits205: Steinway Inc. - Product / Service
- Exhibits206: Steinway Inc. - Key offerings
- Exhibits207: SWOT
- Exhibits208: The ONE Music Group - Overview
- Exhibits209: The ONE Music Group - Product / Service
- Exhibits210: The ONE Music Group - Key offerings
- Exhibits211: SWOT
- Exhibits212: Xiaomi Inc. - Overview
- Exhibits213: Xiaomi Inc. - Business segments
- Exhibits214: Xiaomi Inc. - Key news
- Exhibits215: Xiaomi Inc. - Key offerings
- Exhibits216: Xiaomi Inc. - Segment focus
- Exhibits217: SWOT
- Exhibits218: Yamaha Corp. - Overview
- Exhibits219: Yamaha Corp. - Business segments
- Exhibits220: Yamaha Corp. - Key news
- Exhibits221: Yamaha Corp. - Key offerings
- Exhibits222: Yamaha Corp. - Segment focus
- Exhibits223: SWOT
- Exhibits224: Zivix LLC - Overview
- Exhibits225: Zivix LLC - Product / Service
- Exhibits226: Zivix LLC - Key offerings
- Exhibits227: SWOT
- Exhibits228: Inclusions checklist
- Exhibits229: Exclusions checklist
- Exhibits230: Currency conversion rates for US$
- Exhibits231: Research methodology
- Exhibits232: Information sources
- Exhibits233: Data validation
- Exhibits234: Validation techniques employed for market sizing
- Exhibits235: Data synthesis
- Exhibits236: 360 degree market analysis
- Exhibits237: List of abbreviations
The smart musical instruments market is forecasted to grow by USD 19717.9 thousand during 2024-2029, accelerating at a CAGR of 4.9% during the forecast period. The report on the smart musical instruments market provides a holistic analysis, market size and forecast, trends, growth drivers, and challenges, as well as vendor analysis covering around 25 vendors.
The report offers an up-to-date analysis regarding the current market scenario, the latest trends and drivers, and the overall market environment. The market is driven by increasing adoption of motion sensors in smart electronics and smart musical instruments, surge in sales of smart musical instruments through online distribution channel, and increasing adoption of smart musical instruments as they enable faster learning.
| Market Scope | |
|---|---|
| Base Year | 2025 |
| End Year | 2029 |
| Series Year | 2025-2029 |
| Growth Momentum | Accelerate |
| YOY 2025 | 4.5% |
| CAGR | 4.9% |
| Incremental Value | $19717.9 th |
The study was conducted using an objective combination of primary and secondary information including inputs from key participants in the industry. The report contains a comprehensive market size data, segment with regional analysis and vendor landscape in addition to an analysis of the key companies. Reports have historic and forecast data.
Technavio's smart musical instruments market is segmented as below:
By Technology
- Connected instruments
- Wearables
By End-user
- Professionals
- Hobbyists
By Connectivity
- Bluetooth
- Wi-Fi
- App-integrated devices
- USB
By Geographical Landscape
- North America
- APAC
- Europe
- South America
- Middle East and Africa
This study identifies the penetration of ai in musical instruments as one of the prime reasons driving the smart musical instruments market growth during the next few years. Also, rising integration of music with education and increasing consumer spending on music-related activities will lead to sizable demand in the market.
The report on the smart musical instruments market covers the following areas:
- Smart Musical Instruments Market sizing
- Smart Musical Instruments Market forecast
- Smart Musical Instruments Market industry analysis
The robust vendor analysis is designed to help clients improve their market position, and in line with this, this report provides a detailed analysis of several leading smart musical instruments market vendors that include Artiphon Inc., Audiotonix Ltd., CASIO Computer Co. Ltd., CME PTE. LTD., HyVibe, inMusic Brands Inc., Kawai Musical Instruments Mfg. Co. Ltd., Kickstarter PBC, Kurv Music Ltd., Modern Ancient Instruments Networked AB, Roland Corp., Steinway Inc., The ONE Music Group, Xiaomi Inc., Yamaha Corp., and Zivix LLC. Also, the smart musical instruments market analysis report includes information on upcoming trends and challenges that will influence market growth. This is to help companies strategize and leverage all forthcoming growth opportunities.
The publisher presents a detailed picture of the market by the way of study, synthesis, and summation of data from multiple sources by an analysis of key parameters such as profit, pricing, competition, and promotions. It presents various market facets by identifying the key industry influencers. The data presented is comprehensive, reliable, and a result of extensive primary and secondary research. The market research reports provide a complete competitive landscape and an in-depth vendor selection methodology and analysis using qualitative and quantitative research to forecast accurate market growth.
Table of Contents
1 Executive Summary
- 1.1 Market overview
- Executive Summary - Chart on Market Overview
- Executive Summary - Data Table on Market Overview
- Executive Summary - Chart on Global Market Characteristics
- Executive Summary - Chart on Market By Geographical Landscape
- Executive Summary - Chart on Market Segmentation by Technology
- Executive Summary - Chart on Market Segmentation by End-user
- Executive Summary - Chart on Market Segmentation by Connectivity
- Executive Summary - Chart on Incremental Growth
- Executive Summary - Data Table on Incremental Growth
- Executive Summary - Chart on Company Market Positioning
2 Technavio Analysis
- 2.1 Analysis of price sensitivity, lifecycle, customer purchase basket, adoption rates, and purchase criteria
- Analysis of price sensitivity, lifecycle, customer purchase basket, adoption rates, and purchase criteria
- 2.2 Criticality of inputs and Factors of differentiation
- Overview on criticality of inputs and factors of differentiation
- 2.3 Factors of disruption
- Overview on factors of disruption
- 2.4 Impact of drivers and challenges
- Impact of drivers and challenges in 2024 and 2029
3 Market Landscape
- 3.1 Market ecosystem
- Parent Market
- Data Table on - Parent Market
- 3.2 Market characteristics
- Market characteristics analysis
- 3.3 Value chain analysis
- Value chain analysis
4 Market Sizing
- 4.1 Market definition
- Offerings of companies included in the market definition
- 4.2 Market segment analysis
- Market segments
- 4.3 Market size 2024
- 4.4 Market outlook: Forecast for 2024-2029
- Chart on Global - Market size and forecast 2024-2029 ($ thousand)
- Data Table on Global - Market size and forecast 2024-2029 ($ thousand)
- Chart on Global Market: Year-over-year growth 2024-2029 (%)
- Data Table on Global Market: Year-over-year growth 2024-2029 (%)
5 Historic Market Size
- 5.1 Global Smart Musical Instruments Market 2019 - 2023
- Historic Market Size - Data Table on Global Smart Musical Instruments Market 2019 - 2023 ($ thousand)
- 5.2 Technology segment analysis 2019 - 2023
- Historic Market Size - Technology Segment 2019 - 2023 ($ thousand)
- 5.3 End-user segment analysis 2019 - 2023
- Historic Market Size - End-user Segment 2019 - 2023 ($ thousand)
- 5.4 Connectivity segment analysis 2019 - 2023
- Historic Market Size - Connectivity Segment 2019 - 2023 ($ thousand)
- 5.5 Geography segment analysis 2019 - 2023
- Historic Market Size - Geography Segment 2019 - 2023 ($ thousand)
- 5.6 Country segment analysis 2019 - 2023
- Historic Market Size - Country Segment 2019 - 2023 ($ thousand)
6 Qualitative Analysis
- 6.1 The AI impact on Global Smart Musical Instruments
7 Five Forces Analysis
- 7.1 Five forces summary
- Five forces analysis - Comparison between 2024 and 2029
- 7.2 Bargaining power of buyers
- Bargaining power of buyers - Impact of key factors 2024 and 2029
- 7.3 Bargaining power of suppliers
- Bargaining power of suppliers - Impact of key factors in 2024 and 2029
- 7.4 Threat of new entrants
- Threat of new entrants - Impact of key factors in 2024 and 2029
- 7.5 Threat of substitutes
- Threat of substitutes - Impact of key factors in 2024 and 2029
- 7.6 Threat of rivalry
- Threat of rivalry - Impact of key factors in 2024 and 2029
- 7.7 Market condition
- Chart on Market condition - Five forces 2024 and 2029
8 Market Segmentation by Technology
- 8.1 Market segments
- Chart on Technology - Market share 2024-2029 (%)
- Data Table on Technology - Market share 2024-2029 (%)
- 8.2 Comparison by Technology
- Chart on Comparison by Technology
- Data Table on Comparison by Technology
- 8.3 Connected instruments - Market size and forecast 2024-2029
- Chart on Connected instruments - Market size and forecast 2024-2029 ($ thousand)
- Data Table on Connected instruments - Market size and forecast 2024-2029 ($ thousand)
- Chart on Connected instruments - Year-over-year growth 2024-2029 (%)
- Data Table on Connected instruments - Year-over-year growth 2024-2029 (%)
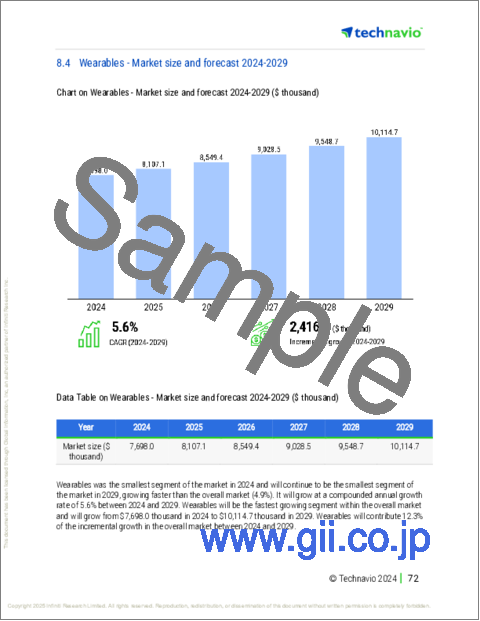
- 8.4 Wearables - Market size and forecast 2024-2029
- Chart on Wearables - Market size and forecast 2024-2029 ($ thousand)
- Data Table on Wearables - Market size and forecast 2024-2029 ($ thousand)
- Chart on Wearables - Year-over-year growth 2024-2029 (%)
- Data Table on Wearables - Year-over-year growth 2024-2029 (%)
- 8.5 Market opportunity by Technology
- Market opportunity by Technology ($ thousand)
- Data Table on Market opportunity by Technology ($ thousand)
9 Market Segmentation by End-user
- 9.1 Market segments
- Chart on End-user - Market share 2024-2029 (%)
- Data Table on End-user - Market share 2024-2029 (%)
- 9.2 Comparison by End-user
- Chart on Comparison by End-user
- Data Table on Comparison by End-user
- 9.3 Professionals - Market size and forecast 2024-2029
- Chart on Professionals - Market size and forecast 2024-2029 ($ thousand)
- Data Table on Professionals - Market size and forecast 2024-2029 ($ thousand)
- Chart on Professionals - Year-over-year growth 2024-2029 (%)
- Data Table on Professionals - Year-over-year growth 2024-2029 (%)
- 9.4 Hobbyists - Market size and forecast 2024-2029
- Chart on Hobbyists - Market size and forecast 2024-2029 ($ thousand)
- Data Table on Hobbyists - Market size and forecast 2024-2029 ($ thousand)
- Chart on Hobbyists - Year-over-year growth 2024-2029 (%)
- Data Table on Hobbyists - Year-over-year growth 2024-2029 (%)
- 9.5 Market opportunity by End-user
- Market opportunity by End-user ($ thousand)
- Data Table on Market opportunity by End-user ($ thousand)
10 Market Segmentation by Connectivity
- 10.1 Market segments
- Chart on Connectivity - Market share 2024-2029 (%)
- Data Table on Connectivity - Market share 2024-2029 (%)
- 10.2 Comparison by Connectivity
- Chart on Comparison by Connectivity
- Data Table on Comparison by Connectivity
- 10.3 Bluetooth - Market size and forecast 2024-2029
- Chart on Bluetooth - Market size and forecast 2024-2029 ($ thousand)
- Data Table on Bluetooth - Market size and forecast 2024-2029 ($ thousand)
- Chart on Bluetooth - Year-over-year growth 2024-2029 (%)
- Data Table on Bluetooth - Year-over-year growth 2024-2029 (%)
- 10.4 Wi-Fi - Market size and forecast 2024-2029
- Chart on Wi-Fi - Market size and forecast 2024-2029 ($ thousand)
- Data Table on Wi-Fi - Market size and forecast 2024-2029 ($ thousand)
- Chart on Wi-Fi - Year-over-year growth 2024-2029 (%)
- Data Table on Wi-Fi - Year-over-year growth 2024-2029 (%)
- 10.5 App-integrated devices - Market size and forecast 2024-2029
- Chart on App-integrated devices - Market size and forecast 2024-2029 ($ thousand)
- Data Table on App-integrated devices - Market size and forecast 2024-2029 ($ thousand)
- Chart on App-integrated devices - Year-over-year growth 2024-2029 (%)
- Data Table on App-integrated devices - Year-over-year growth 2024-2029 (%)
- 10.6 USB - Market size and forecast 2024-2029
- Chart on USB - Market size and forecast 2024-2029 ($ thousand)
- Data Table on USB - Market size and forecast 2024-2029 ($ thousand)
- Chart on USB - Year-over-year growth 2024-2029 (%)
- Data Table on USB - Year-over-year growth 2024-2029 (%)
- 10.7 Market opportunity by Connectivity
- Market opportunity by Connectivity ($ thousand)
- Data Table on Market opportunity by Connectivity ($ thousand)
11 Customer Landscape
- 11.1 Customer landscape overview
- Analysis of price sensitivity, lifecycle, customer purchase basket, adoption rates, and purchase criteria
12 Geographic Landscape
- 12.1 Geographic segmentation
- Chart on Market share By Geographical Landscape 2024-2029 (%)
- Data Table on Market share By Geographical Landscape 2024-2029 (%)
- 12.2 Geographic comparison
- Chart on Geographic comparison
- Data Table on Geographic comparison
- 12.3 North America - Market size and forecast 2024-2029
- Chart on North America - Market size and forecast 2024-2029 ($ thousand)
- Data Table on North America - Market size and forecast 2024-2029 ($ thousand)
- Chart on North America - Year-over-year growth 2024-2029 (%)
- Data Table on North America - Year-over-year growth 2024-2029 (%)
- 12.4 APAC - Market size and forecast 2024-2029
- Chart on APAC - Market size and forecast 2024-2029 ($ thousand)
- Data Table on APAC - Market size and forecast 2024-2029 ($ thousand)
- Chart on APAC - Year-over-year growth 2024-2029 (%)
- Data Table on APAC - Year-over-year growth 2024-2029 (%)
- 12.5 Europe - Market size and forecast 2024-2029
- Chart on Europe - Market size and forecast 2024-2029 ($ thousand)
- Data Table on Europe - Market size and forecast 2024-2029 ($ thousand)
- Chart on Europe - Year-over-year growth 2024-2029 (%)
- Data Table on Europe - Year-over-year growth 2024-2029 (%)
- 12.6 South America - Market size and forecast 2024-2029
- Chart on South America - Market size and forecast 2024-2029 ($ thousand)
- Data Table on South America - Market size and forecast 2024-2029 ($ thousand)
- Chart on South America - Year-over-year growth 2024-2029 (%)
- Data Table on South America - Year-over-year growth 2024-2029 (%)
- 12.7 Middle East and Africa - Market size and forecast 2024-2029
- Chart on Middle East and Africa - Market size and forecast 2024-2029 ($ thousand)
- Data Table on Middle East and Africa - Market size and forecast 2024-2029 ($ thousand)
- Chart on Middle East and Africa - Year-over-year growth 2024-2029 (%)
- Data Table on Middle East and Africa - Year-over-year growth 2024-2029 (%)
- 12.8 US - Market size and forecast 2024-2029
- Chart on US - Market size and forecast 2024-2029 ($ thousand)
- Data Table on US - Market size and forecast 2024-2029 ($ thousand)
- Chart on US - Year-over-year growth 2024-2029 (%)
- Data Table on US - Year-over-year growth 2024-2029 (%)
- 12.9 China - Market size and forecast 2024-2029
- Chart on China - Market size and forecast 2024-2029 ($ thousand)
- Data Table on China - Market size and forecast 2024-2029 ($ thousand)
- Chart on China - Year-over-year growth 2024-2029 (%)
- Data Table on China - Year-over-year growth 2024-2029 (%)
- 12.10 Canada - Market size and forecast 2024-2029
- Chart on Canada - Market size and forecast 2024-2029 ($ thousand)
- Data Table on Canada - Market size and forecast 2024-2029 ($ thousand)
- Chart on Canada - Year-over-year growth 2024-2029 (%)
- Data Table on Canada - Year-over-year growth 2024-2029 (%)
- 12.11 Germany - Market size and forecast 2024-2029
- Chart on Germany - Market size and forecast 2024-2029 ($ thousand)
- Data Table on Germany - Market size and forecast 2024-2029 ($ thousand)
- Chart on Germany - Year-over-year growth 2024-2029 (%)
- Data Table on Germany - Year-over-year growth 2024-2029 (%)
- 12.12 Japan - Market size and forecast 2024-2029
- Chart on Japan - Market size and forecast 2024-2029 ($ thousand)
- Data Table on Japan - Market size and forecast 2024-2029 ($ thousand)
- Chart on Japan - Year-over-year growth 2024-2029 (%)
- Data Table on Japan - Year-over-year growth 2024-2029 (%)
- 12.13 India - Market size and forecast 2024-2029
- Chart on India - Market size and forecast 2024-2029 ($ thousand)
- Data Table on India - Market size and forecast 2024-2029 ($ thousand)
- Chart on India - Year-over-year growth 2024-2029 (%)
- Data Table on India - Year-over-year growth 2024-2029 (%)
- 12.14 UK - Market size and forecast 2024-2029
- Chart on UK - Market size and forecast 2024-2029 ($ thousand)
- Data Table on UK - Market size and forecast 2024-2029 ($ thousand)
- Chart on UK - Year-over-year growth 2024-2029 (%)
- Data Table on UK - Year-over-year growth 2024-2029 (%)
- 12.15 Mexico - Market size and forecast 2024-2029
- Chart on Mexico - Market size and forecast 2024-2029 ($ thousand)
- Data Table on Mexico - Market size and forecast 2024-2029 ($ thousand)
- Chart on Mexico - Year-over-year growth 2024-2029 (%)
- Data Table on Mexico - Year-over-year growth 2024-2029 (%)
- 12.16 France - Market size and forecast 2024-2029
- Chart on France - Market size and forecast 2024-2029 ($ thousand)
- Data Table on France - Market size and forecast 2024-2029 ($ thousand)
- Chart on France - Year-over-year growth 2024-2029 (%)
- Data Table on France - Year-over-year growth 2024-2029 (%)
- 12.17 South Korea - Market size and forecast 2024-2029
- Chart on South Korea - Market size and forecast 2024-2029 ($ thousand)
- Data Table on South Korea - Market size and forecast 2024-2029 ($ thousand)
- Chart on South Korea - Year-over-year growth 2024-2029 (%)
- Data Table on South Korea - Year-over-year growth 2024-2029 (%)
- 12.18 Market opportunity By Geographical Landscape
- Market opportunity By Geographical Landscape ($ thousand)
- Data Tables on Market opportunity By Geographical Landscape ($ thousand)
13 Drivers, Challenges, and Opportunity/Restraints
- 13.1 Market drivers
- 13.2 Market challenges
- 13.3 Impact of drivers and challenges
- Impact of drivers and challenges in 2024 and 2029
- 13.4 Market opportunities/restraints
14 Competitive Landscape
- 14.1 Overview
- 14.2 Competitive Landscape
- Overview on criticality of inputs and factors of differentiation
- 14.3 Landscape disruption
- Overview on factors of disruption
- 14.4 Industry risks
- Impact of key risks on business
15 Competitive Analysis
- 15.1 Companies profiled
- Companies covered
- 15.2 Company ranking index
- Company ranking index
- 15.3 Market positioning of companies
- Matrix on companies position and classification
- 15.4 Artiphon Inc.
- Artiphon Inc. - Overview
- Artiphon Inc. - Product / Service
- Artiphon Inc. - Key offerings
- SWOT
- 15.5 Audiotonix Ltd.
- Audiotonix Ltd. - Overview
- Audiotonix Ltd. - Product / Service
- Audiotonix Ltd. - Key offerings
- SWOT
- 15.6 CASIO Computer Co. Ltd.
- CASIO Computer Co. Ltd. - Overview
- CASIO Computer Co. Ltd. - Business segments
- CASIO Computer Co. Ltd. - Key offerings
- CASIO Computer Co. Ltd. - Segment focus
- SWOT
- 15.7 CME PTE. LTD.
- CME PTE. LTD. - Overview
- CME PTE. LTD. - Product / Service
- CME PTE. LTD. - Key offerings
- SWOT
- 15.8 HyVibe
- HyVibe - Overview
- HyVibe - Product / Service
- HyVibe - Key offerings
- SWOT
- 15.9 inMusic Brands Inc.
- inMusic Brands Inc. - Overview
- inMusic Brands Inc. - Product / Service
- inMusic Brands Inc. - Key offerings
- SWOT
- 15.10 Kawai Musical Instruments Mfg. Co. Ltd.
- Kawai Musical Instruments Mfg. Co. Ltd. - Overview
- Kawai Musical Instruments Mfg. Co. Ltd. - Product / Service
- Kawai Musical Instruments Mfg. Co. Ltd. - Key offerings
- SWOT
- 15.11 Kickstarter PBC
- Kickstarter PBC - Overview
- Kickstarter PBC - Product / Service
- Kickstarter PBC - Key offerings
- SWOT
- 15.12 Kurv Music Ltd.
- Kurv Music Ltd. - Overview
- Kurv Music Ltd. - Product / Service
- Kurv Music Ltd. - Key offerings
- SWOT
- 15.13 Roland Corp.
- Roland Corp. - Overview
- Roland Corp. - Product / Service
- Roland Corp. - Key news
- Roland Corp. - Key offerings
- SWOT
- 15.14 Steinway Inc.
- Steinway Inc. - Overview
- Steinway Inc. - Product / Service
- Steinway Inc. - Key offerings
- SWOT
- 15.15 The ONE Music Group
- The ONE Music Group - Overview
- The ONE Music Group - Product / Service
- The ONE Music Group - Key offerings
- SWOT
- 15.16 Xiaomi Inc.
- Xiaomi Inc. - Overview
- Xiaomi Inc. - Business segments
- Xiaomi Inc. - Key news
- Xiaomi Inc. - Key offerings
- Xiaomi Inc. - Segment focus
- SWOT
- 15.17 Yamaha Corp.
- Yamaha Corp. - Overview
- Yamaha Corp. - Business segments
- Yamaha Corp. - Key news
- Yamaha Corp. - Key offerings
- Yamaha Corp. - Segment focus
- SWOT
- 15.18 Zivix LLC
- Zivix LLC - Overview
- Zivix LLC - Product / Service
- Zivix LLC - Key offerings
- SWOT
16 Appendix
- 16.1 Scope of the report
- 16.2 Inclusions and exclusions checklist
- Inclusions checklist
- Exclusions checklist
- 16.3 Currency conversion rates for US$
- Currency conversion rates for US$
- 16.4 Research methodology
- Research methodology
- 16.5 Data procurement
- Information sources
- 16.6 Data validation
- Data validation
- 16.7 Validation techniques employed for market sizing
- Validation techniques employed for market sizing
- 16.8 Data synthesis
- Data synthesis
- 16.9 360 degree market analysis
- 360 degree market analysis
- 16.10 List of abbreviations
- List of abbreviations

