|
|
市場調査レポート
商品コード
1626774
生物製剤開発製造受託機関(CDMO)の世界市場、2025~2029年Global Biologics Contract Development and Manufacturing Organization (CDMO) Market 2025-2029 |
||||||

|
|||||||
カスタマイズ可能
|
|||||||


| 生物製剤開発製造受託機関(CDMO)の世界市場、2025~2029年 |
|
出版日: 2024年12月25日
発行: TechNavio
ページ情報: 英文 196 Pages
納期: 即納可能
|

全表示
- 概要
- 図表
- 目次
生物製剤開発製造受託機関(CDMO)市場、2025~2029年
生物製剤開発製造受託機関(CDMO)市場は2024~2029年に163億2,460万米ドル、予測期間中のCAGRは13.7%で成長すると予測されます。当レポートでは、生物製剤開発製造受託機関(CDMO)市場の全体的な分析、市場規模・予測、動向、成長促進要因、課題、約25のベンダーを網羅したベンダー分析などを掲載しています。
現在の市場シナリオ、最新動向と促進要因、市場環境全体に関する最新分析を提供しています。新興国市場におけるコスト効率の高いリソースの利用可能性、生物製剤治療の強力な研究開発パイプライン、コアコンピタンスに集中する必要性の高まりなどが市場を牽引しています。
| 市場範囲 | |
|---|---|
| 基準年 | 2025年 |
| 終了年 | 2029年 |
| 予測期間 | 2025~2029年 |
| 成長モメンタム | 加速 |
| 前年比[2025年] | 11% |
| CAGR | 13.7% |
| 増分額 | 163億2,460万米ドル |
本調査では、ビッグデータの出現が今後数年間の生物製剤開発製造受託機関(CDMO)市場成長を牽引する主要因の1つであるとしています。また、cdmoベンダーと製薬企業との戦略的提携やパートナーシップ、新規分子やバイオシミラーの承認増加も、市場の大きな需要につながると考えられます。
目次
第1章 エグゼクティブサマリー
- 市場概要
第2章 Technavio分析
- 価格・ライフサイクル・顧客購入バスケット・採用率・購入基準の分析
- インプットの重要性と差別化の要因
- 混乱の要因
- 促進要因と課題の影響
第3章 市場情勢
- 市場エコシステム
- 市場の特徴
- バリューチェーン分析
第4章 市場規模
- 市場の定義
- 市場セグメント分析
- 市場規模 2024年
- 市場の展望 2024~2029年
第5章 市場規模実績
- 生物製剤開発製造受託機関(CDMO)の世界市場 2019~2023年
- タイプ別セグメント分析 2019~2023年
- 製品タイプ別セグメント分析 2019~2023年
- 地域別セグメント分析 2019~2023年
- 国別セグメント分析 2019~2023年
第6章 定性分析
- AIの影響:生物製剤開発製造受託機関(CDMO)の世界市場
第7章 ファイブフォース分析
- ファイブフォースの要約
- 買い手の交渉力
- 供給企業の交渉力
- 新規参入業者の脅威
- 代替品の脅威
- 競争の脅威
- 市況
第8章 市場セグメンテーション:タイプ別
- 市場セグメント
- 比較:タイプ別
- 哺乳類:市場規模と予測 2024~2029年
- 微生物:市場規模と予測 2024~2029年
- 市場機会:タイプ別
第9章 市場セグメンテーション:製品タイプ別
- 市場セグメント
- 比較:製品タイプ別
- 生物製剤:市場規模と予測 2024~2029年
- バイオシミラー:市場規模と予測 2024~2029年
- 市場機会:製品タイプ別
第10章 顧客情勢
- 顧客情勢概要
第11章 地域別情勢
- 地域別セグメンテーション
- 比較:地域別
- 北米:市場規模と予測 2024~2029年
- 欧州:市場規模と予測 2024~2029年
- アジア:市場規模と予測 2024~2029年
- その他:市場規模と予測 2024~2029年
- 米国:市場規模と予測 2024~2029年
- ドイツ:市場規模と予測 2024~2029年
- カナダ:市場規模と予測 2024~2029年
- フランス:市場規模と予測 2024~2029年
- 中国:市場規模と予測 2024~2029年
- 英国:市場規模と予測 2024~2029年
- 日本:市場規模と予測 2024~2029年
- イタリア:市場規模と予測 2024~2029年
- インド:市場規模と予測 2024~2029年
- 韓国:市場規模と予測 2024~2029年
- 地域情勢による市場機会
第12章 促進要因・課題・機会・抑制要因
- 市場促進要因
- 市場課題
- 促進要因と課題の影響
- 市場機会・抑制要因
第13章 競合情勢
- 概要
- 競合情勢
- 混乱の状況
- 産業のリスク
第14章 競合分析
- 企業プロファイル
- 企業ランキング指数
- 企業の市場ポジショニング
- AbbVie Inc.
- Binex Co. Ltd.
- Boehringer Ingelheim International GmbH
- Bora Pharmaceuticals
- Catalent Inc.
- Evonik Industries AG
- FUJIFILM Corp.
- Grifols SA
- J RETTENMAIER and SOHNE GmbH and Co KG
- Lonza Group Ltd.
- Novartis AG
- Rentschler Biopharma SE
- Samsung Electronics Co. Ltd.
- Toyobo Co. Ltd.
- WuXi Biologics Cayman Inc.
第15章 付録
Exhibits:
- Exhibits1: Executive Summary - Chart on Market Overview
- Exhibits2: Executive Summary - Data Table on Market Overview
- Exhibits3: Executive Summary - Chart on Global Market Characteristics
- Exhibits4: Executive Summary - Chart on Market By Geographical Landscape
- Exhibits5: Executive Summary - Chart on Market Segmentation by Type
- Exhibits6: Executive Summary - Chart on Market Segmentation by Product Type
- Exhibits7: Executive Summary - Chart on Incremental Growth
- Exhibits8: Executive Summary - Data Table on Incremental Growth
- Exhibits9: Executive Summary - Chart on Company Market Positioning
- Exhibits10: Analysis of price sensitivity, lifecycle, customer purchase basket, adoption rates, and purchase criteria
- Exhibits11: Overview on criticality of inputs and factors of differentiation
- Exhibits12: Overview on factors of disruption
- Exhibits13: Impact of drivers and challenges in 2024 and 2029
- Exhibits14: Parent Market
- Exhibits15: Data Table on - Parent Market
- Exhibits16: Market characteristics analysis
- Exhibits17: Value chain analysis
- Exhibits18: Offerings of companies included in the market definition
- Exhibits19: Market segments
- Exhibits20: Chart on Global - Market size and forecast 2024-2029 ($ million)
- Exhibits21: Data Table on Global - Market size and forecast 2024-2029 ($ million)
- Exhibits22: Chart on Global Market: Year-over-year growth 2024-2029 (%)
- Exhibits23: Data Table on Global Market: Year-over-year growth 2024-2029 (%)
- Exhibits24: Historic Market Size - Data Table on Global Biologics Contract Development And Manufacturing Organization (CDMO) Market 2019 - 2023 ($ million)
- Exhibits25: Historic Market Size - Type Segment 2019 - 2023 ($ million)
- Exhibits26: Historic Market Size - Product Type Segment 2019 - 2023 ($ million)
- Exhibits27: Historic Market Size - Geography Segment 2019 - 2023 ($ million)
- Exhibits28: Historic Market Size - Country Segment 2019 - 2023 ($ million)
- Exhibits29: Five forces analysis - Comparison between 2024 and 2029
- Exhibits30: Bargaining power of buyers - Impact of key factors 2024 and 2029
- Exhibits31: Bargaining power of suppliers - Impact of key factors in 2024 and 2029
- Exhibits32: Threat of new entrants - Impact of key factors in 2024 and 2029
- Exhibits33: Threat of substitutes - Impact of key factors in 2024 and 2029
- Exhibits34: Threat of rivalry - Impact of key factors in 2024 and 2029
- Exhibits35: Chart on Market condition - Five forces 2024 and 2029
- Exhibits36: Chart on Type - Market share 2024-2029 (%)
- Exhibits37: Data Table on Type - Market share 2024-2029 (%)
- Exhibits38: Chart on Comparison by Type
- Exhibits39: Data Table on Comparison by Type
- Exhibits40: Chart on Mammalian - Market size and forecast 2024-2029 ($ million)
- Exhibits41: Data Table on Mammalian - Market size and forecast 2024-2029 ($ million)
- Exhibits42: Chart on Mammalian - Year-over-year growth 2024-2029 (%)
- Exhibits43: Data Table on Mammalian - Year-over-year growth 2024-2029 (%)
- Exhibits44: Chart on Microbial - Market size and forecast 2024-2029 ($ million)
- Exhibits45: Data Table on Microbial - Market size and forecast 2024-2029 ($ million)
- Exhibits46: Chart on Microbial - Year-over-year growth 2024-2029 (%)
- Exhibits47: Data Table on Microbial - Year-over-year growth 2024-2029 (%)
- Exhibits48: Market opportunity by Type ($ million)
- Exhibits49: Data Table on Market opportunity by Type ($ million)
- Exhibits50: Chart on Product Type - Market share 2024-2029 (%)
- Exhibits51: Data Table on Product Type - Market share 2024-2029 (%)
- Exhibits52: Chart on Comparison by Product Type
- Exhibits53: Data Table on Comparison by Product Type
- Exhibits54: Chart on Biologics - Market size and forecast 2024-2029 ($ million)
- Exhibits55: Data Table on Biologics - Market size and forecast 2024-2029 ($ million)
- Exhibits56: Chart on Biologics - Year-over-year growth 2024-2029 (%)
- Exhibits57: Data Table on Biologics - Year-over-year growth 2024-2029 (%)
- Exhibits58: Chart on Biosimilars - Market size and forecast 2024-2029 ($ million)
- Exhibits59: Data Table on Biosimilars - Market size and forecast 2024-2029 ($ million)
- Exhibits60: Chart on Biosimilars - Year-over-year growth 2024-2029 (%)
- Exhibits61: Data Table on Biosimilars - Year-over-year growth 2024-2029 (%)
- Exhibits62: Market opportunity by Product Type ($ million)
- Exhibits63: Data Table on Market opportunity by Product Type ($ million)
- Exhibits64: Analysis of price sensitivity, lifecycle, customer purchase basket, adoption rates, and purchase criteria
- Exhibits65: Chart on Market share By Geographical Landscape 2024-2029 (%)
- Exhibits66: Data Table on Market share By Geographical Landscape 2024-2029 (%)
- Exhibits67: Chart on Geographic comparison
- Exhibits68: Data Table on Geographic comparison
- Exhibits69: Chart on North America - Market size and forecast 2024-2029 ($ million)
- Exhibits70: Data Table on North America - Market size and forecast 2024-2029 ($ million)
- Exhibits71: Chart on North America - Year-over-year growth 2024-2029 (%)
- Exhibits72: Data Table on North America - Year-over-year growth 2024-2029 (%)
- Exhibits73: Chart on Europe - Market size and forecast 2024-2029 ($ million)
- Exhibits74: Data Table on Europe - Market size and forecast 2024-2029 ($ million)
- Exhibits75: Chart on Europe - Year-over-year growth 2024-2029 (%)
- Exhibits76: Data Table on Europe - Year-over-year growth 2024-2029 (%)
- Exhibits77: Chart on Asia - Market size and forecast 2024-2029 ($ million)
- Exhibits78: Data Table on Asia - Market size and forecast 2024-2029 ($ million)
- Exhibits79: Chart on Asia - Year-over-year growth 2024-2029 (%)
- Exhibits80: Data Table on Asia - Year-over-year growth 2024-2029 (%)
- Exhibits81: Chart on Rest of World (ROW) - Market size and forecast 2024-2029 ($ million)
- Exhibits82: Data Table on Rest of World (ROW) - Market size and forecast 2024-2029 ($ million)
- Exhibits83: Chart on Rest of World (ROW) - Year-over-year growth 2024-2029 (%)
- Exhibits84: Data Table on Rest of World (ROW) - Year-over-year growth 2024-2029 (%)
- Exhibits85: Chart on US - Market size and forecast 2024-2029 ($ million)
- Exhibits86: Data Table on US - Market size and forecast 2024-2029 ($ million)
- Exhibits87: Chart on US - Year-over-year growth 2024-2029 (%)
- Exhibits88: Data Table on US - Year-over-year growth 2024-2029 (%)
- Exhibits89: Chart on Germany - Market size and forecast 2024-2029 ($ million)
- Exhibits90: Data Table on Germany - Market size and forecast 2024-2029 ($ million)
- Exhibits91: Chart on Germany - Year-over-year growth 2024-2029 (%)
- Exhibits92: Data Table on Germany - Year-over-year growth 2024-2029 (%)
- Exhibits93: Chart on Canada - Market size and forecast 2024-2029 ($ million)
- Exhibits94: Data Table on Canada - Market size and forecast 2024-2029 ($ million)
- Exhibits95: Chart on Canada - Year-over-year growth 2024-2029 (%)
- Exhibits96: Data Table on Canada - Year-over-year growth 2024-2029 (%)
- Exhibits97: Chart on France - Market size and forecast 2024-2029 ($ million)
- Exhibits98: Data Table on France - Market size and forecast 2024-2029 ($ million)
- Exhibits99: Chart on France - Year-over-year growth 2024-2029 (%)
- Exhibits100: Data Table on France - Year-over-year growth 2024-2029 (%)
- Exhibits101: Chart on China - Market size and forecast 2024-2029 ($ million)
- Exhibits102: Data Table on China - Market size and forecast 2024-2029 ($ million)
- Exhibits103: Chart on China - Year-over-year growth 2024-2029 (%)
- Exhibits104: Data Table on China - Year-over-year growth 2024-2029 (%)
- Exhibits105: Chart on UK - Market size and forecast 2024-2029 ($ million)
- Exhibits106: Data Table on UK - Market size and forecast 2024-2029 ($ million)
- Exhibits107: Chart on UK - Year-over-year growth 2024-2029 (%)
- Exhibits108: Data Table on UK - Year-over-year growth 2024-2029 (%)
- Exhibits109: Chart on Japan - Market size and forecast 2024-2029 ($ million)
- Exhibits110: Data Table on Japan - Market size and forecast 2024-2029 ($ million)
- Exhibits111: Chart on Japan - Year-over-year growth 2024-2029 (%)
- Exhibits112: Data Table on Japan - Year-over-year growth 2024-2029 (%)
- Exhibits113: Chart on Italy - Market size and forecast 2024-2029 ($ million)
- Exhibits114: Data Table on Italy - Market size and forecast 2024-2029 ($ million)
- Exhibits115: Chart on Italy - Year-over-year growth 2024-2029 (%)
- Exhibits116: Data Table on Italy - Year-over-year growth 2024-2029 (%)
- Exhibits117: Chart on India - Market size and forecast 2024-2029 ($ million)
- Exhibits118: Data Table on India - Market size and forecast 2024-2029 ($ million)
- Exhibits119: Chart on India - Year-over-year growth 2024-2029 (%)
- Exhibits120: Data Table on India - Year-over-year growth 2024-2029 (%)
- Exhibits121: Chart on South Korea - Market size and forecast 2024-2029 ($ million)
- Exhibits122: Data Table on South Korea - Market size and forecast 2024-2029 ($ million)
- Exhibits123: Chart on South Korea - Year-over-year growth 2024-2029 (%)
- Exhibits124: Data Table on South Korea - Year-over-year growth 2024-2029 (%)
- Exhibits125: Market opportunity By Geographical Landscape ($ million)
- Exhibits126: Data Tables on Market opportunity By Geographical Landscape ($ million)
- Exhibits127: Impact of drivers and challenges in 2024 and 2029
- Exhibits128: Overview on criticality of inputs and factors of differentiation
- Exhibits129: Overview on factors of disruption
- Exhibits130: Impact of key risks on business
- Exhibits131: Companies covered
- Exhibits132: Company ranking index
- Exhibits133: Matrix on companies position and classification
- Exhibits134: AbbVie Inc. - Overview
- Exhibits135: AbbVie Inc. - Product / Service
- Exhibits136: AbbVie Inc. - Key news
- Exhibits137: AbbVie Inc. - Key offerings
- Exhibits138: SWOT
- Exhibits139: Binex Co. Ltd. - Overview
- Exhibits140: Binex Co. Ltd. - Product / Service
- Exhibits141: Binex Co. Ltd. - Key offerings
- Exhibits142: SWOT
- Exhibits143: Boehringer Ingelheim International GmbH - Overview
- Exhibits144: Boehringer Ingelheim International GmbH - Product / Service
- Exhibits145: Boehringer Ingelheim International GmbH - Key news
- Exhibits146: Boehringer Ingelheim International GmbH - Key offerings
- Exhibits147: SWOT
- Exhibits148: Bora Pharmaceuticals - Overview
- Exhibits149: Bora Pharmaceuticals - Product / Service
- Exhibits150: Bora Pharmaceuticals - Key offerings
- Exhibits151: SWOT
- Exhibits152: Catalent Inc. - Overview
- Exhibits153: Catalent Inc. - Business segments
- Exhibits154: Catalent Inc. - Key offerings
- Exhibits155: Catalent Inc. - Segment focus
- Exhibits156: SWOT
- Exhibits157: Evonik Industries AG - Overview
- Exhibits158: Evonik Industries AG - Business segments
- Exhibits159: Evonik Industries AG - Key news
- Exhibits160: Evonik Industries AG - Key offerings
- Exhibits161: Evonik Industries AG - Segment focus
- Exhibits162: SWOT
- Exhibits163: FUJIFILM Corp. - Overview
- Exhibits164: FUJIFILM Corp. - Business segments
- Exhibits165: FUJIFILM Corp. - Key news
- Exhibits166: FUJIFILM Corp. - Key offerings
- Exhibits167: FUJIFILM Corp. - Segment focus
- Exhibits168: SWOT
- Exhibits169: Grifols SA - Overview
- Exhibits170: Grifols SA - Business segments
- Exhibits171: Grifols SA - Key news
- Exhibits172: Grifols SA - Key offerings
- Exhibits173: Grifols SA - Segment focus
- Exhibits174: SWOT
- Exhibits175: J RETTENMAIER and SOHNE GmbH and Co KG - Overview
- Exhibits176: J RETTENMAIER and SOHNE GmbH and Co KG - Product / Service
- Exhibits177: J RETTENMAIER and SOHNE GmbH and Co KG - Key offerings
- Exhibits178: SWOT
- Exhibits179: Lonza Group Ltd. - Overview
- Exhibits180: Lonza Group Ltd. - Business segments
- Exhibits181: Lonza Group Ltd. - Key news
- Exhibits182: Lonza Group Ltd. - Key offerings
- Exhibits183: Lonza Group Ltd. - Segment focus
- Exhibits184: SWOT
- Exhibits185: Novartis AG - Overview
- Exhibits186: Novartis AG - Business segments
- Exhibits187: Novartis AG - Key news
- Exhibits188: Novartis AG - Key offerings
- Exhibits189: Novartis AG - Segment focus
- Exhibits190: SWOT
- Exhibits191: Rentschler Biopharma SE - Overview
- Exhibits192: Rentschler Biopharma SE - Product / Service
- Exhibits193: Rentschler Biopharma SE - Key offerings
- Exhibits194: SWOT
- Exhibits195: Samsung Electronics Co. Ltd. - Overview
- Exhibits196: Samsung Electronics Co. Ltd. - Business segments
- Exhibits197: Samsung Electronics Co. Ltd. - Key news
- Exhibits198: Samsung Electronics Co. Ltd. - Key offerings
- Exhibits199: Samsung Electronics Co. Ltd. - Segment focus
- Exhibits200: SWOT
- Exhibits201: Toyobo Co. Ltd. - Overview
- Exhibits202: Toyobo Co. Ltd. - Business segments
- Exhibits203: Toyobo Co. Ltd. - Key news
- Exhibits204: Toyobo Co. Ltd. - Key offerings
- Exhibits205: Toyobo Co. Ltd. - Segment focus
- Exhibits206: SWOT
- Exhibits207: WuXi Biologics Cayman Inc. - Overview
- Exhibits208: WuXi Biologics Cayman Inc. - Product / Service
- Exhibits209: WuXi Biologics Cayman Inc. - Key offerings
- Exhibits210: SWOT
- Exhibits211: Inclusions checklist
- Exhibits212: Exclusions checklist
- Exhibits213: Currency conversion rates for US$
- Exhibits214: Research methodology
- Exhibits215: Information sources
- Exhibits216: Data validation
- Exhibits217: Validation techniques employed for market sizing
- Exhibits218: Data synthesis
- Exhibits219: 360 degree market analysis
- Exhibits220: List of abbreviations
Biologics Contract Development And Manufacturing Organization (CDMO) Market 2025-2029
The biologics contract development and manufacturing organization (CDMO) market is forecasted to grow by USD 16324.6 mn during 2024-2029, accelerating at a CAGR of 13.7% during the forecast period. The report on the biologics contract development and manufacturing organization (CDMO) market provides a holistic analysis, market size and forecast, trends, growth drivers, and challenges, as well as vendor analysis covering around 25 vendors.
The report offers an up-to-date analysis regarding the current market scenario, the latest trends and drivers, and the overall market environment. The market is driven by availability of cost-efficient resources in emerging markets, strong research and development pipeline of biologics therapeutics, and growing need to focus on core competencies.
| Market Scope | |
|---|---|
| Base Year | 2025 |
| End Year | 2029 |
| Series Year | 2025-2029 |
| Growth Momentum | Accelerate |
| YOY 2025 | 11% |
| CAGR | 13.7% |
| Incremental Value | $16324.6 mn |
Technavio's biologics contract development and manufacturing organization (CDMO) market is segmented as below:
By Type
- Mammalian
- Microbial
By Product Type
- Biologics
- Biosimilars
By Geographical Landscape
- North America
- Europe
- Asia
- Rest of World (ROW)
This study identifies the advent of big data as one of the prime reasons driving the biologics contract development and manufacturing organization (CDMO) market growth during the next few years. Also, strategic alliances and partnerships of cdmo vendors with pharma companies and increasing approvals for new molecules and biosimilars will lead to sizable demand in the market.
The report on the biologics contract development and manufacturing organization (CDMO) market covers the following areas:
- Biologics Contract Development And Manufacturing Organization (CDMO) Market sizing
- Biologics Contract Development And Manufacturing Organization (CDMO) Market forecast
- Biologics Contract Development And Manufacturing Organization (CDMO) Market industry analysis
The robust vendor analysis is designed to help clients improve their market position, and in line with this, this report provides a detailed analysis of several leading biologics contract development and manufacturing organization (CDMO) market vendors that include 3P Biopharmaceuticals, AbbVie Inc., AGC Biologics, Binex Co. Ltd., Boehringer Ingelheim International GmbH, Bora Pharmaceuticals, Catalent Inc., Evonik Industries AG, FUJIFILM Corp., Grifols SA, J RETTENMAIER and SOHNE GmbH and Co KG, JSR Corp., Kemwell Biopharma Pvt. Ltd., Lonza Group Ltd., Novartis AG, Rentschler Biopharma SE, Samsung Electronics Co. Ltd., Shenzhen Hepalink Pharmaceutical Co. Ltd., Toyobo Co. Ltd., and WuXi Biologics Cayman Inc.. Also, the biologics contract development and manufacturing organization (CDMO) market analysis report includes information on upcoming trends and challenges that will influence market growth. This is to help companies strategize and leverage all forthcoming growth opportunities.
The study was conducted using an objective combination of primary and secondary information including inputs from key participants in the industry. The report contains a comprehensive market and vendor landscape in addition to an analysis of the key vendors.
The publisher presents a detailed picture of the market by the way of study, synthesis, and summation of data from multiple sources by an analysis of key parameters such as profit, pricing, competition, and promotions. It presents various market facets by identifying the key industry influencers. The data presented is comprehensive, reliable, and a result of extensive primary and secondary research. The market research reports provide a complete competitive landscape and an in-depth vendor selection methodology and analysis using qualitative and quantitative research to forecast accurate market growth.
Table of Contents
1 Executive Summary
- 1.1 Market overview
- Executive Summary - Chart on Market Overview
- Executive Summary - Data Table on Market Overview
- Executive Summary - Chart on Global Market Characteristics
- Executive Summary - Chart on Market By Geographical Landscape
- Executive Summary - Chart on Market Segmentation by Type
- Executive Summary - Chart on Market Segmentation by Product Type
- Executive Summary - Chart on Incremental Growth
- Executive Summary - Data Table on Incremental Growth
- Executive Summary - Chart on Company Market Positioning
2 Technavio Analysis
- 2.1 Analysis of price sensitivity, lifecycle, customer purchase basket, adoption rates, and purchase criteria
- Analysis of price sensitivity, lifecycle, customer purchase basket, adoption rates, and purchase criteria
- 2.2 Criticality of inputs and Factors of differentiation
- Overview on criticality of inputs and factors of differentiation
- 2.3 Factors of disruption
- Overview on factors of disruption
- 2.4 Impact of drivers and challenges
- Impact of drivers and challenges in 2024 and 2029
3 Market Landscape
- 3.1 Market ecosystem
- Parent Market
- Data Table on - Parent Market
- 3.2 Market characteristics
- Market characteristics analysis
- 3.3 Value chain analysis
- Value chain analysis
4 Market Sizing
- 4.1 Market definition
- Offerings of companies included in the market definition
- 4.2 Market segment analysis
- Market segments
- 4.3 Market size 2024
- 4.4 Market outlook: Forecast for 2024-2029
- Chart on Global - Market size and forecast 2024-2029 ($ million)
- Data Table on Global - Market size and forecast 2024-2029 ($ million)
- Chart on Global Market: Year-over-year growth 2024-2029 (%)
- Data Table on Global Market: Year-over-year growth 2024-2029 (%)
5 Historic Market Size
- 5.1 Global Biologics Contract Development And Manufacturing Organization (CDMO) Market 2019 - 2023
- Historic Market Size - Data Table on Global Biologics Contract Development And Manufacturing Organization (CDMO) Market 2019 - 2023 ($ million)
- 5.2 Type segment analysis 2019 - 2023
- Historic Market Size - Type Segment 2019 - 2023 ($ million)
- 5.3 Product Type segment analysis 2019 - 2023
- Historic Market Size - Product Type Segment 2019 - 2023 ($ million)
- 5.4 Geography segment analysis 2019 - 2023
- Historic Market Size - Geography Segment 2019 - 2023 ($ million)
- 5.5 Country segment analysis 2019 - 2023
- Historic Market Size - Country Segment 2019 - 2023 ($ million)
6 Qualitative Analysis
- 6.1 Impact of AI on the Global Biologics Contract Development and Manufacturing Organization (CDMO) Market
7 Five Forces Analysis
- 7.1 Five forces summary
- Five forces analysis - Comparison between 2024 and 2029
- 7.2 Bargaining power of buyers
- Bargaining power of buyers - Impact of key factors 2024 and 2029
- 7.3 Bargaining power of suppliers
- Bargaining power of suppliers - Impact of key factors in 2024 and 2029
- 7.4 Threat of new entrants
- Threat of new entrants - Impact of key factors in 2024 and 2029
- 7.5 Threat of substitutes
- Threat of substitutes - Impact of key factors in 2024 and 2029
- 7.6 Threat of rivalry
- Threat of rivalry - Impact of key factors in 2024 and 2029
- 7.7 Market condition
- Chart on Market condition - Five forces 2024 and 2029
8 Market Segmentation by Type
- 8.1 Market segments
- Chart on Type - Market share 2024-2029 (%)
- Data Table on Type - Market share 2024-2029 (%)
- 8.2 Comparison by Type
- Chart on Comparison by Type
- Data Table on Comparison by Type
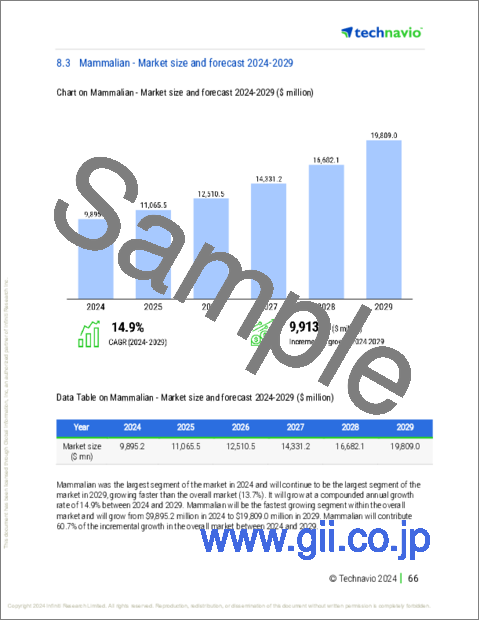
- 8.3 Mammalian - Market size and forecast 2024-2029
- Chart on Mammalian - Market size and forecast 2024-2029 ($ million)
- Data Table on Mammalian - Market size and forecast 2024-2029 ($ million)
- Chart on Mammalian - Year-over-year growth 2024-2029 (%)
- Data Table on Mammalian - Year-over-year growth 2024-2029 (%)
- 8.4 Microbial - Market size and forecast 2024-2029
- Chart on Microbial - Market size and forecast 2024-2029 ($ million)
- Data Table on Microbial - Market size and forecast 2024-2029 ($ million)
- Chart on Microbial - Year-over-year growth 2024-2029 (%)
- Data Table on Microbial - Year-over-year growth 2024-2029 (%)
- 8.5 Market opportunity by Type
- Market opportunity by Type ($ million)
- Data Table on Market opportunity by Type ($ million)
9 Market Segmentation by Product Type
- 9.1 Market segments
- Chart on Product Type - Market share 2024-2029 (%)
- Data Table on Product Type - Market share 2024-2029 (%)
- 9.2 Comparison by Product Type
- Chart on Comparison by Product Type
- Data Table on Comparison by Product Type
- 9.3 Biologics - Market size and forecast 2024-2029
- Chart on Biologics - Market size and forecast 2024-2029 ($ million)
- Data Table on Biologics - Market size and forecast 2024-2029 ($ million)
- Chart on Biologics - Year-over-year growth 2024-2029 (%)
- Data Table on Biologics - Year-over-year growth 2024-2029 (%)
- 9.4 Biosimilars - Market size and forecast 2024-2029
- Chart on Biosimilars - Market size and forecast 2024-2029 ($ million)
- Data Table on Biosimilars - Market size and forecast 2024-2029 ($ million)
- Chart on Biosimilars - Year-over-year growth 2024-2029 (%)
- Data Table on Biosimilars - Year-over-year growth 2024-2029 (%)
- 9.5 Market opportunity by Product Type
- Market opportunity by Product Type ($ million)
- Data Table on Market opportunity by Product Type ($ million)
10 Customer Landscape
- 10.1 Customer landscape overview
- Analysis of price sensitivity, lifecycle, customer purchase basket, adoption rates, and purchase criteria
11 Geographic Landscape
- 11.1 Geographic segmentation
- Chart on Market share By Geographical Landscape 2024-2029 (%)
- Data Table on Market share By Geographical Landscape 2024-2029 (%)
- 11.2 Geographic comparison
- Chart on Geographic comparison
- Data Table on Geographic comparison
- 11.3 North America - Market size and forecast 2024-2029
- Chart on North America - Market size and forecast 2024-2029 ($ million)
- Data Table on North America - Market size and forecast 2024-2029 ($ million)
- Chart on North America - Year-over-year growth 2024-2029 (%)
- Data Table on North America - Year-over-year growth 2024-2029 (%)
- 11.4 Europe - Market size and forecast 2024-2029
- Chart on Europe - Market size and forecast 2024-2029 ($ million)
- Data Table on Europe - Market size and forecast 2024-2029 ($ million)
- Chart on Europe - Year-over-year growth 2024-2029 (%)
- Data Table on Europe - Year-over-year growth 2024-2029 (%)
- 11.5 Asia - Market size and forecast 2024-2029
- Chart on Asia - Market size and forecast 2024-2029 ($ million)
- Data Table on Asia - Market size and forecast 2024-2029 ($ million)
- Chart on Asia - Year-over-year growth 2024-2029 (%)
- Data Table on Asia - Year-over-year growth 2024-2029 (%)
- 11.6 Rest of World (ROW) - Market size and forecast 2024-2029
- Chart on Rest of World (ROW) - Market size and forecast 2024-2029 ($ million)
- Data Table on Rest of World (ROW) - Market size and forecast 2024-2029 ($ million)
- Chart on Rest of World (ROW) - Year-over-year growth 2024-2029 (%)
- Data Table on Rest of World (ROW) - Year-over-year growth 2024-2029 (%)
- 11.7 US - Market size and forecast 2024-2029
- Chart on US - Market size and forecast 2024-2029 ($ million)
- Data Table on US - Market size and forecast 2024-2029 ($ million)
- Chart on US - Year-over-year growth 2024-2029 (%)
- Data Table on US - Year-over-year growth 2024-2029 (%)
- 11.8 Germany - Market size and forecast 2024-2029
- Chart on Germany - Market size and forecast 2024-2029 ($ million)
- Data Table on Germany - Market size and forecast 2024-2029 ($ million)
- Chart on Germany - Year-over-year growth 2024-2029 (%)
- Data Table on Germany - Year-over-year growth 2024-2029 (%)
- 11.9 Canada - Market size and forecast 2024-2029
- Chart on Canada - Market size and forecast 2024-2029 ($ million)
- Data Table on Canada - Market size and forecast 2024-2029 ($ million)
- Chart on Canada - Year-over-year growth 2024-2029 (%)
- Data Table on Canada - Year-over-year growth 2024-2029 (%)
- 11.10 France - Market size and forecast 2024-2029
- Chart on France - Market size and forecast 2024-2029 ($ million)
- Data Table on France - Market size and forecast 2024-2029 ($ million)
- Chart on France - Year-over-year growth 2024-2029 (%)
- Data Table on France - Year-over-year growth 2024-2029 (%)
- 11.11 China - Market size and forecast 2024-2029
- Chart on China - Market size and forecast 2024-2029 ($ million)
- Data Table on China - Market size and forecast 2024-2029 ($ million)
- Chart on China - Year-over-year growth 2024-2029 (%)
- Data Table on China - Year-over-year growth 2024-2029 (%)
- 11.12 UK - Market size and forecast 2024-2029
- Chart on UK - Market size and forecast 2024-2029 ($ million)
- Data Table on UK - Market size and forecast 2024-2029 ($ million)
- Chart on UK - Year-over-year growth 2024-2029 (%)
- Data Table on UK - Year-over-year growth 2024-2029 (%)
- 11.13 Japan - Market size and forecast 2024-2029
- Chart on Japan - Market size and forecast 2024-2029 ($ million)
- Data Table on Japan - Market size and forecast 2024-2029 ($ million)
- Chart on Japan - Year-over-year growth 2024-2029 (%)
- Data Table on Japan - Year-over-year growth 2024-2029 (%)
- 11.14 Italy - Market size and forecast 2024-2029
- Chart on Italy - Market size and forecast 2024-2029 ($ million)
- Data Table on Italy - Market size and forecast 2024-2029 ($ million)
- Chart on Italy - Year-over-year growth 2024-2029 (%)
- Data Table on Italy - Year-over-year growth 2024-2029 (%)
- 11.15 India - Market size and forecast 2024-2029
- Chart on India - Market size and forecast 2024-2029 ($ million)
- Data Table on India - Market size and forecast 2024-2029 ($ million)
- Chart on India - Year-over-year growth 2024-2029 (%)
- Data Table on India - Year-over-year growth 2024-2029 (%)
- 11.16 South Korea - Market size and forecast 2024-2029
- Chart on South Korea - Market size and forecast 2024-2029 ($ million)
- Data Table on South Korea - Market size and forecast 2024-2029 ($ million)
- Chart on South Korea - Year-over-year growth 2024-2029 (%)
- Data Table on South Korea - Year-over-year growth 2024-2029 (%)
- 11.17 Market opportunity By Geographical Landscape
- Market opportunity By Geographical Landscape ($ million)
- Data Tables on Market opportunity By Geographical Landscape ($ million)
12 Drivers, Challenges, and Opportunity/Restraints
- 12.1 Market drivers
- 12.2 Market challenges
- 12.3 Impact of drivers and challenges
- Impact of drivers and challenges in 2024 and 2029
- 12.4 Market opportunities/restraints
13 Competitive Landscape
- 13.1 Overview
- 13.2 Competitive Landscape
- Overview on criticality of inputs and factors of differentiation
- 13.3 Landscape disruption
- Overview on factors of disruption
- 13.4 Industry risks
- Impact of key risks on business
14 Competitive Analysis
- 14.1 Companies profiled
- Companies covered
- 14.2 Company ranking index
- Company ranking index
- 14.3 Market positioning of companies
- Matrix on companies position and classification
- 14.4 AbbVie Inc.
- AbbVie Inc. - Overview
- AbbVie Inc. - Product / Service
- AbbVie Inc. - Key news
- AbbVie Inc. - Key offerings
- SWOT
- 14.5 Binex Co. Ltd.
- Binex Co. Ltd. - Overview
- Binex Co. Ltd. - Product / Service
- Binex Co. Ltd. - Key offerings
- SWOT
- 14.6 Boehringer Ingelheim International GmbH
- Boehringer Ingelheim International GmbH - Overview
- Boehringer Ingelheim International GmbH - Product / Service
- Boehringer Ingelheim International GmbH - Key news
- Boehringer Ingelheim International GmbH - Key offerings
- SWOT
- 14.7 Bora Pharmaceuticals
- Bora Pharmaceuticals - Overview
- Bora Pharmaceuticals - Product / Service
- Bora Pharmaceuticals - Key offerings
- SWOT
- 14.8 Catalent Inc.
- Catalent Inc. - Overview
- Catalent Inc. - Business segments
- Catalent Inc. - Key offerings
- Catalent Inc. - Segment focus
- SWOT
- 14.9 Evonik Industries AG
- Evonik Industries AG - Overview
- Evonik Industries AG - Business segments
- Evonik Industries AG - Key news
- Evonik Industries AG - Key offerings
- Evonik Industries AG - Segment focus
- SWOT
- 14.10 FUJIFILM Corp.
- FUJIFILM Corp. - Overview
- FUJIFILM Corp. - Business segments
- FUJIFILM Corp. - Key news
- FUJIFILM Corp. - Key offerings
- FUJIFILM Corp. - Segment focus
- SWOT
- 14.11 Grifols SA
- Grifols SA - Overview
- Grifols SA - Business segments
- Grifols SA - Key news
- Grifols SA - Key offerings
- Grifols SA - Segment focus
- SWOT
- 14.12 J RETTENMAIER and SOHNE GmbH and Co KG
- J RETTENMAIER and SOHNE GmbH and Co KG - Overview
- J RETTENMAIER and SOHNE GmbH and Co KG - Product / Service
- J RETTENMAIER and SOHNE GmbH and Co KG - Key offerings
- SWOT
- 14.13 Lonza Group Ltd.
- Lonza Group Ltd. - Overview
- Lonza Group Ltd. - Business segments
- Lonza Group Ltd. - Key news
- Lonza Group Ltd. - Key offerings
- Lonza Group Ltd. - Segment focus
- SWOT
- 14.14 Novartis AG
- Novartis AG - Overview
- Novartis AG - Business segments
- Novartis AG - Key news
- Novartis AG - Key offerings
- Novartis AG - Segment focus
- SWOT
- 14.15 Rentschler Biopharma SE
- Rentschler Biopharma SE - Overview
- Rentschler Biopharma SE - Product / Service
- Rentschler Biopharma SE - Key offerings
- SWOT
- 14.16 Samsung Electronics Co. Ltd.
- Samsung Electronics Co. Ltd. - Overview
- Samsung Electronics Co. Ltd. - Business segments
- Samsung Electronics Co. Ltd. - Key news
- Samsung Electronics Co. Ltd. - Key offerings
- Samsung Electronics Co. Ltd. - Segment focus
- SWOT
- 14.17 Toyobo Co. Ltd.
- Toyobo Co. Ltd. - Overview
- Toyobo Co. Ltd. - Business segments
- Toyobo Co. Ltd. - Key news
- Toyobo Co. Ltd. - Key offerings
- Toyobo Co. Ltd. - Segment focus
- SWOT
- 14.18 WuXi Biologics Cayman Inc.
- WuXi Biologics Cayman Inc. - Overview
- WuXi Biologics Cayman Inc. - Product / Service
- WuXi Biologics Cayman Inc. - Key offerings
- SWOT
15 Appendix
- 15.1 Scope of the report
- 15.2 Inclusions and exclusions checklist
- Inclusions checklist
- Exclusions checklist
- 15.3 Currency conversion rates for US$
- Currency conversion rates for US$
- 15.4 Research methodology
- Research methodology
- 15.5 Data procurement
- Information sources
- 15.6 Data validation
- Data validation
- 15.7 Validation techniques employed for market sizing
- Validation techniques employed for market sizing
- 15.8 Data synthesis
- Data synthesis
- 15.9 360 degree market analysis
- 360 degree market analysis
- 15.10 List of abbreviations
- List of abbreviations

