|
|
市場調査レポート
商品コード
1937240
自動車用エンジンオイルの世界市場 2026年~2030年Global Automotive Engine Oil Market 2026-2030 |
||||||
|
|||||||
カスタマイズ可能
|
|||||||

| 自動車用エンジンオイルの世界市場 2026年~2030年 |
|
出版日: 2026年02月11日
発行: TechNavio
ページ情報: 英文 370 Pages
納期: 即納可能
|

概要
世界の自動車用エンジンオイル市場は、2025年から2030年にかけて130億1,320万米ドル規模に成長し、予測期間中のCAGRは4.0%と予測されております。
本報告書では、世界の自動車用エンジンオイル市場に関する包括的な分析、市場規模と予測、動向、成長要因、課題に加え、約25社のベンダー分析を提供しております。
本レポートは、現在の市場状況、最新の動向と促進要因、市場環境全般に関する最新の分析を提供します。市場は、世界の自動車保有台数の持続的な拡大と走行距離の増加、厳格な規制要件とそれに伴うパワートレイン技術の進化、車両のメンテナンスと性能最適化に関するエンドユーザーの意識の高まりによって牽引されています。
本調査は、業界の主要関係者からの情報を含む、一次情報と二次情報の客観的な組み合わせを用いて実施されました。本レポートには、主要企業の分析に加え、包括的な市場規模データ、地域別分析を伴うセグメント、ベンダー情勢が含まれています。レポートには過去データと予測データが掲載されています。
| 市場範囲 | |
|---|---|
| 基準年 | 2026年 |
| 対象期間 | 2030年 |
| 予測期間 | 2026-2030 |
| 成長モメンタム | 加速 |
| 前年比2026年 | 3.9% |
| CAGR | 4% |
| 増分額 | 130億1,320万米ドル |
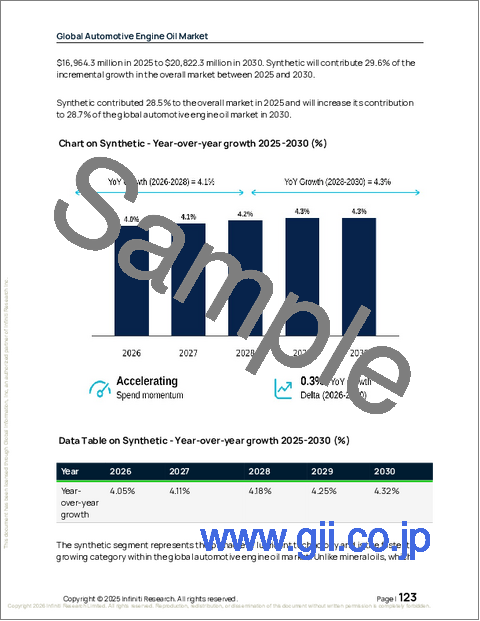
本調査では、高性能合成油および低粘度配合剤の台頭が、今後数年間における世界の自動車エンジンオイル市場成長を牽引する主要要因の一つであると特定しております。また、持続可能な潤滑油(バイオベース油および再生精製油)の出現、ならびに車両電動化がもたらす変革的な影響が、市場において相当な需要を生み出すものと見込まれます。
目次
第1章 エグゼクティブサマリー
第2章 Technavio分析
- 価格・ライフサイクル・顧客購入バスケット・採用率・購入基準の分析
- インプットの重要性と差別化の要因
- 混乱の要因
- 促進要因と課題の影響
第3章 市場情勢
- 市場エコシステム
- 市場の特徴
- バリューチェーン分析
第4章 市場規模
- 市場の定義
- 市場セグメント分析
- 市場規模 2025
- 市場の見通し 2025-2030
第5章 市場規模実績
- 自動車用エンジンオイルの世界市場 2020-2024
- 用途別セグメント分析 2020-2024
- タイプセグメント分析 2020-2024
- 製品タイプセグメント分析 2020-2024
- グレードタイプセグメント分析 2020-2024
- 流通チャネルセグメント分析 2020-2024
- 地域別セグメント分析 2020-2024
- 国別セグメント分析 2020-2024
第6章 定性分析
- AIの影響:自動車用エンジンオイルの世界市場
第7章 ファイブフォース分析
- ファイブフォースの要約
- 買い手の交渉力
- 供給企業の交渉力
- 新規参入業者の脅威
- 代替品の脅威
- 競争の脅威
- 市況
第8章 市場セグメンテーション:用途別
- 比較:用途別
- 乗用車
- 商用車
- 二輪車
- その他
- 市場機会:用途別
第9章 市場セグメンテーション:タイプ別
- 比較:タイプ別
- ディーゼル
- ガソリン
- 代替燃料
- 市場機会:タイプ別
第10章 市場セグメンテーション:製品タイプ別
- 比較:製品タイプ別
- 鉱物性
- 合成
- 半合成
- 市場機会:製品タイプ別
第11章 市場セグメンテーション:グレードタイプ別
- 比較:グレードタイプ別
- 5W-30
- 0W-20
- 10W-40
- その他
- 市場機会:グレードタイプ別
第12章 市場セグメンテーション:流通チャネル別
- 比較:流通チャネル別
- アフターマーケット
- OEM
- 市場機会:流通チャネル別
第13章 顧客情勢
第14章 地域別情勢
- 地域別セグメンテーション
- 地域別比較
- アジア太平洋
- 中国
- インド
- 日本
- 韓国
- インドネシア
- オーストラリア
- 欧州
- ドイツ
- 英国
- フランス
- イタリア
- スペイン
- オランダ
- 北米
- 米国
- カナダ
- メキシコ
- 南米
- ブラジル
- アルゼンチン
- チリ
- 中東・アフリカ
- サウジアラビア
- アラブ首長国連邦
- 南アフリカ
- トルコ
- イスラエル
- 市場機会:地域別
第15章 促進要因・課題・機会
- 市場促進要因
- 市場の課題
- 促進要因と課題の影響
- 市場機会
第16章 競合情勢
- 概要
- 競合情勢
- 混乱の状況
- 業界のリスク
第17章 競合分析
- 企業プロファイル
- 企業ランキング指標
- 企業の市場ポジショニング
- AMSOIL Inc.
- BP Plc
- Chevron Corp.
- China Petrochemical Corp.
- ENEOS Corp.
- Eni SpA
- Exxon Mobil Corp.
- FUCHS SE
- MOTUL SA
- Petroliam Nasional Berhad
- PJSC LUKOIL
- Repsol SA
- Shell plc
- TotalEnergies SE
- Valvoline Inc.
