|
|
市場調査レポート
商品コード
1634342
RTDカクテルの世界市場(2025年~2029年)Global Ready to drink Cocktails Market 2025-2029 |
||||||

|
|||||||
カスタマイズ可能
|
|||||||


| RTDカクテルの世界市場(2025年~2029年) |
|
出版日: 2025年01月03日
発行: TechNavio
ページ情報: 英文 204 Pages
納期: 即納可能
|

全表示
- 概要
- 図表
- 目次
RTDカクテル市場(2025年~2029年)
世界のRTDカクテルの市場規模は、2024年~2029年に29億3,280万米ドルに達し、予測期間中のCAGRは14.4%で成長すると予測されます。この調査レポートは、RTDカクテル市場の全体分析、市場規模・予測、動向、成長促進要因、課題、約25のベンダーを網羅したベンダー分析などを掲載しています。
本レポートは、現在の市場シナリオ、最新動向と促進要因、市場環境全体に関する最新分析を提供しています。市場は、市場ベンダー間の協力関係の増加、消費者の健康への関心の高まり、消費者の利便性への高い嗜好などが牽引しています。
| 市場範囲 | |
|---|---|
| 基準年 | 2025年 |
| 終了年 | 2029年 |
| 予測期間 | 2025年~2029年 |
| 成長モメンタム | 加速 |
| 前年比2025年 | 12.3% |
| CAGR | 14.4% |
| 増分額 | 29億3,280万米ドル |
本調査では、今後数年間のRTDカクテル市場の成長を促進する主な要因の1つとして、新フレーバーの製品発売数の増加を挙げています。また、RTDカクテルのeコマースチャネルの人気の高まりや、RTDカクテルの革新的なパッケージへの注目の高まりは、市場の大きな需要につながります。
目次
第1章 エグゼクティブサマリー
- 市場概要
第2章 Technavioの分析
- 価格感度・ライフサイクル・顧客購入バスケット・採用率・購入基準の分析
- インプットの重要性と差別化の要因
- ディスラプションの要因
- 促進要因と課題の影響
第3章 市場情勢
- 市場エコシステム
- 市場の特徴
- バリューチェーン分析
第4章 市場規模
- 市場の定義
- 市場セグメント分析
- 市場規模(2024年)
- 市場の見通し(2024年~2029年)
第5章 市場規模実績
- RTDカクテルの世界市場(2019年~2023年)
- 流通チャネルセグメント分析(2019年~2023年)
- タイプセグメント分析(2019年~2023年)
- 地域セグメント分析(2019年~2023年)
- 国セグメント分析(2019年~2023年)
第6章 定性分析
- AIの影響:RTDカクテルの世界市場
第7章 ファイブフォース分析
- ファイブフォースの要約
- 買い手の交渉力
- 供給企業の交渉力
- 新規参入業者の脅威
- 代替品の脅威
- 競争の脅威
- 市況
第8章 市場セグメンテーション:流通チャネル別
- 市場セグメント
- 比較:流通チャネル別
- ホテルとスーパーマーケット:市場規模と予測(2024年~2029年)
- オンライン:市場規模と予測(2024年~2029年)
- 酒屋:市場規模と予測(2024年~2029年)
- 市場機会:流通チャネル別
第9章 市場セグメンテーション:タイプ別
- 市場セグメント
- 比較:タイプ別
- スピリットベース:市場規模と予測(2024年~2029年)
- ワインベース:市場規模と予測(2024年~2029年)
- 麦芽ベース:市場規模と予測(2024年~2029年)
- 市場機会:タイプ別
第10章 顧客情勢
- 顧客情勢の概要
第11章 地域別情勢
- 地域別セグメンテーション
- 地域別比較
- 北米:市場規模と予測(2024年~2029年)
- 欧州:市場規模と予測(2024年~2029年)
- アジア太平洋:市場規模と予測(2024年~2029年)
- 南米:市場規模と予測(2024年~2029年)
- 中東・アフリカ:市場規模と予測(2024年~2029年)
- 米国:市場規模と予測(2024年~2029年)
- ドイツ:市場規模と予測(2024年~2029年)
- 中国:市場規模と予測(2024年~2029年)
- 英国:市場規模と予測(2024年~2029年)
- 日本:市場規模と予測(2024年~2029年)
- カナダ:市場規模と予測(2024年~2029年)
- フランス:市場規模と予測(2024年~2029年)
- インド:市場規模と予測(2024年~2029年)
- スペイン:市場規模と予測(2024年~2029年)
- ブラジル:市場規模と予測(2024年~2029年)
- 市場機会:地域情勢別
第12章 促進要因・課題・機会・抑制要因
- 市場促進要因
- 市場の課題
- 促進要因と課題の影響
- 市場の機会・抑制要因
第13章 競合情勢
- 概要
- 競合情勢
- ディスラプションの状況
- 業界のリスク
第14章 競合分析
- 企業プロファイル
- 企業ランキング指数
- 企業の市場ポジショニング
- Anheuser Busch InBev SA NV
- Asahi Group Holdings Ltd.
- Bacardi and Co Ltd
- Becle SAB de CV
- Brown Forman Corp.
- Crook and Marker LLC
- Davide Campari-Milano N.V.
- Diageo PLC
- House of Monaco
- Lucas Bols Amsterdam BV
- Manly Spirits Co.
- Molson Coors Beverage Co.
- Pernod Ricard SA
- Suntory Holdings Ltd.
- The Boston Beer Co. Inc.
第15章 付録
Exhibits:
- Exhibits1: Executive Summary - Chart on Market Overview
- Exhibits2: Executive Summary - Data Table on Market Overview
- Exhibits3: Executive Summary - Chart on Global Market Characteristics
- Exhibits4: Executive Summary - Chart on Market By Geographical Landscape
- Exhibits5: Executive Summary - Chart on Market Segmentation by Distribution Channel
- Exhibits6: Executive Summary - Chart on Market Segmentation by Type
- Exhibits7: Executive Summary - Chart on Incremental Growth
- Exhibits8: Executive Summary - Data Table on Incremental Growth
- Exhibits9: Executive Summary - Chart on Company Market Positioning
- Exhibits10: Analysis of price sensitivity, lifecycle, customer purchase basket, adoption rates, and purchase criteria
- Exhibits11: Overview on criticality of inputs and factors of differentiation
- Exhibits12: Overview on factors of disruption
- Exhibits13: Impact of drivers and challenges in 2024 and 2029
- Exhibits14: Parent Market
- Exhibits15: Data Table on - Parent Market
- Exhibits16: Market characteristics analysis
- Exhibits17: Value chain analysis
- Exhibits18: Offerings of companies included in the market definition
- Exhibits19: Market segments
- Exhibits20: Chart on Global - Market size and forecast 2024-2029 ($ million)
- Exhibits21: Data Table on Global - Market size and forecast 2024-2029 ($ million)
- Exhibits22: Chart on Global Market: Year-over-year growth 2024-2029 (%)
- Exhibits23: Data Table on Global Market: Year-over-year growth 2024-2029 (%)
- Exhibits24: Historic Market Size - Data Table on Global Ready To Drink Cocktails Market 2019 - 2023 ($ million)
- Exhibits25: Historic Market Size - Distribution Channel Segment 2019 - 2023 ($ million)
- Exhibits26: Historic Market Size - Type Segment 2019 - 2023 ($ million)
- Exhibits27: Historic Market Size - Geography Segment 2019 - 2023 ($ million)
- Exhibits28: Historic Market Size - Country Segment 2019 - 2023 ($ million)
- Exhibits29: Five forces analysis - Comparison between 2024 and 2029
- Exhibits30: Bargaining power of buyers - Impact of key factors 2024 and 2029
- Exhibits31: Bargaining power of suppliers - Impact of key factors in 2024 and 2029
- Exhibits32: Threat of new entrants - Impact of key factors in 2024 and 2029
- Exhibits33: Threat of substitutes - Impact of key factors in 2024 and 2029
- Exhibits34: Threat of rivalry - Impact of key factors in 2024 and 2029
- Exhibits35: Chart on Market condition - Five forces 2024 and 2029
- Exhibits36: Chart on Distribution Channel - Market share 2024-2029 (%)
- Exhibits37: Data Table on Distribution Channel - Market share 2024-2029 (%)
- Exhibits38: Chart on Comparison by Distribution Channel
- Exhibits39: Data Table on Comparison by Distribution Channel
- Exhibits40: Chart on H and S - Market size and forecast 2024-2029 ($ million)
- Exhibits41: Data Table on H and S - Market size and forecast 2024-2029 ($ million)
- Exhibits42: Chart on H and S - Year-over-year growth 2024-2029 (%)
- Exhibits43: Data Table on H and S - Year-over-year growth 2024-2029 (%)
- Exhibits44: Chart on Online - Market size and forecast 2024-2029 ($ million)
- Exhibits45: Data Table on Online - Market size and forecast 2024-2029 ($ million)
- Exhibits46: Chart on Online - Year-over-year growth 2024-2029 (%)
- Exhibits47: Data Table on Online - Year-over-year growth 2024-2029 (%)
- Exhibits48: Chart on Liquor stores - Market size and forecast 2024-2029 ($ million)
- Exhibits49: Data Table on Liquor stores - Market size and forecast 2024-2029 ($ million)
- Exhibits50: Chart on Liquor stores - Year-over-year growth 2024-2029 (%)
- Exhibits51: Data Table on Liquor stores - Year-over-year growth 2024-2029 (%)
- Exhibits52: Market opportunity by Distribution Channel ($ million)
- Exhibits53: Data Table on Market opportunity by Distribution Channel ($ million)
- Exhibits54: Chart on Type - Market share 2024-2029 (%)
- Exhibits55: Data Table on Type - Market share 2024-2029 (%)
- Exhibits56: Chart on Comparison by Type
- Exhibits57: Data Table on Comparison by Type
- Exhibits58: Chart on Spirit based - Market size and forecast 2024-2029 ($ million)
- Exhibits59: Data Table on Spirit based - Market size and forecast 2024-2029 ($ million)
- Exhibits60: Chart on Spirit based - Year-over-year growth 2024-2029 (%)
- Exhibits61: Data Table on Spirit based - Year-over-year growth 2024-2029 (%)
- Exhibits62: Chart on Wine based - Market size and forecast 2024-2029 ($ million)
- Exhibits63: Data Table on Wine based - Market size and forecast 2024-2029 ($ million)
- Exhibits64: Chart on Wine based - Year-over-year growth 2024-2029 (%)
- Exhibits65: Data Table on Wine based - Year-over-year growth 2024-2029 (%)
- Exhibits66: Chart on Malt based - Market size and forecast 2024-2029 ($ million)
- Exhibits67: Data Table on Malt based - Market size and forecast 2024-2029 ($ million)
- Exhibits68: Chart on Malt based - Year-over-year growth 2024-2029 (%)
- Exhibits69: Data Table on Malt based - Year-over-year growth 2024-2029 (%)
- Exhibits70: Market opportunity by Type ($ million)
- Exhibits71: Data Table on Market opportunity by Type ($ million)
- Exhibits72: Analysis of price sensitivity, lifecycle, customer purchase basket, adoption rates, and purchase criteria
- Exhibits73: Chart on Market share By Geographical Landscape 2024-2029 (%)
- Exhibits74: Data Table on Market share By Geographical Landscape 2024-2029 (%)
- Exhibits75: Chart on Geographic comparison
- Exhibits76: Data Table on Geographic comparison
- Exhibits77: Chart on North America - Market size and forecast 2024-2029 ($ million)
- Exhibits78: Data Table on North America - Market size and forecast 2024-2029 ($ million)
- Exhibits79: Chart on North America - Year-over-year growth 2024-2029 (%)
- Exhibits80: Data Table on North America - Year-over-year growth 2024-2029 (%)
- Exhibits81: Chart on Europe - Market size and forecast 2024-2029 ($ million)
- Exhibits82: Data Table on Europe - Market size and forecast 2024-2029 ($ million)
- Exhibits83: Chart on Europe - Year-over-year growth 2024-2029 (%)
- Exhibits84: Data Table on Europe - Year-over-year growth 2024-2029 (%)
- Exhibits85: Chart on APAC - Market size and forecast 2024-2029 ($ million)
- Exhibits86: Data Table on APAC - Market size and forecast 2024-2029 ($ million)
- Exhibits87: Chart on APAC - Year-over-year growth 2024-2029 (%)
- Exhibits88: Data Table on APAC - Year-over-year growth 2024-2029 (%)
- Exhibits89: Chart on South America - Market size and forecast 2024-2029 ($ million)
- Exhibits90: Data Table on South America - Market size and forecast 2024-2029 ($ million)
- Exhibits91: Chart on South America - Year-over-year growth 2024-2029 (%)
- Exhibits92: Data Table on South America - Year-over-year growth 2024-2029 (%)
- Exhibits93: Chart on Middle East and Africa - Market size and forecast 2024-2029 ($ million)
- Exhibits94: Data Table on Middle East and Africa - Market size and forecast 2024-2029 ($ million)
- Exhibits95: Chart on Middle East and Africa - Year-over-year growth 2024-2029 (%)
- Exhibits96: Data Table on Middle East and Africa - Year-over-year growth 2024-2029 (%)
- Exhibits97: Chart on US - Market size and forecast 2024-2029 ($ million)
- Exhibits98: Data Table on US - Market size and forecast 2024-2029 ($ million)
- Exhibits99: Chart on US - Year-over-year growth 2024-2029 (%)
- Exhibits100: Data Table on US - Year-over-year growth 2024-2029 (%)
- Exhibits101: Chart on Germany - Market size and forecast 2024-2029 ($ million)
- Exhibits102: Data Table on Germany - Market size and forecast 2024-2029 ($ million)
- Exhibits103: Chart on Germany - Year-over-year growth 2024-2029 (%)
- Exhibits104: Data Table on Germany - Year-over-year growth 2024-2029 (%)
- Exhibits105: Chart on China - Market size and forecast 2024-2029 ($ million)
- Exhibits106: Data Table on China - Market size and forecast 2024-2029 ($ million)
- Exhibits107: Chart on China - Year-over-year growth 2024-2029 (%)
- Exhibits108: Data Table on China - Year-over-year growth 2024-2029 (%)
- Exhibits109: Chart on UK - Market size and forecast 2024-2029 ($ million)
- Exhibits110: Data Table on UK - Market size and forecast 2024-2029 ($ million)
- Exhibits111: Chart on UK - Year-over-year growth 2024-2029 (%)
- Exhibits112: Data Table on UK - Year-over-year growth 2024-2029 (%)
- Exhibits113: Chart on Japan - Market size and forecast 2024-2029 ($ million)
- Exhibits114: Data Table on Japan - Market size and forecast 2024-2029 ($ million)
- Exhibits115: Chart on Japan - Year-over-year growth 2024-2029 (%)
- Exhibits116: Data Table on Japan - Year-over-year growth 2024-2029 (%)
- Exhibits117: Chart on Canada - Market size and forecast 2024-2029 ($ million)
- Exhibits118: Data Table on Canada - Market size and forecast 2024-2029 ($ million)
- Exhibits119: Chart on Canada - Year-over-year growth 2024-2029 (%)
- Exhibits120: Data Table on Canada - Year-over-year growth 2024-2029 (%)
- Exhibits121: Chart on France - Market size and forecast 2024-2029 ($ million)
- Exhibits122: Data Table on France - Market size and forecast 2024-2029 ($ million)
- Exhibits123: Chart on France - Year-over-year growth 2024-2029 (%)
- Exhibits124: Data Table on France - Year-over-year growth 2024-2029 (%)
- Exhibits125: Chart on India - Market size and forecast 2024-2029 ($ million)
- Exhibits126: Data Table on India - Market size and forecast 2024-2029 ($ million)
- Exhibits127: Chart on India - Year-over-year growth 2024-2029 (%)
- Exhibits128: Data Table on India - Year-over-year growth 2024-2029 (%)
- Exhibits129: Chart on Spain - Market size and forecast 2024-2029 ($ million)
- Exhibits130: Data Table on Spain - Market size and forecast 2024-2029 ($ million)
- Exhibits131: Chart on Spain - Year-over-year growth 2024-2029 (%)
- Exhibits132: Data Table on Spain - Year-over-year growth 2024-2029 (%)
- Exhibits133: Chart on Brazil - Market size and forecast 2024-2029 ($ million)
- Exhibits134: Data Table on Brazil - Market size and forecast 2024-2029 ($ million)
- Exhibits135: Chart on Brazil - Year-over-year growth 2024-2029 (%)
- Exhibits136: Data Table on Brazil - Year-over-year growth 2024-2029 (%)
- Exhibits137: Market opportunity By Geographical Landscape ($ million)
- Exhibits138: Data Tables on Market opportunity By Geographical Landscape ($ million)
- Exhibits139: Impact of drivers and challenges in 2024 and 2029
- Exhibits140: Overview on criticality of inputs and factors of differentiation
- Exhibits141: Overview on factors of disruption
- Exhibits142: Impact of key risks on business
- Exhibits143: Companies covered
- Exhibits144: Company ranking index
- Exhibits145: Matrix on companies position and classification
- Exhibits146: Anheuser Busch InBev SA NV - Overview
- Exhibits147: Anheuser Busch InBev SA NV - Product / Service
- Exhibits148: Anheuser Busch InBev SA NV - Key offerings
- Exhibits149: SWOT
- Exhibits150: Asahi Group Holdings Ltd. - Overview
- Exhibits151: Asahi Group Holdings Ltd. - Business segments
- Exhibits152: Asahi Group Holdings Ltd. - Key news
- Exhibits153: Asahi Group Holdings Ltd. - Key offerings
- Exhibits154: Asahi Group Holdings Ltd. - Segment focus
- Exhibits155: SWOT
- Exhibits156: Bacardi and Co Ltd - Overview
- Exhibits157: Bacardi and Co Ltd - Product / Service
- Exhibits158: Bacardi and Co Ltd - Key news
- Exhibits159: Bacardi and Co Ltd - Key offerings
- Exhibits160: SWOT
- Exhibits161: Becle SAB de CV - Overview
- Exhibits162: Becle SAB de CV - Business segments
- Exhibits163: Becle SAB de CV - Key offerings
- Exhibits164: Becle SAB de CV - Segment focus
- Exhibits165: SWOT
- Exhibits166: Brown Forman Corp. - Overview
- Exhibits167: Brown Forman Corp. - Product / Service
- Exhibits168: Brown Forman Corp. - Key offerings
- Exhibits169: SWOT
- Exhibits170: Crook and Marker LLC - Overview
- Exhibits171: Crook and Marker LLC - Product / Service
- Exhibits172: Crook and Marker LLC - Key offerings
- Exhibits173: SWOT
- Exhibits174: Davide Campari-Milano N.V. - Overview
- Exhibits175: Davide Campari-Milano N.V. - Business segments
- Exhibits176: Davide Campari-Milano N.V. - Key offerings
- Exhibits177: Davide Campari-Milano N.V. - Segment focus
- Exhibits178: SWOT
- Exhibits179: Diageo PLC - Overview
- Exhibits180: Diageo PLC - Business segments
- Exhibits181: Diageo PLC - Key news
- Exhibits182: Diageo PLC - Key offerings
- Exhibits183: Diageo PLC - Segment focus
- Exhibits184: SWOT
- Exhibits185: House of Monaco - Overview
- Exhibits186: House of Monaco - Product / Service
- Exhibits187: House of Monaco - Key offerings
- Exhibits188: SWOT
- Exhibits189: Lucas Bols Amsterdam BV - Overview
- Exhibits190: Lucas Bols Amsterdam BV - Product / Service
- Exhibits191: Lucas Bols Amsterdam BV - Key offerings
- Exhibits192: SWOT
- Exhibits193: Manly Spirits Co. - Overview
- Exhibits194: Manly Spirits Co. - Product / Service
- Exhibits195: Manly Spirits Co. - Key offerings
- Exhibits196: SWOT
- Exhibits197: Molson Coors Beverage Co. - Overview
- Exhibits198: Molson Coors Beverage Co. - Business segments
- Exhibits199: Molson Coors Beverage Co. - Key offerings
- Exhibits200: Molson Coors Beverage Co. - Segment focus
- Exhibits201: SWOT
- Exhibits202: Pernod Ricard SA - Overview
- Exhibits203: Pernod Ricard SA - Product / Service
- Exhibits204: Pernod Ricard SA - Key news
- Exhibits205: Pernod Ricard SA - Key offerings
- Exhibits206: SWOT
- Exhibits207: Suntory Holdings Ltd. - Overview
- Exhibits208: Suntory Holdings Ltd. - Business segments
- Exhibits209: Suntory Holdings Ltd. - Key news
- Exhibits210: Suntory Holdings Ltd. - Key offerings
- Exhibits211: Suntory Holdings Ltd. - Segment focus
- Exhibits212: SWOT
- Exhibits213: The Boston Beer Co. Inc. - Overview
- Exhibits214: The Boston Beer Co. Inc. - Product / Service
- Exhibits215: The Boston Beer Co. Inc. - Key offerings
- Exhibits216: SWOT
- Exhibits217: Inclusions checklist
- Exhibits218: Exclusions checklist
- Exhibits219: Currency conversion rates for US$
- Exhibits220: Research methodology
- Exhibits221: Information sources
- Exhibits222: Data validation
- Exhibits223: Validation techniques employed for market sizing
- Exhibits224: Data synthesis
- Exhibits225: 360 degree market analysis
- Exhibits226: List of abbreviations
Ready To Drink Cocktails Market 2025-2029
The ready to drink cocktails market is forecasted to grow by $ 2932.8 mn during 2024-2029, accelerating at a CAGR of 14.4% during the forecast period. The report on the ready to drink cocktails market provides a holistic analysis, market size and forecast, trends, growth drivers, and challenges, as well as vendor analysis covering around 25 vendors.
The report offers an up-to-date analysis regarding the current market scenario, the latest trends and drivers, and the overall market environment. The market is driven by rise in collaboration between market vendors, rising health concerns among consumers, and high preference for convenience among consumers.
| Market Scope | |
|---|---|
| Base Year | 2025 |
| End Year | 2029 |
| Series Year | 2025-2029 |
| Growth Momentum | Accelerate |
| YOY 2025 | 12.3% |
| CAGR | 14.4% |
| Incremental Value | $2932.8 mn |
Technavio's ready to drink cocktails market is segmented as below:
By Distribution Channel
- H and S
- Online
- Liquor stores
By Type
- Spirit based
- Wine based
- Malt based
By Geographical Landscape
- North America
- Europe
- APAC
- South America
- Middle East and Africa
This study identifies the rising number of product launches with new flavors as one of the prime reasons driving the ready to drink cocktails market growth during the next few years. Also, growing popularity of e-commerce channels for rtd cocktails and increasing focus on innovative packaging of rtd cocktails will lead to sizable demand in the market.
The report on the ready to drink cocktails market covers the following areas:
- Ready To Drink Cocktails Market sizing
- Ready To Drink Cocktails Market forecast
- Ready To Drink Cocktails Market industry analysis
The robust vendor analysis is designed to help clients improve their market position, and in line with this, this report provides a detailed analysis of several leading ready to drink cocktails market vendors that include Anheuser Busch InBev SA NV, Asahi Group Holdings Ltd., Bacardi and Co Ltd, Becle SAB de CV, Brown Forman Corp., Crook and Marker LLC, Davide Campari-Milano N.V., Diageo PLC, House of Monaco, Lucas Bols Amsterdam BV, Manchester Drinks Ltd., Manly Spirits Co., Molson Coors Beverage Co., NEXT CENTURY SPIRITS LLC, Pernod Ricard SA, Snake Oil Cocktail Co., Suntory Holdings Ltd., The Boston Beer Co. Inc., and VOSA SPIRITS LLC. Also, the ready to drink cocktails market analysis report includes information on upcoming trends and challenges that will influence market growth. This is to help companies strategize and leverage all forthcoming growth opportunities.
The study was conducted using an objective combination of primary and secondary information including inputs from key participants in the industry. The report contains a comprehensive market and vendor landscape in addition to an analysis of the key vendors.
The publisher presents a detailed picture of the market by the way of study, synthesis, and summation of data from multiple sources by an analysis of key parameters such as profit, pricing, competition, and promotions. It presents various market facets by identifying the key industry influencers. The data presented is comprehensive, reliable, and a result of extensive primary and secondary research. The market research reports provide a complete competitive landscape and an in-depth vendor selection methodology and analysis using qualitative and quantitative research to forecast accurate market growth.
Table of Contents
1 Executive Summary
- 1.1 Market overview
- Executive Summary - Chart on Market Overview
- Executive Summary - Data Table on Market Overview
- Executive Summary - Chart on Global Market Characteristics
- Executive Summary - Chart on Market By Geographical Landscape
- Executive Summary - Chart on Market Segmentation by Distribution Channel
- Executive Summary - Chart on Market Segmentation by Type
- Executive Summary - Chart on Incremental Growth
- Executive Summary - Data Table on Incremental Growth
- Executive Summary - Chart on Company Market Positioning
2 Technavio Analysis
- 2.1 Analysis of price sensitivity, lifecycle, customer purchase basket, adoption rates, and purchase criteria
- Analysis of price sensitivity, lifecycle, customer purchase basket, adoption rates, and purchase criteria
- 2.2 Criticality of inputs and Factors of differentiation
- Overview on criticality of inputs and factors of differentiation
- 2.3 Factors of disruption
- Overview on factors of disruption
- 2.4 Impact of drivers and challenges
- Impact of drivers and challenges in 2024 and 2029
3 Market Landscape
- 3.1 Market ecosystem
- Parent Market
- Data Table on - Parent Market
- 3.2 Market characteristics
- Market characteristics analysis
- 3.3 Value chain analysis
- Value chain analysis
4 Market Sizing
- 4.1 Market definition
- Offerings of companies included in the market definition
- 4.2 Market segment analysis
- Market segments
- 4.3 Market size 2024
- 4.4 Market outlook: Forecast for 2024-2029
- Chart on Global - Market size and forecast 2024-2029 ($ million)
- Data Table on Global - Market size and forecast 2024-2029 ($ million)
- Chart on Global Market: Year-over-year growth 2024-2029 (%)
- Data Table on Global Market: Year-over-year growth 2024-2029 (%)
5 Historic Market Size
- 5.1 Global Ready To Drink Cocktails Market 2019 - 2023
- Historic Market Size - Data Table on Global Ready To Drink Cocktails Market 2019 - 2023 ($ million)
- 5.2 Distribution Channel segment analysis 2019 - 2023
- Historic Market Size - Distribution Channel Segment 2019 - 2023 ($ million)
- 5.3 Type segment analysis 2019 - 2023
- Historic Market Size - Type Segment 2019 - 2023 ($ million)
- 5.4 Geography segment analysis 2019 - 2023
- Historic Market Size - Geography Segment 2019 - 2023 ($ million)
- 5.5 Country segment analysis 2019 - 2023
- Historic Market Size - Country Segment 2019 - 2023 ($ million)
6 Qualitative Analysis
- 6.1 Impact of AI on Global Ready To Drink Cocktails Market
7 Five Forces Analysis
- 7.1 Five forces summary
- Five forces analysis - Comparison between 2024 and 2029
- 7.2 Bargaining power of buyers
- Bargaining power of buyers - Impact of key factors 2024 and 2029
- 7.3 Bargaining power of suppliers
- Bargaining power of suppliers - Impact of key factors in 2024 and 2029
- 7.4 Threat of new entrants
- Threat of new entrants - Impact of key factors in 2024 and 2029
- 7.5 Threat of substitutes
- Threat of substitutes - Impact of key factors in 2024 and 2029
- 7.6 Threat of rivalry
- Threat of rivalry - Impact of key factors in 2024 and 2029
- 7.7 Market condition
- Chart on Market condition - Five forces 2024 and 2029
8 Market Segmentation by Distribution Channel
- 8.1 Market segments
- Chart on Distribution Channel - Market share 2024-2029 (%)
- Data Table on Distribution Channel - Market share 2024-2029 (%)
- 8.2 Comparison by Distribution Channel
- Chart on Comparison by Distribution Channel
- Data Table on Comparison by Distribution Channel
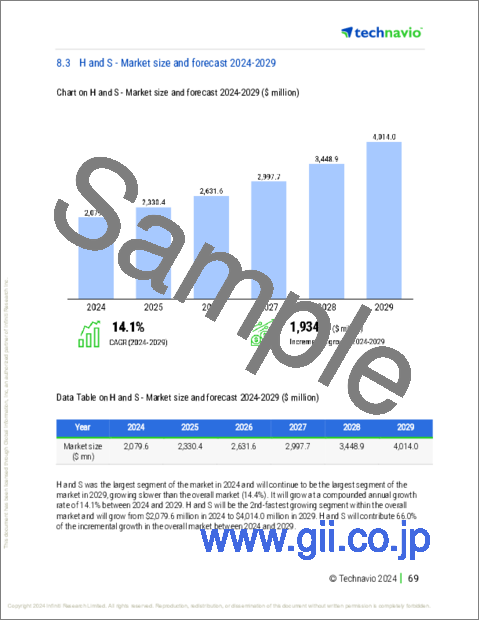
- 8.3 H and S - Market size and forecast 2024-2029
- Chart on H and S - Market size and forecast 2024-2029 ($ million)
- Data Table on H and S - Market size and forecast 2024-2029 ($ million)
- Chart on H and S - Year-over-year growth 2024-2029 (%)
- Data Table on H and S - Year-over-year growth 2024-2029 (%)
- 8.4 Online - Market size and forecast 2024-2029
- Chart on Online - Market size and forecast 2024-2029 ($ million)
- Data Table on Online - Market size and forecast 2024-2029 ($ million)
- Chart on Online - Year-over-year growth 2024-2029 (%)
- Data Table on Online - Year-over-year growth 2024-2029 (%)
- 8.5 Liquor stores - Market size and forecast 2024-2029
- Chart on Liquor stores - Market size and forecast 2024-2029 ($ million)
- Data Table on Liquor stores - Market size and forecast 2024-2029 ($ million)
- Chart on Liquor stores - Year-over-year growth 2024-2029 (%)
- Data Table on Liquor stores - Year-over-year growth 2024-2029 (%)
- 8.6 Market opportunity by Distribution Channel
- Market opportunity by Distribution Channel ($ million)
- Data Table on Market opportunity by Distribution Channel ($ million)
9 Market Segmentation by Type
- 9.1 Market segments
- Chart on Type - Market share 2024-2029 (%)
- Data Table on Type - Market share 2024-2029 (%)
- 9.2 Comparison by Type
- Chart on Comparison by Type
- Data Table on Comparison by Type
- 9.3 Spirit based - Market size and forecast 2024-2029
- Chart on Spirit based - Market size and forecast 2024-2029 ($ million)
- Data Table on Spirit based - Market size and forecast 2024-2029 ($ million)
- Chart on Spirit based - Year-over-year growth 2024-2029 (%)
- Data Table on Spirit based - Year-over-year growth 2024-2029 (%)
- 9.4 Wine based - Market size and forecast 2024-2029
- Chart on Wine based - Market size and forecast 2024-2029 ($ million)
- Data Table on Wine based - Market size and forecast 2024-2029 ($ million)
- Chart on Wine based - Year-over-year growth 2024-2029 (%)
- Data Table on Wine based - Year-over-year growth 2024-2029 (%)
- 9.5 Malt based - Market size and forecast 2024-2029
- Chart on Malt based - Market size and forecast 2024-2029 ($ million)
- Data Table on Malt based - Market size and forecast 2024-2029 ($ million)
- Chart on Malt based - Year-over-year growth 2024-2029 (%)
- Data Table on Malt based - Year-over-year growth 2024-2029 (%)
- 9.6 Market opportunity by Type
- Market opportunity by Type ($ million)
- Data Table on Market opportunity by Type ($ million)
10 Customer Landscape
- 10.1 Customer landscape overview
- Analysis of price sensitivity, lifecycle, customer purchase basket, adoption rates, and purchase criteria
11 Geographic Landscape
- 11.1 Geographic segmentation
- Chart on Market share By Geographical Landscape 2024-2029 (%)
- Data Table on Market share By Geographical Landscape 2024-2029 (%)
- 11.2 Geographic comparison
- Chart on Geographic comparison
- Data Table on Geographic comparison
- 11.3 North America - Market size and forecast 2024-2029
- Chart on North America - Market size and forecast 2024-2029 ($ million)
- Data Table on North America - Market size and forecast 2024-2029 ($ million)
- Chart on North America - Year-over-year growth 2024-2029 (%)
- Data Table on North America - Year-over-year growth 2024-2029 (%)
- 11.4 Europe - Market size and forecast 2024-2029
- Chart on Europe - Market size and forecast 2024-2029 ($ million)
- Data Table on Europe - Market size and forecast 2024-2029 ($ million)
- Chart on Europe - Year-over-year growth 2024-2029 (%)
- Data Table on Europe - Year-over-year growth 2024-2029 (%)
- 11.5 APAC - Market size and forecast 2024-2029
- Chart on APAC - Market size and forecast 2024-2029 ($ million)
- Data Table on APAC - Market size and forecast 2024-2029 ($ million)
- Chart on APAC - Year-over-year growth 2024-2029 (%)
- Data Table on APAC - Year-over-year growth 2024-2029 (%)
- 11.6 South America - Market size and forecast 2024-2029
- Chart on South America - Market size and forecast 2024-2029 ($ million)
- Data Table on South America - Market size and forecast 2024-2029 ($ million)
- Chart on South America - Year-over-year growth 2024-2029 (%)
- Data Table on South America - Year-over-year growth 2024-2029 (%)
- 11.7 Middle East and Africa - Market size and forecast 2024-2029
- Chart on Middle East and Africa - Market size and forecast 2024-2029 ($ million)
- Data Table on Middle East and Africa - Market size and forecast 2024-2029 ($ million)
- Chart on Middle East and Africa - Year-over-year growth 2024-2029 (%)
- Data Table on Middle East and Africa - Year-over-year growth 2024-2029 (%)
- 11.8 US - Market size and forecast 2024-2029
- Chart on US - Market size and forecast 2024-2029 ($ million)
- Data Table on US - Market size and forecast 2024-2029 ($ million)
- Chart on US - Year-over-year growth 2024-2029 (%)
- Data Table on US - Year-over-year growth 2024-2029 (%)
- 11.9 Germany - Market size and forecast 2024-2029
- Chart on Germany - Market size and forecast 2024-2029 ($ million)
- Data Table on Germany - Market size and forecast 2024-2029 ($ million)
- Chart on Germany - Year-over-year growth 2024-2029 (%)
- Data Table on Germany - Year-over-year growth 2024-2029 (%)
- 11.10 China - Market size and forecast 2024-2029
- Chart on China - Market size and forecast 2024-2029 ($ million)
- Data Table on China - Market size and forecast 2024-2029 ($ million)
- Chart on China - Year-over-year growth 2024-2029 (%)
- Data Table on China - Year-over-year growth 2024-2029 (%)
- 11.11 UK - Market size and forecast 2024-2029
- Chart on UK - Market size and forecast 2024-2029 ($ million)
- Data Table on UK - Market size and forecast 2024-2029 ($ million)
- Chart on UK - Year-over-year growth 2024-2029 (%)
- Data Table on UK - Year-over-year growth 2024-2029 (%)
- 11.12 Japan - Market size and forecast 2024-2029
- Chart on Japan - Market size and forecast 2024-2029 ($ million)
- Data Table on Japan - Market size and forecast 2024-2029 ($ million)
- Chart on Japan - Year-over-year growth 2024-2029 (%)
- Data Table on Japan - Year-over-year growth 2024-2029 (%)
- 11.13 Canada - Market size and forecast 2024-2029
- Chart on Canada - Market size and forecast 2024-2029 ($ million)
- Data Table on Canada - Market size and forecast 2024-2029 ($ million)
- Chart on Canada - Year-over-year growth 2024-2029 (%)
- Data Table on Canada - Year-over-year growth 2024-2029 (%)
- 11.14 France - Market size and forecast 2024-2029
- Chart on France - Market size and forecast 2024-2029 ($ million)
- Data Table on France - Market size and forecast 2024-2029 ($ million)
- Chart on France - Year-over-year growth 2024-2029 (%)
- Data Table on France - Year-over-year growth 2024-2029 (%)
- 11.15 India - Market size and forecast 2024-2029
- Chart on India - Market size and forecast 2024-2029 ($ million)
- Data Table on India - Market size and forecast 2024-2029 ($ million)
- Chart on India - Year-over-year growth 2024-2029 (%)
- Data Table on India - Year-over-year growth 2024-2029 (%)
- 11.16 Spain - Market size and forecast 2024-2029
- Chart on Spain - Market size and forecast 2024-2029 ($ million)
- Data Table on Spain - Market size and forecast 2024-2029 ($ million)
- Chart on Spain - Year-over-year growth 2024-2029 (%)
- Data Table on Spain - Year-over-year growth 2024-2029 (%)
- 11.17 Brazil - Market size and forecast 2024-2029
- Chart on Brazil - Market size and forecast 2024-2029 ($ million)
- Data Table on Brazil - Market size and forecast 2024-2029 ($ million)
- Chart on Brazil - Year-over-year growth 2024-2029 (%)
- Data Table on Brazil - Year-over-year growth 2024-2029 (%)
- 11.18 Market opportunity By Geographical Landscape
- Market opportunity By Geographical Landscape ($ million)
- Data Tables on Market opportunity By Geographical Landscape ($ million)
12 Drivers, Challenges, and Opportunity/Restraints
- 12.1 Market drivers
- 12.2 Market challenges
- 12.3 Impact of drivers and challenges
- Impact of drivers and challenges in 2024 and 2029
- 12.4 Market opportunities/restraints
13 Competitive Landscape
- 13.1 Overview
- 13.2 Competitive Landscape
- Overview on criticality of inputs and factors of differentiation
- 13.3 Landscape disruption
- Overview on factors of disruption
- 13.4 Industry risks
- Impact of key risks on business
14 Competitive Analysis
- 14.1 Companies profiled
- Companies covered
- 14.2 Company ranking index
- Company ranking index
- 14.3 Market positioning of companies
- Matrix on companies position and classification
- 14.4 Anheuser Busch InBev SA NV
- Anheuser Busch InBev SA NV - Overview
- Anheuser Busch InBev SA NV - Product / Service
- Anheuser Busch InBev SA NV - Key offerings
- SWOT
- 14.5 Asahi Group Holdings Ltd.
- Asahi Group Holdings Ltd. - Overview
- Asahi Group Holdings Ltd. - Business segments
- Asahi Group Holdings Ltd. - Key news
- Asahi Group Holdings Ltd. - Key offerings
- Asahi Group Holdings Ltd. - Segment focus
- SWOT
- 14.6 Bacardi and Co Ltd
- Bacardi and Co Ltd - Overview
- Bacardi and Co Ltd - Product / Service
- Bacardi and Co Ltd - Key news
- Bacardi and Co Ltd - Key offerings
- SWOT
- 14.7 Becle SAB de CV
- Becle SAB de CV - Overview
- Becle SAB de CV - Business segments
- Becle SAB de CV - Key offerings
- Becle SAB de CV - Segment focus
- SWOT
- 14.8 Brown Forman Corp.
- Brown Forman Corp. - Overview
- Brown Forman Corp. - Product / Service
- Brown Forman Corp. - Key offerings
- SWOT
- 14.9 Crook and Marker LLC
- Crook and Marker LLC - Overview
- Crook and Marker LLC - Product / Service
- Crook and Marker LLC - Key offerings
- SWOT
- 14.10 Davide Campari-Milano N.V.
- Davide Campari-Milano N.V. - Overview
- Davide Campari-Milano N.V. - Business segments
- Davide Campari-Milano N.V. - Key offerings
- Davide Campari-Milano N.V. - Segment focus
- SWOT
- 14.11 Diageo PLC
- Diageo PLC - Overview
- Diageo PLC - Business segments
- Diageo PLC - Key news
- Diageo PLC - Key offerings
- Diageo PLC - Segment focus
- SWOT
- 14.12 House of Monaco
- House of Monaco - Overview
- House of Monaco - Product / Service
- House of Monaco - Key offerings
- SWOT
- 14.13 Lucas Bols Amsterdam BV
- Lucas Bols Amsterdam BV - Overview
- Lucas Bols Amsterdam BV - Product / Service
- Lucas Bols Amsterdam BV - Key offerings
- SWOT
- 14.14 Manly Spirits Co.
- Manly Spirits Co. - Overview
- Manly Spirits Co. - Product / Service
- Manly Spirits Co. - Key offerings
- SWOT
- 14.15 Molson Coors Beverage Co.
- Molson Coors Beverage Co. - Overview
- Molson Coors Beverage Co. - Business segments
- Molson Coors Beverage Co. - Key offerings
- Molson Coors Beverage Co. - Segment focus
- SWOT
- 14.16 Pernod Ricard SA
- Pernod Ricard SA - Overview
- Pernod Ricard SA - Product / Service
- Pernod Ricard SA - Key news
- Pernod Ricard SA - Key offerings
- SWOT
- 14.17 Suntory Holdings Ltd.
- Suntory Holdings Ltd. - Overview
- Suntory Holdings Ltd. - Business segments
- Suntory Holdings Ltd. - Key news
- Suntory Holdings Ltd. - Key offerings
- Suntory Holdings Ltd. - Segment focus
- SWOT
- 14.18 The Boston Beer Co. Inc.
- The Boston Beer Co. Inc. - Overview
- The Boston Beer Co. Inc. - Product / Service
- The Boston Beer Co. Inc. - Key offerings
- SWOT
15 Appendix
- 15.1 Scope of the report
- 15.2 Inclusions and exclusions checklist
- Inclusions checklist
- Exclusions checklist
- 15.3 Currency conversion rates for US$
- Currency conversion rates for US$
- 15.4 Research methodology
- Research methodology
- 15.5 Data procurement
- Information sources
- 15.6 Data validation
- Data validation
- 15.7 Validation techniques employed for market sizing
- Validation techniques employed for market sizing
- 15.8 Data synthesis
- Data synthesis
- 15.9 360 degree market analysis
- 360 degree market analysis
- 15.10 List of abbreviations
- List of abbreviations

