|
|
市場調査レポート
商品コード
1937207
電気自動車(EV)の世界市場 2026年~2030年Global Electric Vehicle (EV) Market 2026-2030 |
||||||
|
|||||||
カスタマイズ可能
|
|||||||

| 電気自動車(EV)の世界市場 2026年~2030年 |
|
出版日: 2026年02月11日
発行: TechNavio
ページ情報: 英文 305 Pages
納期: 即納可能
|

概要
世界の電気自動車(EV)市場は、2025年から2030年にかけて5,214億米ドル規模に成長し、予測期間中のCAGRは16.7%と予測されております。
本報告書では、世界の電気自動車(EV)市場に関する包括的な分析、市場規模と予測、動向、成長要因、課題に加え、約25社のベンダー分析を提供しております。
本レポートは、現在の市場状況、最新の動向と促進要因、市場環境全般に関する最新の分析を提供します。市場は、政府の厳格な規制と政策、財政的インセンティブ、バッテリー技術の進歩とコスト低下、高まる環境意識、変化する消費者嗜好によって牽引されています。
本調査は、業界の主要関係者からの情報を含む、一次情報と二次情報の客観的な組み合わせを用いて実施されました。本レポートには、主要企業の分析に加え、包括的な市場規模データ、地域別分析を伴うセグメント、ベンダー情勢が含まれています。レポートには過去データと予測データが掲載されています。
| 市場範囲 | |
|---|---|
| 基準年 | 2026年 |
| 終了年 | 2030年 |
| 予測期間 | 2026年~2030年 |
| 成長モメンタム | 加速 |
| 前年比2026年 | 14.5% |
| CAGR | 16.7% |
| 増分額 | 5,214億米ドル |
本調査では、今後数年間における世界の電気自動車(EV)市場の成長を牽引する主な要因の一つとして、電気自動車モデルの普及と多様化を挙げております。また、コネクティビティ、ソフトウェア、自動運転技術の統合の深化、ならびに充電・エネルギーサービスを含む統合エコシステムの開発が、市場において相当な需要を生み出すと予測されます。
目次
第1章 エグゼクティブサマリー
第2章 Technavio分析
- 価格・ライフサイクル・顧客購入バスケット・採用率・購入基準の分析
- インプットの重要性と差別化の要因
- 混乱の要因
- 促進要因と課題の影響
第3章 市場情勢
- 市場エコシステム
- 市場の特徴
- バリューチェーン分析
第4章 市場規模
- 市場の定義
- 市場セグメント分析
- 市場規模、2025年
- 市場の見通し、2025年~2030年
第5章 市場規模実績
- 電気自動車(EV)の世界市場、2020年~2024年
- タイプセグメント分析、2020年~2024年
- 充電方式セグメント分析、2020年~2024年
- 車両タイプセグメント分析、2020年~2024年
- 地域別セグメント分析、2020年~2024年
- 国別セグメント分析、2020年~2024年
第6章 定性分析
- AIの影響:電気自動車(EV)の世界市場
第7章 ファイブフォース分析
- ファイブフォースの要約
- 買い手の交渉力
- 供給企業の交渉力
- 新規参入業者の脅威
- 代替品の脅威
- 競争の脅威
- 市況
第8章 市場セグメンテーション:タイプ別
- 比較:タイプ別
- BEV
- PHEV
- 市場機会:タイプ別
第9章 市場セグメンテーション:充電方式別
- 比較:充電方式別
- 通常充電
- 急速充電
- 市場機会:充電方式別
第10章 市場セグメンテーション:車両タイプ別
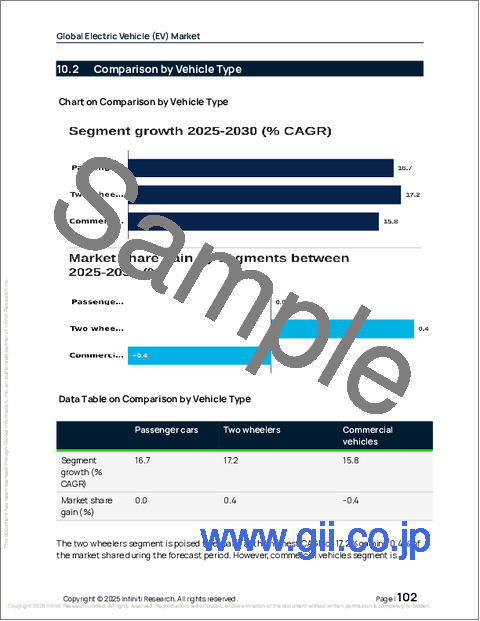
- 比較:車両タイプ別
- 乗用車
- 二輪車
- 商用車
- 市場機会:車両タイプ別
第11章 顧客情勢
第12章 地域別情勢
- 地域別セグメンテーション
- 地域別比較
- アジア太平洋
- 中国
- 日本
- インド
- 韓国
- オーストラリア
- インドネシア
- 欧州
- ドイツ
- 英国
- フランス
- オランダ
- ノルウェー
- イタリア
- 北米
- 米国
- カナダ
- メキシコ
- 南米
- ブラジル
- アルゼンチン
- チリ
- 中東・アフリカ
- アラブ首長国連邦
- 南アフリカ
- サウジアラビア
- エジプト
- ケニア
- 市場機会:地域別
第13章 促進要因・課題・機会
- 市場促進要因
- 市場の課題
- 促進要因と課題の影響
- 市場機会
第14章 競合情勢
- 概要
- 競合情勢
- 混乱の状況
- 業界のリスク
第15章 競合分析
- 企業プロファイル
- 企業ランキング指標
- 企業の市場ポジショニング
- Bayerische Motoren Werke AG
- BYD Co. Ltd.
- Ford Motor Co.
- Geely Auto
- General Motors Co.
- Honda Motor Co. Ltd.
- Hyundai Motor Co.
- Mercedes Benz Group AG
- Nissan Motor Co. Ltd.
- Renault SAS
- SAIC Motor Corp. Ltd.
- Stellantis NV
- Tesla Inc.
- Toyota Motor Corp.
- Volkswagen AG

