|
|
市場調査レポート
商品コード
1660806
教育分野における人工知能(AI)の世界市場(2025年~2029年)Global Artificial Intelligence (AI) Market in Education Sector 2025-2029 |
||||||

|
|||||||
カスタマイズ可能
|
|||||||


| 教育分野における人工知能(AI)の世界市場(2025年~2029年) |
|
出版日: 2025年02月15日
発行: TechNavio
ページ情報: 英文 238 Pages
納期: 即納可能
|

全表示
- 概要
- 目次
教育分野における人工知能(AI)市場(2025年~2029年)
世界の教育分野における人工知能(AI)の市場規模は、2024年~2029年に40億3,000万米ドルに達し、予測期間中のCAGRは59.2%で成長すると予測されています。当レポートでは、教育分野における人工知能(AI)の全体的な分析、市場規模・予測、動向、成長促進要因、課題、約25のベンダーを網羅したベンダー分析などを掲載しています。
当レポートは、現在の市場シナリオ、最新動向と促進要因、市場環境全体に関する最新分析を提供しています。市場は、AIを利用したカスタマイズ学習経路の重視の高まり、その需要の増加、AIアプリケーションの広い範囲によって牽引されています。
| 市場範囲 | |
|---|---|
| 基準年 | 2025年 |
| 終了年 | 2029年 |
| 予測期間 | 2025年~2029年 |
| 成長モメンタム | 加速 |
| 前年比2025年 | 42.2% |
| CAGR | 59.2% |
| 増分額 | 40億3,000万米ドル |
本調査は、業界の主要参入企業からのインプットを含め、一次情報と二次情報を客観的に組み合わせて実施しました。レポートには、主要企業の分析に加え、包括的な市場規模データ、地域分析によるセグメント、ベンダー情勢が含まれています。レポートには実績データと予測データがあります。
本調査では、今後数年間の教育分野における人工知能(AI)の成長を促進する主な理由の1つとして、チャットボットへの重点の高まりを挙げています。また、クラウドソーシングによる個別指導の重視の高まりや、コンテンツ分析の重視の高まりは、市場の大きな需要につながります。
目次
第1章 エグゼクティブサマリー
- 市場概要
第2章 Technavioの分析
- 価格感度・ライフサイクル・顧客購入バスケット・採用率・購入基準の分析
- インプットの重要性と差別化の要因
- ディスラプションの要因
- 促進要因と課題の影響
第3章 市場情勢
- 市場エコシステム
- 市場の特徴
- バリューチェーン分析
第4章 市場規模
- 市場の定義
- 市場セグメント分析
- 市場規模(2024年)
- 市場の見通し(2024年~2029年)
第5章 市場規模実績
- 教育分野における人工知能(AI)の世界市場(2019年~2023年)
- エンドユーザーセグメント分析(2019年~2023年)
- 学習方法セグメント分析(2019年~2023年)
- コンポーネントセグメント分析(2019年~2023年)
- 用途セグメント分析(2019年~2023年)
- 地域セグメント分析(2019年~2023年)
- 国セグメント分析(2019年~2023年)
第6章 定性分析
- AIの影響:教育分野における人工知能(AI)の世界市場
第7章 ファイブフォース分析
- ファイブフォースの要約
- 買い手の交渉力
- 供給企業の交渉力
- 新規参入業者の脅威
- 代替品の脅威
- 競争の脅威
- 市況
第8章 市場セグメンテーション:エンドユーザー別
- 市場セグメント
- 比較:エンドユーザー別
- 高等教育:市場規模と予測(2024年~2029年)
- K-12:市場規模と予測(2024年~2029年)
- 市場機会:エンドユーザー別
第9章 市場セグメンテーション:学習方法別
- 市場セグメント
- 比較:学習方法別
- 学習者モデル:市場規模と予測(2024年~2029年)
- 教育モデル:市場規模と予測(2024年~2029年)
- ドメインモデル:市場規模と予測(2024年~2029年)
- 市場機会:学習方法別
第10章 市場セグメンテーション:コンポーネント別
- 市場セグメント
- 比較:コンポーネント別
- ソリューション:市場規模と予測(2024年~2029年)
- サービス:市場規模と予測(2024年~2029年)
- 市場機会:コンポーネント別
第11章 市場セグメンテーション:用途別
- 市場セグメント
- 比較:用途別
- 学習プラットフォームと仮想ファシリテーター:市場規模と予測(2024年~2029年)
- インテリジェント指導システム(ITS):市場規模と予測(2024年~2029年)
- スマートコンテンツ:市場規模と予測(2024年~2029年)
- 不正・リスク管理:市場規模と予測(2024年~2029年)
- その他:市場規模と予測(2024年~2029年)
- 市場機会:用途別
第12章 顧客情勢
- 顧客情勢の概要
第13章 地域別情勢
- 地域別セグメンテーション
- 地域別比較
- 北米:市場規模と予測(2024年~2029年)
- 欧州:市場規模と予測(2024年~2029年)
- アジア太平洋:市場規模と予測(2024年~2029年)
- 南米:市場規模と予測(2024年~2029年)
- 中東・アフリカ:市場規模と予測(2024年~2029年)
- 米国:市場規模と予測(2024年~2029年)
- 中国:市場規模と予測(2024年~2029年)
- 英国:市場規模と予測(2024年~2029年)
- ドイツ:市場規模と予測(2024年~2029年)
- カナダ:市場規模と予測(2024年~2029年)
- 日本:市場規模と予測(2024年~2029年)
- インド:市場規模と予測(2024年~2029年)
- フランス:市場規模と予測(2024年~2029年)
- ブラジル:市場規模と予測(2024年~2029年)
- アラブ首長国連邦:市場規模と予測(2024年~2029年)
- 市場機会:地域情勢別
第14章 促進要因・課題・機会・抑制要因
- 市場促進要因
- 市場の課題
- 促進要因と課題の影響
- 市場の機会・抑制要因
第15章 競合情勢
- 概要
- 競合情勢
- ディスラプションの状況
- 業界のリスク
第16章 競合分析
- 企業プロファイル
- 企業ランキング指数
- 企業の市場ポジショニング
- Century Tech Ltd.
- Cognii Inc.
- DreamBox Learning Inc.
- edX LLC
- Fishtree Inc.
- Google LLC
- International Business Machines Corp.
- Jenzabar Inc.
- John Wiley and Sons Inc.
- LAIX Inc.
- McGraw Hill LLC
- Microsoft Corp.
- n2y LLC
- Pearson Plc
- Quantum Adaptive Learning LLC
第17章 付録
Artificial Intelligence (AI) Market In Education Sector 2025-2029
The artificial intelligence (AI) market in education sector is forecasted to grow by USD 4030 million during 2024-2029, accelerating at a CAGR of 59.2% during the forecast period. The report on the artificial intelligence (AI) market in education sector provides a holistic analysis, market size and forecast, trends, growth drivers, and challenges, as well as vendor analysis covering around 25 vendors.
The report offers an up-to-date analysis regarding the current market scenario, the latest trends and drivers, and the overall market environment. The market is driven by growing emphasis on customized learning paths using AI, increasing demand for its, and significant scope of AI applications.
| Market Scope | |
|---|---|
| Base Year | 2025 |
| End Year | 2029 |
| Series Year | 2025-2029 |
| Growth Momentum | Accelerate |
| YOY 2025 | 42.2% |
| CAGR | 59.2% |
| Incremental Value | $4030 mn |
The study was conducted using an objective combination of primary and secondary information including inputs from key participants in the industry. The report contains a comprehensive market size data, segment with regional analysis and vendor landscape in addition to an analysis of the key companies. Reports have historic and forecast data.
Technavio's artificial intelligence (AI) market in education sector is segmented as below:
By End-user
- Higher education
- K-12
By Learning Method
- Learner model
- Pedagogical model
- Domain model
By Component
- Solutions
- Services
By Application
- Learning platform and virtual facilitators
- Intelligent tutoring system (ITS)
- Smart content
- Fraud and risk management
- Others
By Geographical Landscape
- North America
- Europe
- APAC
- South America
- Middle East and Africa
This study identifies the increased emphasis on chatbots as one of the prime reasons driving the artificial intelligence (AI) market in education sector growth during the next few years. Also, growing emphasis on crowd-sourced tutoring and increasing emphasis on content analytics will lead to sizable demand in the market.
The report on the artificial intelligence (AI) market in education sector covers the following areas:
- Artificial Intelligence (AI) Market In Education Sector sizing
- Artificial Intelligence (AI) Market In Education Sector forecast
- Artificial Intelligence (AI) Market In Education Sector industry analysis
The robust vendor analysis is designed to help clients improve their market position, and in line with this, this report provides a detailed analysis of several leading artificial intelligence (AI) market in education sector vendors that include Amazon.com Inc., Brainly, Carnegie Learning Inc., Century Tech Ltd., Cognii Inc., Cognizant Technology Solutions Corp., DreamBox Learning Inc., edX LLC, Fishtree Inc., Google LLC, International Business Machines Corp., Jenzabar Inc., John Wiley and Sons Inc., Kaltura Inc., LAIX Inc., McGraw Hill LLC, Microsoft Corp., n2y LLC, Pearson PLC, and Quantum Adaptive Learning LLC. Also, the artificial intelligence (AI) market in education sector analysis report includes information on upcoming trends and challenges that will influence market growth. This is to help companies strategize and leverage all forthcoming growth opportunities.
The publisher presents a detailed picture of the market by the way of study, synthesis, and summation of data from multiple sources by an analysis of key parameters such as profit, pricing, competition, and promotions. It presents various market facets by identifying the key industry influencers. The data presented is comprehensive, reliable, and a result of extensive primary and secondary research. The market research reports provide a complete competitive landscape and an in-depth vendor selection methodology and analysis using qualitative and quantitative research to forecast accurate market growth.
Table of Contents
1 Executive Summary
- 1.1 Market overview
- Executive Summary - Chart on Market Overview
- Executive Summary - Data Table on Market Overview
- Executive Summary - Chart on Global Market Characteristics
- Executive Summary - Chart on Market By Geographical Landscape
- Executive Summary - Chart on Market Segmentation by End-user
- Executive Summary - Chart on Market Segmentation by Learning Method
- Executive Summary - Chart on Market Segmentation by Component
- Executive Summary - Chart on Market Segmentation by Application
- Executive Summary - Chart on Incremental Growth
- Executive Summary - Data Table on Incremental Growth
- Executive Summary - Chart on Company Market Positioning
2 Technavio Analysis
- 2.1 Analysis of price sensitivity, lifecycle, customer purchase basket, adoption rates, and purchase criteria
- Analysis of price sensitivity, lifecycle, customer purchase basket, adoption rates, and purchase criteria
- 2.2 Criticality of inputs and Factors of differentiation
- Overview on criticality of inputs and factors of differentiation
- 2.3 Factors of disruption
- Overview on factors of disruption
- 2.4 Impact of drivers and challenges
- Impact of drivers and challenges in 2024 and 2029
3 Market Landscape
- 3.1 Market ecosystem
- Parent Market
- Data Table on - Parent Market
- 3.2 Market characteristics
- Market characteristics analysis
- 3.3 Value chain analysis
- Value chain analysis
4 Market Sizing
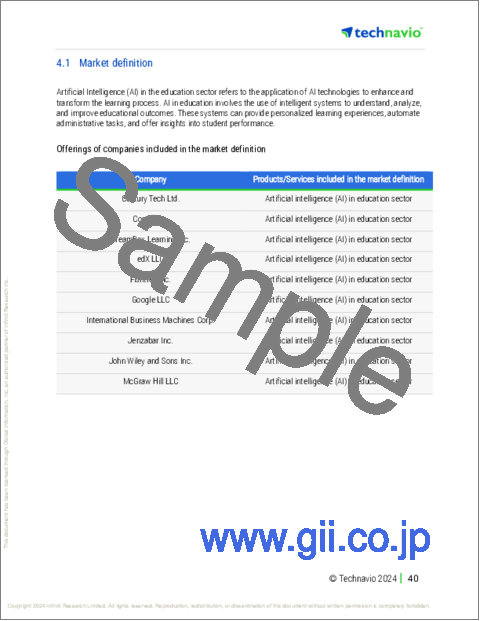
- 4.1 Market definition
- Offerings of companies included in the market definition
- 4.2 Market segment analysis
- Market segments
- 4.3 Market size 2024
- 4.4 Market outlook: Forecast for 2024-2029
- Chart on Global - Market size and forecast 2024-2029 ($ million)
- Data Table on Global - Market size and forecast 2024-2029 ($ million)
- Chart on Global Market: Year-over-year growth 2024-2029 (%)
- Data Table on Global Market: Year-over-year growth 2024-2029 (%)
5 Historic Market Size
- 5.1 Global Artificial Intelligence (AI) Market In Education Sector 2019 - 2023
- Historic Market Size - Data Table on Global Artificial Intelligence (AI) Market In Education Sector 2019 - 2023 ($ million)
- 5.2 End-user segment analysis 2019 - 2023
- Historic Market Size - End-user Segment 2019 - 2023 ($ million)
- 5.3 Learning Method segment analysis 2019 - 2023
- Historic Market Size - Learning Method Segment 2019 - 2023 ($ million)
- 5.4 Component segment analysis 2019 - 2023
- Historic Market Size - Component Segment 2019 - 2023 ($ million)
- 5.5 Application segment analysis 2019 - 2023
- Historic Market Size - Application Segment 2019 - 2023 ($ million)
- 5.6 Geography segment analysis 2019 - 2023
- Historic Market Size - Geography Segment 2019 - 2023 ($ million)
- 5.7 Country segment analysis 2019 - 2023
- Historic Market Size - Country Segment 2019 - 2023 ($ million)
6 Qualitative Analysis
- 6.1 The AI impact on Global Artificial Intelligence (AI) Market in Education Sector
7 Five Forces Analysis
- 7.1 Five forces summary
- Five forces analysis - Comparison between 2024 and 2029
- 7.2 Bargaining power of buyers
- Bargaining power of buyers - Impact of key factors 2024 and 2029
- 7.3 Bargaining power of suppliers
- Bargaining power of suppliers - Impact of key factors in 2024 and 2029
- 7.4 Threat of new entrants
- Threat of new entrants - Impact of key factors in 2024 and 2029
- 7.5 Threat of substitutes
- Threat of substitutes - Impact of key factors in 2024 and 2029
- 7.6 Threat of rivalry
- Threat of rivalry - Impact of key factors in 2024 and 2029
- 7.7 Market condition
- Chart on Market condition - Five forces 2024 and 2029
8 Market Segmentation by End-user
- 8.1 Market segments
- Chart on End-user - Market share 2024-2029 (%)
- Data Table on End-user - Market share 2024-2029 (%)
- 8.2 Comparison by End-user
- Chart on Comparison by End-user
- Data Table on Comparison by End-user
- 8.3 Higher education - Market size and forecast 2024-2029
- Chart on Higher education - Market size and forecast 2024-2029 ($ million)
- Data Table on Higher education - Market size and forecast 2024-2029 ($ million)
- Chart on Higher education - Year-over-year growth 2024-2029 (%)
- Data Table on Higher education - Year-over-year growth 2024-2029 (%)
- 8.4 K-12 - Market size and forecast 2024-2029
- Chart on K-12 - Market size and forecast 2024-2029 ($ million)
- Data Table on K-12 - Market size and forecast 2024-2029 ($ million)
- Chart on K-12 - Year-over-year growth 2024-2029 (%)
- Data Table on K-12 - Year-over-year growth 2024-2029 (%)
- 8.5 Market opportunity by End-user
- Market opportunity by End-user ($ million)
- Data Table on Market opportunity by End-user ($ million)
9 Market Segmentation by Learning Method
- 9.1 Market segments
- Chart on Learning Method - Market share 2024-2029 (%)
- Data Table on Learning Method - Market share 2024-2029 (%)
- 9.2 Comparison by Learning Method
- Chart on Comparison by Learning Method
- Data Table on Comparison by Learning Method
- 9.3 Learner model - Market size and forecast 2024-2029
- Chart on Learner model - Market size and forecast 2024-2029 ($ million)
- Data Table on Learner model - Market size and forecast 2024-2029 ($ million)
- Chart on Learner model - Year-over-year growth 2024-2029 (%)
- Data Table on Learner model - Year-over-year growth 2024-2029 (%)
- 9.4 Pedagogical model - Market size and forecast 2024-2029
- Chart on Pedagogical model - Market size and forecast 2024-2029 ($ million)
- Data Table on Pedagogical model - Market size and forecast 2024-2029 ($ million)
- Chart on Pedagogical model - Year-over-year growth 2024-2029 (%)
- Data Table on Pedagogical model - Year-over-year growth 2024-2029 (%)
- 9.5 Domain model - Market size and forecast 2024-2029
- Chart on Domain model - Market size and forecast 2024-2029 ($ million)
- Data Table on Domain model - Market size and forecast 2024-2029 ($ million)
- Chart on Domain model - Year-over-year growth 2024-2029 (%)
- Data Table on Domain model - Year-over-year growth 2024-2029 (%)
- 9.6 Market opportunity by Learning Method
- Market opportunity by Learning Method ($ million)
- Data Table on Market opportunity by Learning Method ($ million)
10 Market Segmentation by Component
- 10.1 Market segments
- Chart on Component - Market share 2024-2029 (%)
- Data Table on Component - Market share 2024-2029 (%)
- 10.2 Comparison by Component
- Chart on Comparison by Component
- Data Table on Comparison by Component
- 10.3 Solutions - Market size and forecast 2024-2029
- Chart on Solutions - Market size and forecast 2024-2029 ($ million)
- Data Table on Solutions - Market size and forecast 2024-2029 ($ million)
- Chart on Solutions - Year-over-year growth 2024-2029 (%)
- Data Table on Solutions - Year-over-year growth 2024-2029 (%)
- 10.4 Services - Market size and forecast 2024-2029
- Chart on Services - Market size and forecast 2024-2029 ($ million)
- Data Table on Services - Market size and forecast 2024-2029 ($ million)
- Chart on Services - Year-over-year growth 2024-2029 (%)
- Data Table on Services - Year-over-year growth 2024-2029 (%)
- 10.5 Market opportunity by Component
- Market opportunity by Component ($ million)
- Data Table on Market opportunity by Component ($ million)
11 Market Segmentation by Application
- 11.1 Market segments
- Chart on Application - Market share 2024-2029 (%)
- Data Table on Application - Market share 2024-2029 (%)
- 11.2 Comparison by Application
- Chart on Comparison by Application
- Data Table on Comparison by Application
- 11.3 Learning platform and virtual facilitators - Market size and forecast 2024-2029
- Chart on Learning platform and virtual facilitators - Market size and forecast 2024-2029 ($ million)
- Data Table on Learning platform and virtual facilitators - Market size and forecast 2024-2029 ($ million)
- Chart on Learning platform and virtual facilitators - Year-over-year growth 2024-2029 (%)
- Data Table on Learning platform and virtual facilitators - Year-over-year growth 2024-2029 (%)
- 11.4 Intelligent tutoring system (ITS) - Market size and forecast 2024-2029
- Chart on Intelligent tutoring system (ITS) - Market size and forecast 2024-2029 ($ million)
- Data Table on Intelligent tutoring system (ITS) - Market size and forecast 2024-2029 ($ million)
- Chart on Intelligent tutoring system (ITS) - Year-over-year growth 2024-2029 (%)
- Data Table on Intelligent tutoring system (ITS) - Year-over-year growth 2024-2029 (%)
- 11.5 Smart content - Market size and forecast 2024-2029
- Chart on Smart content - Market size and forecast 2024-2029 ($ million)
- Data Table on Smart content - Market size and forecast 2024-2029 ($ million)
- Chart on Smart content - Year-over-year growth 2024-2029 (%)
- Data Table on Smart content - Year-over-year growth 2024-2029 (%)
- 11.6 Fraud and risk management - Market size and forecast 2024-2029
- Chart on Fraud and risk management - Market size and forecast 2024-2029 ($ million)
- Data Table on Fraud and risk management - Market size and forecast 2024-2029 ($ million)
- Chart on Fraud and risk management - Year-over-year growth 2024-2029 (%)
- Data Table on Fraud and risk management - Year-over-year growth 2024-2029 (%)
- 11.7 Others - Market size and forecast 2024-2029
- Chart on Others - Market size and forecast 2024-2029 ($ million)
- Data Table on Others - Market size and forecast 2024-2029 ($ million)
- Chart on Others - Year-over-year growth 2024-2029 (%)
- Data Table on Others - Year-over-year growth 2024-2029 (%)
- 11.8 Market opportunity by Application
- Market opportunity by Application ($ million)
- Data Table on Market opportunity by Application ($ million)
12 Customer Landscape
- 12.1 Customer landscape overview
- Analysis of price sensitivity, lifecycle, customer purchase basket, adoption rates, and purchase criteria
13 Geographic Landscape
- 13.1 Geographic segmentation
- Chart on Market share By Geographical Landscape 2024-2029 (%)
- Data Table on Market share By Geographical Landscape 2024-2029 (%)
- 13.2 Geographic comparison
- Chart on Geographic comparison
- Data Table on Geographic comparison
- 13.3 North America - Market size and forecast 2024-2029
- Chart on North America - Market size and forecast 2024-2029 ($ million)
- Data Table on North America - Market size and forecast 2024-2029 ($ million)
- Chart on North America - Year-over-year growth 2024-2029 (%)
- Data Table on North America - Year-over-year growth 2024-2029 (%)
- 13.4 Europe - Market size and forecast 2024-2029
- Chart on Europe - Market size and forecast 2024-2029 ($ million)
- Data Table on Europe - Market size and forecast 2024-2029 ($ million)
- Chart on Europe - Year-over-year growth 2024-2029 (%)
- Data Table on Europe - Year-over-year growth 2024-2029 (%)
- 13.5 APAC - Market size and forecast 2024-2029
- Chart on APAC - Market size and forecast 2024-2029 ($ million)
- Data Table on APAC - Market size and forecast 2024-2029 ($ million)
- Chart on APAC - Year-over-year growth 2024-2029 (%)
- Data Table on APAC - Year-over-year growth 2024-2029 (%)
- 13.6 South America - Market size and forecast 2024-2029
- Chart on South America - Market size and forecast 2024-2029 ($ million)
- Data Table on South America - Market size and forecast 2024-2029 ($ million)
- Chart on South America - Year-over-year growth 2024-2029 (%)
- Data Table on South America - Year-over-year growth 2024-2029 (%)
- 13.7 Middle East and Africa - Market size and forecast 2024-2029
- Chart on Middle East and Africa - Market size and forecast 2024-2029 ($ million)
- Data Table on Middle East and Africa - Market size and forecast 2024-2029 ($ million)
- Chart on Middle East and Africa - Year-over-year growth 2024-2029 (%)
- Data Table on Middle East and Africa - Year-over-year growth 2024-2029 (%)
- 13.8 US - Market size and forecast 2024-2029
- Chart on US - Market size and forecast 2024-2029 ($ million)
- Data Table on US - Market size and forecast 2024-2029 ($ million)
- Chart on US - Year-over-year growth 2024-2029 (%)
- Data Table on US - Year-over-year growth 2024-2029 (%)
- 13.9 China - Market size and forecast 2024-2029
- Chart on China - Market size and forecast 2024-2029 ($ million)
- Data Table on China - Market size and forecast 2024-2029 ($ million)
- Chart on China - Year-over-year growth 2024-2029 (%)
- Data Table on China - Year-over-year growth 2024-2029 (%)
- 13.10 UK - Market size and forecast 2024-2029
- Chart on UK - Market size and forecast 2024-2029 ($ million)
- Data Table on UK - Market size and forecast 2024-2029 ($ million)
- Chart on UK - Year-over-year growth 2024-2029 (%)
- Data Table on UK - Year-over-year growth 2024-2029 (%)
- 13.11 Germany - Market size and forecast 2024-2029
- Chart on Germany - Market size and forecast 2024-2029 ($ million)
- Data Table on Germany - Market size and forecast 2024-2029 ($ million)
- Chart on Germany - Year-over-year growth 2024-2029 (%)
- Data Table on Germany - Year-over-year growth 2024-2029 (%)
- 13.12 Canada - Market size and forecast 2024-2029
- Chart on Canada - Market size and forecast 2024-2029 ($ million)
- Data Table on Canada - Market size and forecast 2024-2029 ($ million)
- Chart on Canada - Year-over-year growth 2024-2029 (%)
- Data Table on Canada - Year-over-year growth 2024-2029 (%)
- 13.13 Japan - Market size and forecast 2024-2029
- Chart on Japan - Market size and forecast 2024-2029 ($ million)
- Data Table on Japan - Market size and forecast 2024-2029 ($ million)
- Chart on Japan - Year-over-year growth 2024-2029 (%)
- Data Table on Japan - Year-over-year growth 2024-2029 (%)
- 13.14 India - Market size and forecast 2024-2029
- Chart on India - Market size and forecast 2024-2029 ($ million)
- Data Table on India - Market size and forecast 2024-2029 ($ million)
- Chart on India - Year-over-year growth 2024-2029 (%)
- Data Table on India - Year-over-year growth 2024-2029 (%)
- 13.15 France - Market size and forecast 2024-2029
- Chart on France - Market size and forecast 2024-2029 ($ million)
- Data Table on France - Market size and forecast 2024-2029 ($ million)
- Chart on France - Year-over-year growth 2024-2029 (%)
- Data Table on France - Year-over-year growth 2024-2029 (%)
- 13.16 Brazil - Market size and forecast 2024-2029
- Chart on Brazil - Market size and forecast 2024-2029 ($ million)
- Data Table on Brazil - Market size and forecast 2024-2029 ($ million)
- Chart on Brazil - Year-over-year growth 2024-2029 (%)
- Data Table on Brazil - Year-over-year growth 2024-2029 (%)
- 13.17 UAE - Market size and forecast 2024-2029
- Chart on UAE - Market size and forecast 2024-2029 ($ million)
- Data Table on UAE - Market size and forecast 2024-2029 ($ million)
- Chart on UAE - Year-over-year growth 2024-2029 (%)
- Data Table on UAE - Year-over-year growth 2024-2029 (%)
- 13.18 Market opportunity By Geographical Landscape
- Market opportunity By Geographical Landscape ($ million)
- Data Tables on Market opportunity By Geographical Landscape ($ million)
14 Drivers, Challenges, and Opportunity/Restraints
- 14.1 Market drivers
- 14.2 Market challenges
- 14.3 Impact of drivers and challenges
- Impact of drivers and challenges in 2024 and 2029
- 14.4 Market opportunities/restraints
15 Competitive Landscape
- 15.1 Overview
- 15.2 Competitive Landscape
- Overview on criticality of inputs and factors of differentiation
- 15.3 Landscape disruption
- Overview on factors of disruption
- 15.4 Industry risks
- Impact of key risks on business
16 Competitive Analysis
- 16.1 Companies profiled
- Companies covered
- 16.2 Company ranking index
- Company ranking index
- 16.3 Market positioning of companies
- Matrix on companies position and classification
- 16.4 Century Tech Ltd.
- Century Tech Ltd. - Overview
- Century Tech Ltd. - Product / Service
- Century Tech Ltd. - Key offerings
- SWOT
- 16.5 Cognii Inc.
- Cognii Inc. - Overview
- Cognii Inc. - Product / Service
- Cognii Inc. - Key offerings
- SWOT
- 16.6 DreamBox Learning Inc.
- DreamBox Learning Inc. - Overview
- DreamBox Learning Inc. - Product / Service
- DreamBox Learning Inc. - Key offerings
- SWOT
- 16.7 edX LLC
- edX LLC - Overview
- edX LLC - Product / Service
- edX LLC - Key news
- edX LLC - Key offerings
- SWOT
- 16.8 Fishtree Inc.
- Fishtree Inc. - Overview
- Fishtree Inc. - Product / Service
- Fishtree Inc. - Key offerings
- SWOT
- 16.9 Google LLC
- Google LLC - Overview
- Google LLC - Product / Service
- Google LLC - Key news
- Google LLC - Key offerings
- SWOT
- 16.10 International Business Machines Corp.
- International Business Machines Corp. - Overview
- International Business Machines Corp. - Business segments
- International Business Machines Corp. - Key news
- International Business Machines Corp. - Key offerings
- International Business Machines Corp. - Segment focus
- SWOT
- 16.11 Jenzabar Inc.
- Jenzabar Inc. - Overview
- Jenzabar Inc. - Product / Service
- Jenzabar Inc. - Key offerings
- SWOT
- 16.12 John Wiley and Sons Inc.
- John Wiley and Sons Inc. - Overview
- John Wiley and Sons Inc. - Business segments
- John Wiley and Sons Inc. - Key offerings
- John Wiley and Sons Inc. - Segment focus
- SWOT
- 16.13 LAIX Inc.
- LAIX Inc. - Overview
- LAIX Inc. - Product / Service
- LAIX Inc. - Key offerings
- SWOT
- 16.14 McGraw Hill LLC
- McGraw Hill LLC - Overview
- McGraw Hill LLC - Product / Service
- McGraw Hill LLC - Key news
- McGraw Hill LLC - Key offerings
- SWOT
- 16.15 Microsoft Corp.
- Microsoft Corp. - Overview
- Microsoft Corp. - Business segments
- Microsoft Corp. - Key news
- Microsoft Corp. - Key offerings
- Microsoft Corp. - Segment focus
- SWOT
- 16.16 n2y LLC
- n2y LLC - Overview
- n2y LLC - Product / Service
- n2y LLC - Key offerings
- SWOT
- 16.17 Pearson Plc
- Pearson Plc - Overview
- Pearson Plc - Business segments
- Pearson Plc - Key news
- Pearson Plc - Key offerings
- Pearson Plc - Segment focus
- SWOT
- 16.18 Quantum Adaptive Learning LLC
- Quantum Adaptive Learning LLC - Overview
- Quantum Adaptive Learning LLC - Product / Service
- Quantum Adaptive Learning LLC - Key offerings
- SWOT
17 Appendix
- 17.1 Scope of the report
- 17.2 Inclusions and exclusions checklist
- Inclusions checklist
- Exclusions checklist
- 17.3 Currency conversion rates for US$
- Currency conversion rates for US$
- 17.4 Research methodology
- Research methodology
- 17.5 Data procurement
- Information sources
- 17.6 Data validation
- Data validation
- 17.7 Validation techniques employed for market sizing
- Validation techniques employed for market sizing
- 17.8 Data synthesis
- Data synthesis
- 17.9 360 degree market analysis
- 360 degree market analysis
- 17.10 List of abbreviations
- List of abbreviations
