|
|
市場調査レポート
商品コード
1626678
マイクロバイオームの世界市場 2025-2029年Global Microbiomes Market 2025-2029 |
||||||

|
|||||||
カスタマイズ可能
|
|||||||


| マイクロバイオームの世界市場 2025-2029年 |
|
出版日: 2024年12月25日
発行: TechNavio
ページ情報: 英文 204 Pages
納期: 即納可能
|

全表示
- 概要
- 図表
- 目次
マイクロバイオーム市場 2025-2029年
マイクロバイオーム市場は2024-2029年に8億2,430万米ドル、予測期間中のCAGRは18.3%で成長すると予測されます。当レポートでは、マイクロバイオーム市場の全体的な分析、市場規模・予測、動向、成長促進要因、課題、約25のベンダーを網羅したベンダー分析などを掲載しています。
現在の市場シナリオ、最新動向と促進要因、市場環境全体に関する最新分析を提供しています。市場は、疾患の有病率の増加、マイクロバイオーム研究に対する取り組みや投資の増加、マイクロバイオーム探索・治療・診断の進歩によって牽引されています。
| 市場範囲 | |
|---|---|
| 基準年 | 2025 |
| 終了年 | 2029 |
| 予測期間 | 2025-2029 |
| 成長モメンタム | 加速 |
| 前年比2025年 | 15.5% |
| CAGR | 18.3% |
| 増分額 | 8億2,430万米ドル |
本調査では、マイクロバイオーム治療薬開発のための多数の共同研究が、今後数年間のマイクロバイオーム市場の成長を促進する主要な理由の1つであると指摘しています。また、バイオセンサーや遺伝子回路の開発への注目の高まりや、規制の枠組みにおける開発は、市場の大きな需要につながります。
目次
第1章 エグゼクティブサマリー
- 市場概要
第2章 Technavio別分析
- 価格・ライフサイクル・顧客購入バスケット・採用率・購入基準の分析
- インプットの重要性と差別化の要因
- 混乱の要因
- 促進要因と課題の影響
第3章 市場情勢
- 市場エコシステム
- 市場の特徴
- バリューチェーン分析
第4章 市場規模
- 市場の定義
- 市場セグメント分析
- 市場規模 2024
- 市場の見通し 2024-2029
第5章 市場規模実績
- マイクロバイオームの世界市場 2019-2023
- 製品別セグメント分析 2019-2023
- 用途別セグメント分析 2019-2023
- 地域別セグメント分析 2019-2023
- 国別セグメント分析 2019-2023
第6章 定性分析
- AIの影響マイクロバイオームの世界市場
第7章 ファイブフォース分析
- ファイブフォースの要約
- 買い手の交渉力
- 供給企業の交渉力
- 新規参入業者の脅威
- 代替品の脅威
- 競争の脅威
- 市況
第8章 市場セグメンテーション:製品別
- 市場セグメント
- 比較:製品別
- プロバイオティクス:市場規模と予測 2024-2029
- 食品:市場規模と予測 2024-2029
- プレバイオティクス:市場規模と予測 2024-2029
- 医療食品:市場規模と予測 2024-2029
- その他:市場規模と予測 2024-2029
- 市場機会:製品別
第9章 市場セグメンテーション:用途別
- 市場セグメント
- 比較:用途別
- 治療薬:市場規模と予測 2024-2029
- 診断:市場規模と予測 2024-2029
- 市場機会:用途別
第10章 顧客情勢
- 顧客情勢の概要
第11章 地域別情勢
- 地域別セグメンテーション
- 地域別:比較
- 北米:市場規模と予測 2024-2029
- 欧州:市場規模と予測 2024-2029
- アジア:市場規模と予測 2024-2029
- 世界のその他の地域:市場規模と予測 2024-2029
- 米国:市場規模と予測 2024-2029
- ドイツ:市場規模と予測 2024-2029
- フランス:市場規模と予測 2024-2029
- 英国:市場規模と予測 2024-2029
- 日本:市場規模と予測 2024-2029
- カナダ:市場規模と予測 2024-2029
- 中国:市場規模と予測 2024-2029
- インド:市場規模と予測 2024-2029
- 韓国:市場規模と予測 2024-2029
- イタリア:市場規模と予測 2024-2029
- 市場機会:地域情勢別
第12章 促進要因・課題・機会・抑制要因
- 市場促進要因
- 市場の課題
- 促進要因と課題の影響
- 市場の機会・抑制要因
第13章 競合情勢
- 概要
- 競合情勢
- 混乱の状況
- 業界のリスク
第14章 競合分析
- 企業プロファイル
- 企業ランキング指数
- 企業の市場ポジショニング
- AOBiome LLC
- BiomX Inc.
- DuPont de Nemours Inc.
- Eligo Bioscience
- ENTEROME SA
- ExeGi Pharma
- Ferring BV
- MaaT Pharma
- OraSure Technologies Inc.
- Osel Inc.
- PureTech Health Plc
- Second Genome Therapeutics
- Seres Therapeutics Inc.
- Synlogic Inc.
- Theriva Biologics Inc.
第15章 付録
Exhibits:
- Exhibits1: Executive Summary - Chart on Market Overview
- Exhibits2: Executive Summary - Data Table on Market Overview
- Exhibits3: Executive Summary - Chart on Global Market Characteristics
- Exhibits4: Executive Summary - Chart on Market By Geographical Landscape
- Exhibits5: Executive Summary - Chart on Market Segmentation by Product
- Exhibits6: Executive Summary - Chart on Market Segmentation by Application
- Exhibits7: Executive Summary - Chart on Incremental Growth
- Exhibits8: Executive Summary - Data Table on Incremental Growth
- Exhibits9: Executive Summary - Chart on Company Market Positioning
- Exhibits10: Analysis of price sensitivity, lifecycle, customer purchase basket, adoption rates, and purchase criteria
- Exhibits11: Overview on criticality of inputs and factors of differentiation
- Exhibits12: Overview on factors of disruption
- Exhibits13: Impact of drivers and challenges in 2024 and 2029
- Exhibits14: Parent Market
- Exhibits15: Data Table on - Parent Market
- Exhibits16: Market characteristics analysis
- Exhibits17: Value chain analysis
- Exhibits18: Offerings of companies included in the market definition
- Exhibits19: Market segments
- Exhibits20: Chart on Global - Market size and forecast 2024-2029 ($ million)
- Exhibits21: Data Table on Global - Market size and forecast 2024-2029 ($ million)
- Exhibits22: Chart on Global Market: Year-over-year growth 2024-2029 (%)
- Exhibits23: Data Table on Global Market: Year-over-year growth 2024-2029 (%)
- Exhibits24: Historic Market Size - Data Table on Global Microbiomes Market 2019 - 2023 ($ million)
- Exhibits25: Historic Market Size - Product Segment 2019 - 2023 ($ million)
- Exhibits26: Historic Market Size - Application Segment 2019 - 2023 ($ million)
- Exhibits27: Historic Market Size - Geography Segment 2019 - 2023 ($ million)
- Exhibits28: Historic Market Size - Country Segment 2019 - 2023 ($ million)
- Exhibits29: Five forces analysis - Comparison between 2024 and 2029
- Exhibits30: Bargaining power of buyers - Impact of key factors 2024 and 2029
- Exhibits31: Bargaining power of suppliers - Impact of key factors in 2024 and 2029
- Exhibits32: Threat of new entrants - Impact of key factors in 2024 and 2029
- Exhibits33: Threat of substitutes - Impact of key factors in 2024 and 2029
- Exhibits34: Threat of rivalry - Impact of key factors in 2024 and 2029
- Exhibits35: Chart on Market condition - Five forces 2024 and 2029
- Exhibits36: Chart on Product - Market share 2024-2029 (%)
- Exhibits37: Data Table on Product - Market share 2024-2029 (%)
- Exhibits38: Chart on Comparison by Product
- Exhibits39: Data Table on Comparison by Product
- Exhibits40: Chart on Probiotics - Market size and forecast 2024-2029 ($ million)
- Exhibits41: Data Table on Probiotics - Market size and forecast 2024-2029 ($ million)
- Exhibits42: Chart on Probiotics - Year-over-year growth 2024-2029 (%)
- Exhibits43: Data Table on Probiotics - Year-over-year growth 2024-2029 (%)
- Exhibits44: Chart on Foods - Market size and forecast 2024-2029 ($ million)
- Exhibits45: Data Table on Foods - Market size and forecast 2024-2029 ($ million)
- Exhibits46: Chart on Foods - Year-over-year growth 2024-2029 (%)
- Exhibits47: Data Table on Foods - Year-over-year growth 2024-2029 (%)
- Exhibits48: Chart on Prebiotics - Market size and forecast 2024-2029 ($ million)
- Exhibits49: Data Table on Prebiotics - Market size and forecast 2024-2029 ($ million)
- Exhibits50: Chart on Prebiotics - Year-over-year growth 2024-2029 (%)
- Exhibits51: Data Table on Prebiotics - Year-over-year growth 2024-2029 (%)
- Exhibits52: Chart on Medical food - Market size and forecast 2024-2029 ($ million)
- Exhibits53: Data Table on Medical food - Market size and forecast 2024-2029 ($ million)
- Exhibits54: Chart on Medical food - Year-over-year growth 2024-2029 (%)
- Exhibits55: Data Table on Medical food - Year-over-year growth 2024-2029 (%)
- Exhibits56: Chart on Others - Market size and forecast 2024-2029 ($ million)
- Exhibits57: Data Table on Others - Market size and forecast 2024-2029 ($ million)
- Exhibits58: Chart on Others - Year-over-year growth 2024-2029 (%)
- Exhibits59: Data Table on Others - Year-over-year growth 2024-2029 (%)
- Exhibits60: Market opportunity by Product ($ million)
- Exhibits61: Data Table on Market opportunity by Product ($ million)
- Exhibits62: Chart on Application - Market share 2024-2029 (%)
- Exhibits63: Data Table on Application - Market share 2024-2029 (%)
- Exhibits64: Chart on Comparison by Application
- Exhibits65: Data Table on Comparison by Application
- Exhibits66: Chart on Therapeutics - Market size and forecast 2024-2029 ($ million)
- Exhibits67: Data Table on Therapeutics - Market size and forecast 2024-2029 ($ million)
- Exhibits68: Chart on Therapeutics - Year-over-year growth 2024-2029 (%)
- Exhibits69: Data Table on Therapeutics - Year-over-year growth 2024-2029 (%)
- Exhibits70: Chart on Diagnostics - Market size and forecast 2024-2029 ($ million)
- Exhibits71: Data Table on Diagnostics - Market size and forecast 2024-2029 ($ million)
- Exhibits72: Chart on Diagnostics - Year-over-year growth 2024-2029 (%)
- Exhibits73: Data Table on Diagnostics - Year-over-year growth 2024-2029 (%)
- Exhibits74: Market opportunity by Application ($ million)
- Exhibits75: Data Table on Market opportunity by Application ($ million)
- Exhibits76: Analysis of price sensitivity, lifecycle, customer purchase basket, adoption rates, and purchase criteria
- Exhibits77: Chart on Market share By Geographical Landscape 2024-2029 (%)
- Exhibits78: Data Table on Market share By Geographical Landscape 2024-2029 (%)
- Exhibits79: Chart on Geographic comparison
- Exhibits80: Data Table on Geographic comparison
- Exhibits81: Chart on North America - Market size and forecast 2024-2029 ($ million)
- Exhibits82: Data Table on North America - Market size and forecast 2024-2029 ($ million)
- Exhibits83: Chart on North America - Year-over-year growth 2024-2029 (%)
- Exhibits84: Data Table on North America - Year-over-year growth 2024-2029 (%)
- Exhibits85: Chart on Europe - Market size and forecast 2024-2029 ($ million)
- Exhibits86: Data Table on Europe - Market size and forecast 2024-2029 ($ million)
- Exhibits87: Chart on Europe - Year-over-year growth 2024-2029 (%)
- Exhibits88: Data Table on Europe - Year-over-year growth 2024-2029 (%)
- Exhibits89: Chart on Asia - Market size and forecast 2024-2029 ($ million)
- Exhibits90: Data Table on Asia - Market size and forecast 2024-2029 ($ million)
- Exhibits91: Chart on Asia - Year-over-year growth 2024-2029 (%)
- Exhibits92: Data Table on Asia - Year-over-year growth 2024-2029 (%)
- Exhibits93: Chart on Rest of World (ROW) - Market size and forecast 2024-2029 ($ million)
- Exhibits94: Data Table on Rest of World (ROW) - Market size and forecast 2024-2029 ($ million)
- Exhibits95: Chart on Rest of World (ROW) - Year-over-year growth 2024-2029 (%)
- Exhibits96: Data Table on Rest of World (ROW) - Year-over-year growth 2024-2029 (%)
- Exhibits97: Chart on US - Market size and forecast 2024-2029 ($ million)
- Exhibits98: Data Table on US - Market size and forecast 2024-2029 ($ million)
- Exhibits99: Chart on US - Year-over-year growth 2024-2029 (%)
- Exhibits100: Data Table on US - Year-over-year growth 2024-2029 (%)
- Exhibits101: Chart on Germany - Market size and forecast 2024-2029 ($ million)
- Exhibits102: Data Table on Germany - Market size and forecast 2024-2029 ($ million)
- Exhibits103: Chart on Germany - Year-over-year growth 2024-2029 (%)
- Exhibits104: Data Table on Germany - Year-over-year growth 2024-2029 (%)
- Exhibits105: Chart on France - Market size and forecast 2024-2029 ($ million)
- Exhibits106: Data Table on France - Market size and forecast 2024-2029 ($ million)
- Exhibits107: Chart on France - Year-over-year growth 2024-2029 (%)
- Exhibits108: Data Table on France - Year-over-year growth 2024-2029 (%)
- Exhibits109: Chart on UK - Market size and forecast 2024-2029 ($ million)
- Exhibits110: Data Table on UK - Market size and forecast 2024-2029 ($ million)
- Exhibits111: Chart on UK - Year-over-year growth 2024-2029 (%)
- Exhibits112: Data Table on UK - Year-over-year growth 2024-2029 (%)
- Exhibits113: Chart on Japan - Market size and forecast 2024-2029 ($ million)
- Exhibits114: Data Table on Japan - Market size and forecast 2024-2029 ($ million)
- Exhibits115: Chart on Japan - Year-over-year growth 2024-2029 (%)
- Exhibits116: Data Table on Japan - Year-over-year growth 2024-2029 (%)
- Exhibits117: Chart on Canada - Market size and forecast 2024-2029 ($ million)
- Exhibits118: Data Table on Canada - Market size and forecast 2024-2029 ($ million)
- Exhibits119: Chart on Canada - Year-over-year growth 2024-2029 (%)
- Exhibits120: Data Table on Canada - Year-over-year growth 2024-2029 (%)
- Exhibits121: Chart on China - Market size and forecast 2024-2029 ($ million)
- Exhibits122: Data Table on China - Market size and forecast 2024-2029 ($ million)
- Exhibits123: Chart on China - Year-over-year growth 2024-2029 (%)
- Exhibits124: Data Table on China - Year-over-year growth 2024-2029 (%)
- Exhibits125: Chart on India - Market size and forecast 2024-2029 ($ million)
- Exhibits126: Data Table on India - Market size and forecast 2024-2029 ($ million)
- Exhibits127: Chart on India - Year-over-year growth 2024-2029 (%)
- Exhibits128: Data Table on India - Year-over-year growth 2024-2029 (%)
- Exhibits129: Chart on South Korea - Market size and forecast 2024-2029 ($ million)
- Exhibits130: Data Table on South Korea - Market size and forecast 2024-2029 ($ million)
- Exhibits131: Chart on South Korea - Year-over-year growth 2024-2029 (%)
- Exhibits132: Data Table on South Korea - Year-over-year growth 2024-2029 (%)
- Exhibits133: Chart on Italy - Market size and forecast 2024-2029 ($ million)
- Exhibits134: Data Table on Italy - Market size and forecast 2024-2029 ($ million)
- Exhibits135: Chart on Italy - Year-over-year growth 2024-2029 (%)
- Exhibits136: Data Table on Italy - Year-over-year growth 2024-2029 (%)
- Exhibits137: Market opportunity By Geographical Landscape ($ million)
- Exhibits138: Data Tables on Market opportunity By Geographical Landscape ($ million)
- Exhibits139: Impact of drivers and challenges in 2024 and 2029
- Exhibits140: Overview on criticality of inputs and factors of differentiation
- Exhibits141: Overview on factors of disruption
- Exhibits142: Impact of key risks on business
- Exhibits143: Companies covered
- Exhibits144: Company ranking index
- Exhibits145: Matrix on companies position and classification
- Exhibits146: AOBiome LLC - Overview
- Exhibits147: AOBiome LLC - Product / Service
- Exhibits148: AOBiome LLC - Key offerings
- Exhibits149: SWOT
- Exhibits150: BiomX Inc. - Overview
- Exhibits151: BiomX Inc. - Product / Service
- Exhibits152: BiomX Inc. - Key offerings
- Exhibits153: SWOT
- Exhibits154: DuPont de Nemours Inc. - Overview
- Exhibits155: DuPont de Nemours Inc. - Business segments
- Exhibits156: DuPont de Nemours Inc. - Key news
- Exhibits157: DuPont de Nemours Inc. - Key offerings
- Exhibits158: DuPont de Nemours Inc. - Segment focus
- Exhibits159: SWOT
- Exhibits160: Eligo Bioscience - Overview
- Exhibits161: Eligo Bioscience - Product / Service
- Exhibits162: Eligo Bioscience - Key offerings
- Exhibits163: SWOT
- Exhibits164: ENTEROME SA - Overview
- Exhibits165: ENTEROME SA - Product / Service
- Exhibits166: ENTEROME SA - Key offerings
- Exhibits167: SWOT
- Exhibits168: ExeGi Pharma - Overview
- Exhibits169: ExeGi Pharma - Product / Service
- Exhibits170: ExeGi Pharma - Key offerings
- Exhibits171: SWOT
- Exhibits172: Ferring BV - Overview
- Exhibits173: Ferring BV - Product / Service
- Exhibits174: Ferring BV - Key news
- Exhibits175: Ferring BV - Key offerings
- Exhibits176: SWOT
- Exhibits177: MaaT Pharma - Overview
- Exhibits178: MaaT Pharma - Product / Service
- Exhibits179: MaaT Pharma - Key offerings
- Exhibits180: SWOT
- Exhibits181: OraSure Technologies Inc. - Overview
- Exhibits182: OraSure Technologies Inc. - Business segments
- Exhibits183: OraSure Technologies Inc. - Key news
- Exhibits184: OraSure Technologies Inc. - Key offerings
- Exhibits185: OraSure Technologies Inc. - Segment focus
- Exhibits186: SWOT
- Exhibits187: Osel Inc. - Overview
- Exhibits188: Osel Inc. - Product / Service
- Exhibits189: Osel Inc. - Key offerings
- Exhibits190: SWOT
- Exhibits191: PureTech Health Plc - Overview
- Exhibits192: PureTech Health Plc - Business segments
- Exhibits193: PureTech Health Plc - Key offerings
- Exhibits194: PureTech Health Plc - Segment focus
- Exhibits195: SWOT
- Exhibits196: Second Genome Therapeutics - Overview
- Exhibits197: Second Genome Therapeutics - Product / Service
- Exhibits198: Second Genome Therapeutics - Key offerings
- Exhibits199: SWOT
- Exhibits200: Seres Therapeutics Inc. - Overview
- Exhibits201: Seres Therapeutics Inc. - Product / Service
- Exhibits202: Seres Therapeutics Inc. - Key offerings
- Exhibits203: SWOT
- Exhibits204: Synlogic Inc. - Overview
- Exhibits205: Synlogic Inc. - Product / Service
- Exhibits206: Synlogic Inc. - Key offerings
- Exhibits207: SWOT
- Exhibits208: Theriva Biologics Inc. - Overview
- Exhibits209: Theriva Biologics Inc. - Product / Service
- Exhibits210: Theriva Biologics Inc. - Key offerings
- Exhibits211: SWOT
- Exhibits212: Inclusions checklist
- Exhibits213: Exclusions checklist
- Exhibits214: Currency conversion rates for US$
- Exhibits215: Research methodology
- Exhibits216: Information sources
- Exhibits217: Data validation
- Exhibits218: Validation techniques employed for market sizing
- Exhibits219: Data synthesis
- Exhibits220: 360 degree market analysis
- Exhibits221: List of abbreviations
Microbiomes Market 2025-2029
The microbiomes market is forecasted to grow by USD 824.3 mn during 2024-2029, accelerating at a CAGR of 18.3% during the forecast period. The report on the microbiomes market provides a holistic analysis, market size and forecast, trends, growth drivers, and challenges, as well as vendor analysis covering around 25 vendors.
The report offers an up-to-date analysis regarding the current market scenario, the latest trends and drivers, and the overall market environment. The market is driven by increasing prevalence of diseases, increasing initiatives and investments in microbiome research, and advances in microbiome discovery, therapeutics, and diagnostics.
| Market Scope | |
|---|---|
| Base Year | 2025 |
| End Year | 2029 |
| Series Year | 2025-2029 |
| Growth Momentum | Accelerate |
| YOY 2025 | 15.5% |
| CAGR | 18.3% |
| Incremental Value | $824.3 mn |
Technavio's microbiomes market is segmented as below:
By Product
- Probiotics
- Foods
- Prebiotics
- Medical food
- Others
By Application
- Therapeutics
- Diagnostics
By Geographical Landscape
- North America
- Europe
- Asia
- Rest of World (ROW)
This study identifies the significant number of collaborations for developing microbiome therapeutics as one of the prime reasons driving the microbiomes market growth during the next few years. Also, growing focus on developing biosensors and genetic circuits and developments in regulatory framework will lead to sizable demand in the market.
The report on the microbiomes market covers the following areas:
- Microbiomes Market sizing
- Microbiomes Market forecast
- Microbiomes Market industry analysis
The robust vendor analysis is designed to help clients improve their market position, and in line with this, this report provides a detailed analysis of several leading microbiomes market vendors that include AOBiome LLC, BiomX Inc., DuPont de Nemours Inc., Eligo Bioscience, ENTEROME SA, ExeGi Pharma, Ferring BV, MaaT Pharma, OraSure Technologies Inc., Osel Inc., Pendulum Therapeutics Inc., PureTech Health Plc, Qualigen Therapeutics Inc., Second Genome Therapeutics, Seres Therapeutics Inc., Synlogic Inc., Takeda Pharmaceutical Co. Ltd., Theriva Biologics Inc., Vedanta Biosciences Inc., and YSOPIA Bioscience. Also, the microbiomes market analysis report includes information on upcoming trends and challenges that will influence market growth. This is to help companies strategize and leverage all forthcoming growth opportunities.
The study was conducted using an objective combination of primary and secondary information including inputs from key participants in the industry. The report contains a comprehensive market and vendor landscape in addition to an analysis of the key vendors.
The publisher presents a detailed picture of the market by the way of study, synthesis, and summation of data from multiple sources by an analysis of key parameters such as profit, pricing, competition, and promotions. It presents various market facets by identifying the key industry influencers. The data presented is comprehensive, reliable, and a result of extensive primary and secondary research. The market research reports provide a complete competitive landscape and an in-depth vendor selection methodology and analysis using qualitative and quantitative research to forecast accurate market growth.
Table of Contents
1 Executive Summary
- 1.1 Market overview
- Executive Summary - Chart on Market Overview
- Executive Summary - Data Table on Market Overview
- Executive Summary - Chart on Global Market Characteristics
- Executive Summary - Chart on Market By Geographical Landscape
- Executive Summary - Chart on Market Segmentation by Product
- Executive Summary - Chart on Market Segmentation by Application
- Executive Summary - Chart on Incremental Growth
- Executive Summary - Data Table on Incremental Growth
- Executive Summary - Chart on Company Market Positioning
2 Technavio Analysis
- 2.1 Analysis of price sensitivity, lifecycle, customer purchase basket, adoption rates, and purchase criteria
- Analysis of price sensitivity, lifecycle, customer purchase basket, adoption rates, and purchase criteria
- 2.2 Criticality of inputs and Factors of differentiation
- Overview on criticality of inputs and factors of differentiation
- 2.3 Factors of disruption
- Overview on factors of disruption
- 2.4 Impact of drivers and challenges
- Impact of drivers and challenges in 2024 and 2029
3 Market Landscape
- 3.1 Market ecosystem
- Parent Market
- Data Table on - Parent Market
- 3.2 Market characteristics
- Market characteristics analysis
- 3.3 Value chain analysis
- Value chain analysis
4 Market Sizing
- 4.1 Market definition
- Offerings of companies included in the market definition
- 4.2 Market segment analysis
- Market segments
- 4.3 Market size 2024
- 4.4 Market outlook: Forecast for 2024-2029
- Chart on Global - Market size and forecast 2024-2029 ($ million)
- Data Table on Global - Market size and forecast 2024-2029 ($ million)
- Chart on Global Market: Year-over-year growth 2024-2029 (%)
- Data Table on Global Market: Year-over-year growth 2024-2029 (%)
5 Historic Market Size
- 5.1 Global Microbiomes Market 2019 - 2023
- Historic Market Size - Data Table on Global Microbiomes Market 2019 - 2023 ($ million)
- 5.2 Product segment analysis 2019 - 2023
- Historic Market Size - Product Segment 2019 - 2023 ($ million)
- 5.3 Application segment analysis 2019 - 2023
- Historic Market Size - Application Segment 2019 - 2023 ($ million)
- 5.4 Geography segment analysis 2019 - 2023
- Historic Market Size - Geography Segment 2019 - 2023 ($ million)
- 5.5 Country segment analysis 2019 - 2023
- Historic Market Size - Country Segment 2019 - 2023 ($ million)
6 Qualitative Analysis
- 6.1 The impact of AI in Global Microbiomes Market
7 Five Forces Analysis
- 7.1 Five forces summary
- Five forces analysis - Comparison between 2024 and 2029
- 7.2 Bargaining power of buyers
- Bargaining power of buyers - Impact of key factors 2024 and 2029
- 7.3 Bargaining power of suppliers
- Bargaining power of suppliers - Impact of key factors in 2024 and 2029
- 7.4 Threat of new entrants
- Threat of new entrants - Impact of key factors in 2024 and 2029
- 7.5 Threat of substitutes
- Threat of substitutes - Impact of key factors in 2024 and 2029
- 7.6 Threat of rivalry
- Threat of rivalry - Impact of key factors in 2024 and 2029
- 7.7 Market condition
- Chart on Market condition - Five forces 2024 and 2029
8 Market Segmentation by Product
- 8.1 Market segments
- Chart on Product - Market share 2024-2029 (%)
- Data Table on Product - Market share 2024-2029 (%)
- 8.2 Comparison by Product
- Chart on Comparison by Product
- Data Table on Comparison by Product
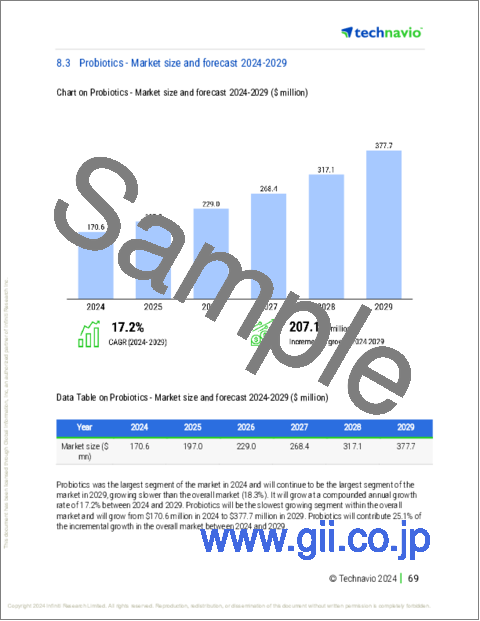
- 8.3 Probiotics - Market size and forecast 2024-2029
- Chart on Probiotics - Market size and forecast 2024-2029 ($ million)
- Data Table on Probiotics - Market size and forecast 2024-2029 ($ million)
- Chart on Probiotics - Year-over-year growth 2024-2029 (%)
- Data Table on Probiotics - Year-over-year growth 2024-2029 (%)
- 8.4 Foods - Market size and forecast 2024-2029
- Chart on Foods - Market size and forecast 2024-2029 ($ million)
- Data Table on Foods - Market size and forecast 2024-2029 ($ million)
- Chart on Foods - Year-over-year growth 2024-2029 (%)
- Data Table on Foods - Year-over-year growth 2024-2029 (%)
- 8.5 Prebiotics - Market size and forecast 2024-2029
- Chart on Prebiotics - Market size and forecast 2024-2029 ($ million)
- Data Table on Prebiotics - Market size and forecast 2024-2029 ($ million)
- Chart on Prebiotics - Year-over-year growth 2024-2029 (%)
- Data Table on Prebiotics - Year-over-year growth 2024-2029 (%)
- 8.6 Medical food - Market size and forecast 2024-2029
- Chart on Medical food - Market size and forecast 2024-2029 ($ million)
- Data Table on Medical food - Market size and forecast 2024-2029 ($ million)
- Chart on Medical food - Year-over-year growth 2024-2029 (%)
- Data Table on Medical food - Year-over-year growth 2024-2029 (%)
- 8.7 Others - Market size and forecast 2024-2029
- Chart on Others - Market size and forecast 2024-2029 ($ million)
- Data Table on Others - Market size and forecast 2024-2029 ($ million)
- Chart on Others - Year-over-year growth 2024-2029 (%)
- Data Table on Others - Year-over-year growth 2024-2029 (%)
- 8.8 Market opportunity by Product
- Market opportunity by Product ($ million)
- Data Table on Market opportunity by Product ($ million)
9 Market Segmentation by Application
- 9.1 Market segments
- Chart on Application - Market share 2024-2029 (%)
- Data Table on Application - Market share 2024-2029 (%)
- 9.2 Comparison by Application
- Chart on Comparison by Application
- Data Table on Comparison by Application
- 9.3 Therapeutics - Market size and forecast 2024-2029
- Chart on Therapeutics - Market size and forecast 2024-2029 ($ million)
- Data Table on Therapeutics - Market size and forecast 2024-2029 ($ million)
- Chart on Therapeutics - Year-over-year growth 2024-2029 (%)
- Data Table on Therapeutics - Year-over-year growth 2024-2029 (%)
- 9.4 Diagnostics - Market size and forecast 2024-2029
- Chart on Diagnostics - Market size and forecast 2024-2029 ($ million)
- Data Table on Diagnostics - Market size and forecast 2024-2029 ($ million)
- Chart on Diagnostics - Year-over-year growth 2024-2029 (%)
- Data Table on Diagnostics - Year-over-year growth 2024-2029 (%)
- 9.5 Market opportunity by Application
- Market opportunity by Application ($ million)
- Data Table on Market opportunity by Application ($ million)
10 Customer Landscape
- 10.1 Customer landscape overview
- Analysis of price sensitivity, lifecycle, customer purchase basket, adoption rates, and purchase criteria
11 Geographic Landscape
- 11.1 Geographic segmentation
- Chart on Market share By Geographical Landscape 2024-2029 (%)
- Data Table on Market share By Geographical Landscape 2024-2029 (%)
- 11.2 Geographic comparison
- Chart on Geographic comparison
- Data Table on Geographic comparison
- 11.3 North America - Market size and forecast 2024-2029
- Chart on North America - Market size and forecast 2024-2029 ($ million)
- Data Table on North America - Market size and forecast 2024-2029 ($ million)
- Chart on North America - Year-over-year growth 2024-2029 (%)
- Data Table on North America - Year-over-year growth 2024-2029 (%)
- 11.4 Europe - Market size and forecast 2024-2029
- Chart on Europe - Market size and forecast 2024-2029 ($ million)
- Data Table on Europe - Market size and forecast 2024-2029 ($ million)
- Chart on Europe - Year-over-year growth 2024-2029 (%)
- Data Table on Europe - Year-over-year growth 2024-2029 (%)
- 11.5 Asia - Market size and forecast 2024-2029
- Chart on Asia - Market size and forecast 2024-2029 ($ million)
- Data Table on Asia - Market size and forecast 2024-2029 ($ million)
- Chart on Asia - Year-over-year growth 2024-2029 (%)
- Data Table on Asia - Year-over-year growth 2024-2029 (%)
- 11.6 Rest of World (ROW) - Market size and forecast 2024-2029
- Chart on Rest of World (ROW) - Market size and forecast 2024-2029 ($ million)
- Data Table on Rest of World (ROW) - Market size and forecast 2024-2029 ($ million)
- Chart on Rest of World (ROW) - Year-over-year growth 2024-2029 (%)
- Data Table on Rest of World (ROW) - Year-over-year growth 2024-2029 (%)
- 11.7 US - Market size and forecast 2024-2029
- Chart on US - Market size and forecast 2024-2029 ($ million)
- Data Table on US - Market size and forecast 2024-2029 ($ million)
- Chart on US - Year-over-year growth 2024-2029 (%)
- Data Table on US - Year-over-year growth 2024-2029 (%)
- 11.8 Germany - Market size and forecast 2024-2029
- Chart on Germany - Market size and forecast 2024-2029 ($ million)
- Data Table on Germany - Market size and forecast 2024-2029 ($ million)
- Chart on Germany - Year-over-year growth 2024-2029 (%)
- Data Table on Germany - Year-over-year growth 2024-2029 (%)
- 11.9 France - Market size and forecast 2024-2029
- Chart on France - Market size and forecast 2024-2029 ($ million)
- Data Table on France - Market size and forecast 2024-2029 ($ million)
- Chart on France - Year-over-year growth 2024-2029 (%)
- Data Table on France - Year-over-year growth 2024-2029 (%)
- 11.10 UK - Market size and forecast 2024-2029
- Chart on UK - Market size and forecast 2024-2029 ($ million)
- Data Table on UK - Market size and forecast 2024-2029 ($ million)
- Chart on UK - Year-over-year growth 2024-2029 (%)
- Data Table on UK - Year-over-year growth 2024-2029 (%)
- 11.11 Japan - Market size and forecast 2024-2029
- Chart on Japan - Market size and forecast 2024-2029 ($ million)
- Data Table on Japan - Market size and forecast 2024-2029 ($ million)
- Chart on Japan - Year-over-year growth 2024-2029 (%)
- Data Table on Japan - Year-over-year growth 2024-2029 (%)
- 11.12 Canada - Market size and forecast 2024-2029
- Chart on Canada - Market size and forecast 2024-2029 ($ million)
- Data Table on Canada - Market size and forecast 2024-2029 ($ million)
- Chart on Canada - Year-over-year growth 2024-2029 (%)
- Data Table on Canada - Year-over-year growth 2024-2029 (%)
- 11.13 China - Market size and forecast 2024-2029
- Chart on China - Market size and forecast 2024-2029 ($ million)
- Data Table on China - Market size and forecast 2024-2029 ($ million)
- Chart on China - Year-over-year growth 2024-2029 (%)
- Data Table on China - Year-over-year growth 2024-2029 (%)
- 11.14 India - Market size and forecast 2024-2029
- Chart on India - Market size and forecast 2024-2029 ($ million)
- Data Table on India - Market size and forecast 2024-2029 ($ million)
- Chart on India - Year-over-year growth 2024-2029 (%)
- Data Table on India - Year-over-year growth 2024-2029 (%)
- 11.15 South Korea - Market size and forecast 2024-2029
- Chart on South Korea - Market size and forecast 2024-2029 ($ million)
- Data Table on South Korea - Market size and forecast 2024-2029 ($ million)
- Chart on South Korea - Year-over-year growth 2024-2029 (%)
- Data Table on South Korea - Year-over-year growth 2024-2029 (%)
- 11.16 Italy - Market size and forecast 2024-2029
- Chart on Italy - Market size and forecast 2024-2029 ($ million)
- Data Table on Italy - Market size and forecast 2024-2029 ($ million)
- Chart on Italy - Year-over-year growth 2024-2029 (%)
- Data Table on Italy - Year-over-year growth 2024-2029 (%)
- 11.17 Market opportunity By Geographical Landscape
- Market opportunity By Geographical Landscape ($ million)
- Data Tables on Market opportunity By Geographical Landscape ($ million)
12 Drivers, Challenges, and Opportunity/Restraints
- 12.1 Market drivers
- 12.2 Market challenges
- 12.3 Impact of drivers and challenges
- Impact of drivers and challenges in 2024 and 2029
- 12.4 Market opportunities/restraints
13 Competitive Landscape
- 13.1 Overview
- 13.2 Competitive Landscape
- Overview on criticality of inputs and factors of differentiation
- 13.3 Landscape disruption
- Overview on factors of disruption
- 13.4 Industry risks
- Impact of key risks on business
14 Competitive Analysis
- 14.1 Companies profiled
- Companies covered
- 14.2 Company ranking index
- Company ranking index
- 14.3 Market positioning of companies
- Matrix on companies position and classification
- 14.4 AOBiome LLC
- AOBiome LLC - Overview
- AOBiome LLC - Product / Service
- AOBiome LLC - Key offerings
- SWOT
- 14.5 BiomX Inc.
- BiomX Inc. - Overview
- BiomX Inc. - Product / Service
- BiomX Inc. - Key offerings
- SWOT
- 14.6 DuPont de Nemours Inc.
- DuPont de Nemours Inc. - Overview
- DuPont de Nemours Inc. - Business segments
- DuPont de Nemours Inc. - Key news
- DuPont de Nemours Inc. - Key offerings
- DuPont de Nemours Inc. - Segment focus
- SWOT
- 14.7 Eligo Bioscience
- Eligo Bioscience - Overview
- Eligo Bioscience - Product / Service
- Eligo Bioscience - Key offerings
- SWOT
- 14.8 ENTEROME SA
- ENTEROME SA - Overview
- ENTEROME SA - Product / Service
- ENTEROME SA - Key offerings
- SWOT
- 14.9 ExeGi Pharma
- ExeGi Pharma - Overview
- ExeGi Pharma - Product / Service
- ExeGi Pharma - Key offerings
- SWOT
- 14.10 Ferring BV
- Ferring BV - Overview
- Ferring BV - Product / Service
- Ferring BV - Key news
- Ferring BV - Key offerings
- SWOT
- 14.11 MaaT Pharma
- MaaT Pharma - Overview
- MaaT Pharma - Product / Service
- MaaT Pharma - Key offerings
- SWOT
- 14.12 OraSure Technologies Inc.
- OraSure Technologies Inc. - Overview
- OraSure Technologies Inc. - Business segments
- OraSure Technologies Inc. - Key news
- OraSure Technologies Inc. - Key offerings
- OraSure Technologies Inc. - Segment focus
- SWOT
- 14.13 Osel Inc.
- Osel Inc. - Overview
- Osel Inc. - Product / Service
- Osel Inc. - Key offerings
- SWOT
- 14.14 PureTech Health Plc
- PureTech Health Plc - Overview
- PureTech Health Plc - Business segments
- PureTech Health Plc - Key offerings
- PureTech Health Plc - Segment focus
- SWOT
- 14.15 Second Genome Therapeutics
- Second Genome Therapeutics - Overview
- Second Genome Therapeutics - Product / Service
- Second Genome Therapeutics - Key offerings
- SWOT
- 14.16 Seres Therapeutics Inc.
- Seres Therapeutics Inc. - Overview
- Seres Therapeutics Inc. - Product / Service
- Seres Therapeutics Inc. - Key offerings
- SWOT
- 14.17 Synlogic Inc.
- Synlogic Inc. - Overview
- Synlogic Inc. - Product / Service
- Synlogic Inc. - Key offerings
- SWOT
- 14.18 Theriva Biologics Inc.
- Theriva Biologics Inc. - Overview
- Theriva Biologics Inc. - Product / Service
- Theriva Biologics Inc. - Key offerings
- SWOT
15 Appendix
- 15.1 Scope of the report
- 15.2 Inclusions and exclusions checklist
- Inclusions checklist
- Exclusions checklist
- 15.3 Currency conversion rates for US$
- Currency conversion rates for US$
- 15.4 Research methodology
- Research methodology
- 15.5 Data procurement
- Information sources
- 15.6 Data validation
- Data validation
- 15.7 Validation techniques employed for market sizing
- Validation techniques employed for market sizing
- 15.8 Data synthesis
- Data synthesis
- 15.9 360 degree market analysis
- 360 degree market analysis
- 15.10 List of abbreviations
- List of abbreviations
- o Strong financial performance

