|
|
市場調査レポート
商品コード
1642764
SUV(スポーツユーティリティビークル)市場レポート:タイプ別、燃料タイプ別、乗車定員別、地域別、2025年~2033年Sports Utility Vehicle Market Report by Type (SUV-C, SUV-D, SUV-E, SUV-F), Fuel Type (Diesel, Petrol, Electric, and Others), Seating Capacity (5-Seater, 7-Seater, 8-Seater and Above), and Region 2025-2033 |
||||||

|
|||||||
カスタマイズ可能
|
|||||||


| SUV(スポーツユーティリティビークル)市場レポート:タイプ別、燃料タイプ別、乗車定員別、地域別、2025年~2033年 |
|
出版日: 2025年01月18日
発行: IMARC
ページ情報: 英文 130 Pages
納期: 2~3営業日
|

全表示
- 概要
- 図表
- 目次
SUV(スポーツユーティリティビークル)の世界市場規模は2024年に8,634億米ドルに達しました。今後、IMARC Groupは、2033年には1兆2,830億米ドルに達し、2025~2033年の成長率(CAGR)は4.28%になると予測しています。自動車産業の著しい成長、広範な研究開発(R&D)活動、急速な技術進歩が市場を牽引する主な要因です。
SUV(スポーツユーティリティビークル)(SUV)は、荷物運搬能力と乗員搬送能力を兼ね備えた乗用車の一種です。SUVは、エンジン・コンパートメント、ほぼ正方形の断面、荷室と客室が一体化した設計となっています。SUVは数人の乗員を乗せることができるため、長距離ドライブに理想的であり、険しい地形や課題にも対応できるよう設計されているため、オフロード走行にも適しています。SUVは、機能性、パワー、性能、荷室、機能性、豪華さ、安全性、多用途性を高めています。従来の自動車と比較して、SUVは車高が高く、ホイールが大きく、最低地上高が高いため、悪路や凸凹道を走るのに適しています。
SUV(スポーツユーティリティビークル)の市場動向:
世界の自動車産業の著しい成長は、市場成長を牽引する重要な要因のひとつです。これに伴い、自動車に求められる性能と多用途性への要求が高まっていることに加え、贅沢なパーソナル・モビリティへのニーズが、もう一つの成長促進要因として作用しています。さらに、広々とした室内空間、オフロード性能、高い車高により、従来のセダンや他の自動車よりもSUVが広く採用されていることも、市場成長を後押ししています。これとは別に、自動車メーカーは、低排出ガス、燃費の向上、運用コストの低減を理由に、電気自動車やハイブリッドSUVに投資しており、これが市場成長を後押ししています。さらに、SUVとタッチスクリーン・ディスプレイ、ワイヤレス充電、スマートフォンなどの高度なコネクティビティやインフォテインメント・システムとの統合が、市場成長に弾みをつけています。さらに、自動車メーカーはSUVの軽量化のためにアルミニウムやカーボンファイバーなどの軽量マテリアルを多用し、燃費やハンドリングを向上させ、より効率的で運転しやすくしており、これが市場成長にプラスの影響を与えています。このほか、プレミアム機能、高度な安全機能、広い室内空間、先進技術、オフロード性能など、高い快適性と利便性を提供する高級SUVに対する需要の高まりが、市場成長を後押ししています。その他、セダンからSUVへの消費者の嗜好の変化、消費者の支出能力の上昇、環境に優しい自動車への需要の高まり、人工知能(AI)、ハンズフリー接続、全地球測位システム(GPS)との自動車の統合を含む継続的な技術革新、自動車メーカーがより低燃費で環境に優しい自動車を開発することを奨励する様々な政府イニシアチブの実施などが市場成長を促進すると予測されます。
本レポートで扱う主な質問
- 世界のSUV(スポーツユーティリティビークル)の市場はこれまでどのように推移してきたか?
- 世界のSUV(スポーツユーティリティビークル)の市場における促進要因、抑制要因、機会は何か?
- 促進要因、抑制要因、機会が世界のSUV(スポーツユーティリティビークル)の市場に与える影響は?
- 主要な地域市場とは?
- 最も魅力的なSUV(スポーツユーティリティビークル)の市場はどの国か?
- タイプ別の市場内訳は?
- SUV(スポーツユーティリティビークル)の市場で最も魅力的なタイプは?
- 燃料タイプ別の市場内訳は?
- SUV(スポーツユーティリティビークル)の市場で最も魅力的な燃料タイプは?
- 乗車定員別の市場内訳は?
- SUV(スポーツユーティリティビークル)の市場で最も魅力的な乗車定員は?
- 世界のSUV(スポーツユーティリティビークル)の市場の競合構造は?
- 世界のSUV(スポーツユーティリティビークル)の市場における主要プレイヤー/企業は?
目次
第1章 序文
第2章 調査範囲と調査手法
- 調査の目的
- ステークホルダー
- データソース
- 一次情報
- 二次情報
- 市場推定
- ボトムアップアプローチ
- トップダウンアプローチ
- 調査手法
第3章 エグゼクティブサマリー
第4章 イントロダクション
- 概要
- 主要業界動向
第5章 世界のSUV(スポーツユーティリティビークル)市場
- 市場概要
- 市場実績
- COVID-19の影響
- 市場予測
第6章 市場内訳:タイプ別
- SUV-C
- 市場動向
- 市場予測
- SUV-D
- 市場動向
- 市場予測
- SUV-E
- 市場動向
- 市場予測
- SUV-F
- 市場動向
- 市場予測
第7章 市場内訳:燃料タイプ別
- ディーゼル
- 市場動向
- 市場予測
- ガソリン
- 市場動向
- 市場予測
- 電気
- 市場動向
- 市場予測
- その他
- 市場動向
- 市場予測
第8章 市場内訳:乗車定員別
- 5人乗り
- 市場動向
- 市場予測
- 7人乗り
- 市場動向
- 市場予測
- 8人乗り以上
- 市場動向
- 市場予測
第9章 市場内訳:地域別
- 北米
- 米国
- カナダ
- アジア太平洋地域
- 中国
- 日本
- インド
- 韓国
- オーストラリア
- インドネシア
- その他
- 欧州
- ドイツ
- フランス
- 英国
- イタリア
- スペイン
- ロシア
- その他
- ラテンアメリカ
- ブラジル
- メキシコ
- その他
- 中東・アフリカ
- 市場動向
- 市場内訳:国別
- 市場予測
第10章 促進要因・抑制要因・機会
- 概要
- 促進要因
- 抑制要因
- 機会
第11章 バリューチェーン分析
第12章 ポーターのファイブフォース分析
- 概要
- 買い手の交渉力
- 供給企業の交渉力
- 競合の程度
- 新規参入業者の脅威
- 代替品の脅威
第13章 価格分析
第14章 競合情勢
- 市場構造
- 主要企業
- 主要企業のプロファイル
- Bayerische Motoren Werke AG
- Ford Motor Company
- General Motors Company
- Honda Motor Co. Ltd.
- Hyundai Motor Company
- Mahindra & Mahindra Limited
- Maruti Suzuki India Limited(Suzuki Motor Corporation)
- Mitsubishi Motors Corporation
- Nissan Motor Co. Ltd.
- Toyota Motor Corporation
- Volkswagen AG
List of Figures
- Figure 1: Global: Sports Utility Vehicle Market: Major Drivers and Challenges
- Figure 2: Global: Sports Utility Vehicle Market: Sales Value (in Billion USD), 2019-2024
- Figure 3: Global: Sports Utility Vehicle Market Forecast: Sales Value (in Billion USD), 2025-2033
- Figure 4: Global: Sports Utility Vehicle Market: Breakup by Type (in %), 2024
- Figure 5: Global: Sports Utility Vehicle Market: Breakup by Fuel Type (in %), 2024
- Figure 6: Global: Sports Utility Vehicle Market: Breakup by Seating Capacity (in %), 2024
- Figure 7: Global: Sports Utility Vehicle Market: Breakup by Region (in %), 2024
- Figure 8: Global: Sports Utility Vehicle (SUV-C) Market: Sales Value (in Million USD), 2019 & 2024
- Figure 9: Global: Sports Utility Vehicle (SUV-C) Market Forecast: Sales Value (in Million USD), 2025-2033
- Figure 10: Global: Sports Utility Vehicle (SUV-D) Market: Sales Value (in Million USD), 2019 & 2024
- Figure 11: Global: Sports Utility Vehicle (SUV-D) Market Forecast: Sales Value (in Million USD), 2025-2033
- Figure 12: Global: Sports Utility Vehicle (SUV-E) Market: Sales Value (in Million USD), 2019 & 2024
- Figure 13: Global: Sports Utility Vehicle (SUV-E) Market Forecast: Sales Value (in Million USD), 2025-2033
- Figure 14: Global: Sports Utility Vehicle (SUV-F) Market: Sales Value (in Million USD), 2019 & 2024
- Figure 15: Global: Sports Utility Vehicle (SUV-F) Market Forecast: Sales Value (in Million USD), 2025-2033
- Figure 16: Global: Sports Utility Vehicle (Diesel) Market: Sales Value (in Million USD), 2019 & 2024
- Figure 17: Global: Sports Utility Vehicle (Diesel) Market Forecast: Sales Value (in Million USD), 2025-2033
- Figure 18: Global: Sports Utility Vehicle (Petrol) Market: Sales Value (in Million USD), 2019 & 2024
- Figure 19: Global: Sports Utility Vehicle (Petrol) Market Forecast: Sales Value (in Million USD), 2025-2033
- Figure 20: Global: Sports Utility Vehicle (Electric) Market: Sales Value (in Million USD), 2019 & 2024
- Figure 21: Global: Sports Utility Vehicle (Electric) Market Forecast: Sales Value (in Million USD), 2025-2033
- Figure 22: Global: Sports Utility Vehicle (Other Fuel Types) Market: Sales Value (in Million USD), 2019 & 2024
- Figure 23: Global: Sports Utility Vehicle (Other Fuel Types) Market Forecast: Sales Value (in Million USD), 2025-2033
- Figure 24: Global: Sports Utility Vehicle (5-Seater) Market: Sales Value (in Million USD), 2019 & 2024
- Figure 25: Global: Sports Utility Vehicle (5-Seater) Market Forecast: Sales Value (in Million USD), 2025-2033
- Figure 26: Global: Sports Utility Vehicle (7-Seater) Market: Sales Value (in Million USD), 2019 & 2024
- Figure 27: Global: Sports Utility Vehicle (7-Seater) Market Forecast: Sales Value (in Million USD), 2025-2033
- Figure 28: Global: Sports Utility Vehicle (8-Seater and Above) Market: Sales Value (in Million USD), 2019 & 2024
- Figure 29: Global: Sports Utility Vehicle (8-Seater and Above) Market Forecast: Sales Value (in Million USD), 2025-2033
- Figure 30: North America: Sports Utility Vehicle Market: Sales Value (in Million USD), 2019 & 2024
- Figure 31: North America: Sports Utility Vehicle Market Forecast: Sales Value (in Million USD), 2025-2033
- Figure 32: United States: Sports Utility Vehicle Market: Sales Value (in Million USD), 2019 & 2024
- Figure 33: United States: Sports Utility Vehicle Market Forecast: Sales Value (in Million USD), 2025-2033
- Figure 34: Canada: Sports Utility Vehicle Market: Sales Value (in Million USD), 2019 & 2024
- Figure 35: Canada: Sports Utility Vehicle Market Forecast: Sales Value (in Million USD), 2025-2033
- Figure 36: Asia-Pacific: Sports Utility Vehicle Market: Sales Value (in Million USD), 2019 & 2024
- Figure 37: Asia-Pacific: Sports Utility Vehicle Market Forecast: Sales Value (in Million USD), 2025-2033
- Figure 38: China: Sports Utility Vehicle Market: Sales Value (in Million USD), 2019 & 2024
- Figure 39: China: Sports Utility Vehicle Market Forecast: Sales Value (in Million USD), 2025-2033
- Figure 40: Japan: Sports Utility Vehicle Market: Sales Value (in Million USD), 2019 & 2024
- Figure 41: Japan: Sports Utility Vehicle Market Forecast: Sales Value (in Million USD), 2025-2033
- Figure 42: India: Sports Utility Vehicle Market: Sales Value (in Million USD), 2019 & 2024
- Figure 43: India: Sports Utility Vehicle Market Forecast: Sales Value (in Million USD), 2025-2033
- Figure 44: South Korea: Sports Utility Vehicle Market: Sales Value (in Million USD), 2019 & 2024
- Figure 45: South Korea: Sports Utility Vehicle Market Forecast: Sales Value (in Million USD), 2025-2033
- Figure 46: Australia: Sports Utility Vehicle Market: Sales Value (in Million USD), 2019 & 2024
- Figure 47: Australia: Sports Utility Vehicle Market Forecast: Sales Value (in Million USD), 2025-2033
- Figure 48: Indonesia: Sports Utility Vehicle Market: Sales Value (in Million USD), 2019 & 2024
- Figure 49: Indonesia: Sports Utility Vehicle Market Forecast: Sales Value (in Million USD), 2025-2033
- Figure 50: Others: Sports Utility Vehicle Market: Sales Value (in Million USD), 2019 & 2024
- Figure 51: Others: Sports Utility Vehicle Market Forecast: Sales Value (in Million USD), 2025-2033
- Figure 52: Europe: Sports Utility Vehicle Market: Sales Value (in Million USD), 2019 & 2024
- Figure 53: Europe: Sports Utility Vehicle Market Forecast: Sales Value (in Million USD), 2025-2033
- Figure 54: Germany: Sports Utility Vehicle Market: Sales Value (in Million USD), 2019 & 2024
- Figure 55: Germany: Sports Utility Vehicle Market Forecast: Sales Value (in Million USD), 2025-2033
- Figure 56: France: Sports Utility Vehicle Market: Sales Value (in Million USD), 2019 & 2024
- Figure 57: France: Sports Utility Vehicle Market Forecast: Sales Value (in Million USD), 2025-2033
- Figure 58: United Kingdom: Sports Utility Vehicle Market: Sales Value (in Million USD), 2019 & 2024
- Figure 59: United Kingdom: Sports Utility Vehicle Market Forecast: Sales Value (in Million USD), 2025-2033
- Figure 60: Italy: Sports Utility Vehicle Market: Sales Value (in Million USD), 2019 & 2024
- Figure 61: Italy: Sports Utility Vehicle Market Forecast: Sales Value (in Million USD), 2025-2033
- Figure 62: Spain: Sports Utility Vehicle Market: Sales Value (in Million USD), 2019 & 2024
- Figure 63: Spain: Sports Utility Vehicle Market Forecast: Sales Value (in Million USD), 2025-2033
- Figure 64: Russia: Sports Utility Vehicle Market: Sales Value (in Million USD), 2019 & 2024
- Figure 65: Russia: Sports Utility Vehicle Market Forecast: Sales Value (in Million USD), 2025-2033
- Figure 66: Others: Sports Utility Vehicle Market: Sales Value (in Million USD), 2019 & 2024
- Figure 67: Others: Sports Utility Vehicle Market Forecast: Sales Value (in Million USD), 2025-2033
- Figure 68: Latin America: Sports Utility Vehicle Market: Sales Value (in Million USD), 2019 & 2024
- Figure 69: Latin America: Sports Utility Vehicle Market Forecast: Sales Value (in Million USD), 2025-2033
- Figure 70: Brazil: Sports Utility Vehicle Market: Sales Value (in Million USD), 2019 & 2024
- Figure 71: Brazil: Sports Utility Vehicle Market Forecast: Sales Value (in Million USD), 2025-2033
- Figure 72: Mexico: Sports Utility Vehicle Market: Sales Value (in Million USD), 2019 & 2024
- Figure 73: Mexico: Sports Utility Vehicle Market Forecast: Sales Value (in Million USD), 2025-2033
- Figure 74: Others: Sports Utility Vehicle Market: Sales Value (in Million USD), 2019 & 2024
- Figure 75: Others: Sports Utility Vehicle Market Forecast: Sales Value (in Million USD), 2025-2033
- Figure 76: Middle East and Africa: Sports Utility Vehicle Market: Sales Value (in Million USD), 2019 & 2024
- Figure 77: Middle East and Africa: Sports Utility Vehicle Market: Breakup by Country (in %), 2024
- Figure 78: Middle East and Africa: Sports Utility Vehicle Market Forecast: Sales Value (in Million USD), 2025-2033
- Figure 79: Global: Sports Utility Vehicle Industry: Drivers, Restraints, and Opportunities
- Figure 80: Global: Sports Utility Vehicle Industry: Value Chain Analysis
- Figure 81: Global: Sports Utility Vehicle Industry: Porter's Five Forces Analysis
List of Tables
- Table 1: Global: Sports Utility Vehicle Market: Key Industry Highlights, 2024 & 2033
- Table 2: Global: Sports Utility Vehicle Market Forecast: Breakup by Type (in Million USD), 2025-2033
- Table 3: Global: Sports Utility Vehicle Market Forecast: Breakup by Fuel Type (in Million USD), 2025-2033
- Table 4: Global: Sports Utility Vehicle Market Forecast: Breakup by Seating Capacity (in Million USD), 2025-2033
- Table 5: Global: Sports Utility Vehicle Market Forecast: Breakup by Region (in Million USD), 2025-2033
- Table 6: Global: Sports Utility Vehicle Market: Competitive Structure
- Table 7: Global: Sports Utility Vehicle Market: Key Players
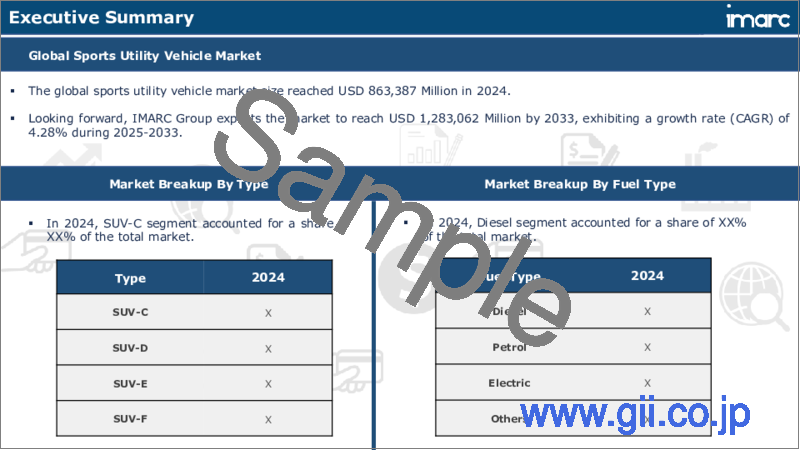
The global sports utility vehicle market size reached USD 863.4 Billion in 2024. Looking forward, IMARC Group expects the market to reach USD 1,283.0 Billion by 2033, exhibiting a growth rate (CAGR) of 4.28% during 2025-2033. Significant growth in the automotive industry, extensive research and development (R&D) activities, and rapid technological advancements represent some of the key factors driving the market.
The sports utility vehicle (SUV) is a kind of passenger vehicle that combines load-hauling and passenger-carrying abilities. They are designed with an engine compartment, an approximately square cross-section, and a combined cargo and passenger compartment. They are ideal for long road trips as they can accommodate several passengers and off-roading as they are built to handle rugged terrain and challenging conditions. SUVs offer enhanced capabilities, power, performance, cargo room, functionality, luxury, safety, and versatility. As compared to traditional cars, SUVs have a higher ride height, larger wheels, and more ground clearance, which makes them better suited for navigating rough terrain and uneven roads.
Sports Utility Vehicle Market Trends:
Significant growth in the automotive industry across the globe is one of the key factors driving the market growth. In line with this, the increasing demand for performance and versatility in automobiles, along with the need for luxuriant personal mobility, is acting as another growth-inducing factor. Moreover, the widespread adoption of SUVs over traditional sedans and other vehicles due to their spacious interiors, off-road capabilities, and higher ride height is favoring the market growth. Apart from this, the automakers are investing in electric and hybrid SUVs due to their lower emissions, improved fuel efficiency, and lower operating costs, which in turn are propelling the market growth. Additionally, the integration of SUVs with advanced connectivity and infotainment systems, including touchscreen displays, wireless charging, and smartphones, is providing an impetus to the market growth. Furthermore, automakers are extensively using lightweight materials, such as aluminum and carbon fiber, to reduce the weight of SUVs, which improves fuel efficiency and handling, making them more efficient and easier to drive, which in turn is positively influencing the market growth. Besides this, the rising demand for luxury SUVs that offer a high level of comfort and convenience, with premium features, advanced safety features, spacious interiors, advanced technology, and off-road capabilities, is driving the market growth. Other factors, including shifting consumer preference from sedans to SUVs, rising expenditure capacities of consumers, growing demand for eco-friendly vehicles, continual technological innovations, including the integration of vehicles with artificial intelligence (AI), hands-free connectivity, and global positioning systems (GPS), and the implementation of various government initiatives to encourage automakers to develop more fuel-efficient and eco-friendly vehicles are anticipated to drive the market growth.
Key Market Segmentation:
Type Insights:
- SUV-C
- SUV-D
- SUV-E
- SUV-F
Fuel Type Insights:
- Diesel
- Petrol
- Electric
- Others
Seating Capacity Insights:
- 5-Seater
- 7-Seater
- 8-Seater and Above
Regional Insights:
- North America
- United States
- Canada
- Europe
- Germany
- France
- United Kingdom
- Italy
- Spain
- Russia
- Others
- Asia Pacific
- China
- Japan
- India
- South Korea
- Australia
- Indonesia
- Others
- Latin America
- Brazil
- Mexico
- Others
- Middle East and Africa
- The report has also provided a comprehensive analysis of all the major regional markets, which include North America (the United States and Canada); Europe (Germany, France, the United Kingdom, Italy, Spain, Russia and others); Asia Pacific (China, Japan, India, South Korea, Australia, Indonesia, and others); Latin America (Brazil, Mexico, and others); and the Middle East and Africa. According to the report, North America was the largest market for sports utility vehicle. Some of the factors driving the North America sports utility vehicle market included the significant growth in the automotive industry, the implementation of various government initiatives, and extensive research and development (R&D) activities.
Competitive Landscape:
- The report has also provided a comprehensive analysis of the competitive landscape in the global sports utility vehicle market. Detailed profiles of all major companies have also been provided. Some of the companies covered include Bayerische Motoren Werke AG, Ford Motor Company, General Motors Company, Honda Motor Co. Ltd., Hyundai Motor Company, Mahindra & Mahindra Limited, Maruti Suzuki India Limited (Suzuki Motor Corporation), Mitsubishi Motors Corporation, Nissan Motor Co. Ltd., Toyota Motor Corporation, Volkswagen AG, etc. Kindly note that this only represents a partial list of companies, and the complete list has been provided in the report.
Key Questions Answered in This Report:
- How has the global sports utility vehicle market performed so far, and how will it perform in the coming years?
- What are the drivers, restraints, and opportunities in the global sports utility vehicle market?
- What is the impact of each driver, restraint, and opportunity on the global sports utility vehicle market?
- What are the key regional markets?
- Which countries represent the most attractive sports utility vehicle market?
- What is the breakup of the market based on the type?
- Which is the most attractive type in the sports utility vehicle market?
- What is the breakup of the market based on the fuel type?
- Which is the most attractive fuel type in the sports utility vehicle market?
- What is the breakup of the market based on seating capacity?
- Which is the most attractive seating capacity in the sports utility vehicle market?
- What is the competitive structure of the global sports utility vehicle market?
- Who are the key players/companies in the global sports utility vehicle market?
Table of Contents
1 Preface
2 Scope and Methodology
- 2.1 Objectives of the Study
- 2.2 Stakeholders
- 2.3 Data Sources
- 2.3.1 Primary Sources
- 2.3.2 Secondary Sources
- 2.4 Market Estimation
- 2.4.1 Bottom-Up Approach
- 2.4.2 Top-Down Approach
- 2.5 Forecasting Methodology
3 Executive Summary
4 Introduction
- 4.1 Overview
- 4.2 Key Industry Trends
5 Global Sports Utility Vehicle Market
- 5.1 Market Overview
- 5.2 Market Performance
- 5.3 Impact of COVID-19
- 5.4 Market Forecast
6 Market Breakup by Type
- 6.1 SUV-C
- 6.1.1 Market Trends
- 6.1.2 Market Forecast
- 6.2 SUV-D
- 6.2.1 Market Trends
- 6.2.2 Market Forecast
- 6.3 SUV-E
- 6.3.1 Market Trends
- 6.3.2 Market Forecast
- 6.4 SUV-F
- 6.4.1 Market Trends
- 6.4.2 Market Forecast
7 Market Breakup by Fuel Type
- 7.1 Diesel
- 7.1.1 Market Trends
- 7.1.2 Market Forecast
- 7.2 Petrol
- 7.2.1 Market Trends
- 7.2.2 Market Forecast
- 7.3 Electric
- 7.3.1 Market Trends
- 7.3.2 Market Forecast
- 7.4 Others
- 7.4.1 Market Trends
- 7.4.2 Market Forecast
8 Market Breakup by Seating Capacity
- 8.1 5-Seater
- 8.1.1 Market Trends
- 8.1.2 Market Forecast
- 8.2 7-Seater
- 8.2.1 Market Trends
- 8.2.2 Market Forecast
- 8.3 8-Seater and Above
- 8.3.1 Market Trends
- 8.3.2 Market Forecast
9 Market Breakup by Region
- 9.1 North America
- 9.1.1 United States
- 9.1.1.1 Market Trends
- 9.1.1.2 Market Forecast
- 9.1.2 Canada
- 9.1.2.1 Market Trends
- 9.1.2.2 Market Forecast
- 9.1.1 United States
- 9.2 Asia-Pacific
- 9.2.1 China
- 9.2.1.1 Market Trends
- 9.2.1.2 Market Forecast
- 9.2.2 Japan
- 9.2.2.1 Market Trends
- 9.2.2.2 Market Forecast
- 9.2.3 India
- 9.2.3.1 Market Trends
- 9.2.3.2 Market Forecast
- 9.2.4 South Korea
- 9.2.4.1 Market Trends
- 9.2.4.2 Market Forecast
- 9.2.5 Australia
- 9.2.5.1 Market Trends
- 9.2.5.2 Market Forecast
- 9.2.6 Indonesia
- 9.2.6.1 Market Trends
- 9.2.6.2 Market Forecast
- 9.2.7 Others
- 9.2.7.1 Market Trends
- 9.2.7.2 Market Forecast
- 9.2.1 China
- 9.3 Europe
- 9.3.1 Germany
- 9.3.1.1 Market Trends
- 9.3.1.2 Market Forecast
- 9.3.2 France
- 9.3.2.1 Market Trends
- 9.3.2.2 Market Forecast
- 9.3.3 United Kingdom
- 9.3.3.1 Market Trends
- 9.3.3.2 Market Forecast
- 9.3.4 Italy
- 9.3.4.1 Market Trends
- 9.3.4.2 Market Forecast
- 9.3.5 Spain
- 9.3.5.1 Market Trends
- 9.3.5.2 Market Forecast
- 9.3.6 Russia
- 9.3.6.1 Market Trends
- 9.3.6.2 Market Forecast
- 9.3.7 Others
- 9.3.7.1 Market Trends
- 9.3.7.2 Market Forecast
- 9.3.1 Germany
- 9.4 Latin America
- 9.4.1 Brazil
- 9.4.1.1 Market Trends
- 9.4.1.2 Market Forecast
- 9.4.2 Mexico
- 9.4.2.1 Market Trends
- 9.4.2.2 Market Forecast
- 9.4.3 Others
- 9.4.3.1 Market Trends
- 9.4.3.2 Market Forecast
- 9.4.1 Brazil
- 9.5 Middle East and Africa
- 9.5.1 Market Trends
- 9.5.2 Market Breakup by Country
- 9.5.3 Market Forecast
10 Drivers, Restraints, and Opportunities
- 10.1 Overview
- 10.2 Drivers
- 10.3 Restraints
- 10.4 Opportunities
11 Value Chain Analysis
12 Porters Five Forces Analysis
- 12.1 Overview
- 12.2 Bargaining Power of Buyers
- 12.3 Bargaining Power of Suppliers
- 12.4 Degree of Competition
- 12.5 Threat of New Entrants
- 12.6 Threat of Substitutes
13 Price Analysis
14 Competitive Landscape
- 14.1 Market Structure
- 14.2 Key Players
- 14.3 Profiles of Key Players
- 14.3.1 Bayerische Motoren Werke AG
- 14.3.1.1 Company Overview
- 14.3.1.2 Product Portfolio
- 14.3.1.3 Financials
- 14.3.1.4 SWOT Analysis
- 14.3.2 Ford Motor Company
- 14.3.2.1 Company Overview
- 14.3.2.2 Product Portfolio
- 14.3.2.3 Financials
- 14.3.2.4 SWOT Analysis
- 14.3.3 General Motors Company
- 14.3.3.1 Company Overview
- 14.3.3.2 Product Portfolio
- 14.3.3.3 Financials
- 14.3.3.4 SWOT Analysis
- 14.3.4 Honda Motor Co. Ltd.
- 14.3.4.1 Company Overview
- 14.3.4.2 Product Portfolio
- 14.3.4.3 Financials
- 14.3.4.4 SWOT Analysis
- 14.3.5 Hyundai Motor Company
- 14.3.5.1 Company Overview
- 14.3.5.2 Product Portfolio
- 14.3.5.3 Financials
- 14.3.5.4 SWOT Analysis
- 14.3.6 Mahindra & Mahindra Limited
- 14.3.6.1 Company Overview
- 14.3.6.2 Product Portfolio
- 14.3.7 Maruti Suzuki India Limited (Suzuki Motor Corporation)
- 14.3.7.1 Company Overview
- 14.3.7.2 Product Portfolio
- 14.3.7.3 Financials
- 14.3.7.4 SWOT Analysis
- 14.3.8 Mitsubishi Motors Corporation
- 14.3.8.1 Company Overview
- 14.3.8.2 Product Portfolio
- 14.3.8.3 Financials
- 14.3.8.4 SWOT Analysis
- 14.3.9 Nissan Motor Co. Ltd.
- 14.3.9.1 Company Overview
- 14.3.9.2 Product Portfolio
- 14.3.9.3 Financials
- 14.3.9.4 SWOT Analysis
- 14.3.10 Toyota Motor Corporation
- 14.3.10.1 Company Overview
- 14.3.10.2 Product Portfolio
- 14.3.10.3 Financials
- 14.3.10.4 SWOT Analysis
- 14.3.11 Volkswagen AG
- 14.3.11.1 Company Overview
- 14.3.11.2 Product Portfolio
- 14.3.11.3 Financials
- 14.3.11.4 SWOT Analysis
- 14.3.1 Bayerische Motoren Werke AG
Kindly note that this only represents a partial list of companies, and the complete list has been provided in the report.
