|
|
市場調査レポート
商品コード
1675764
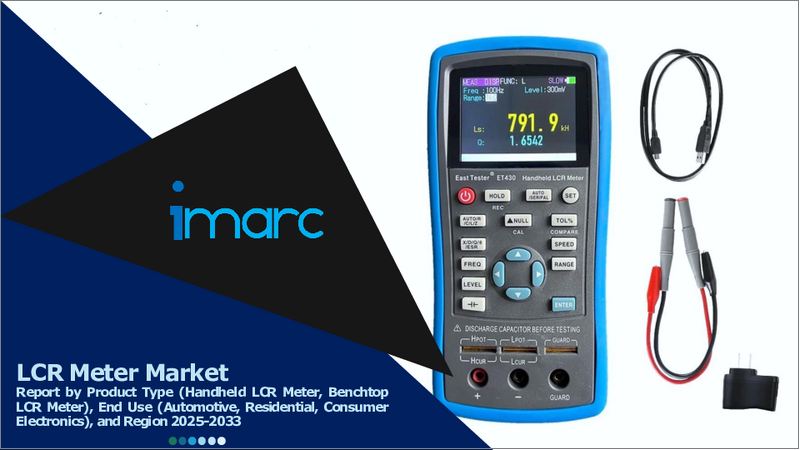
LCRメーター市場:製品タイプ別、最終用途別、地域別、2025-2033年LCR Meter Market Report by Product Type (Handheld LCR Meter, Benchtop LCR Meter), End Use (Automotive, Residential, Consumer Electronics), and Region 2025-2033 |
||||||
|
|||||||
カスタマイズ可能
|
|||||||


| LCRメーター市場:製品タイプ別、最終用途別、地域別、2025-2033年 |
|
出版日: 2025年03月01日
発行: IMARC
ページ情報: 英文 136 Pages
納期: 2~3営業日
|

全表示
- 概要
- 図表
- 目次
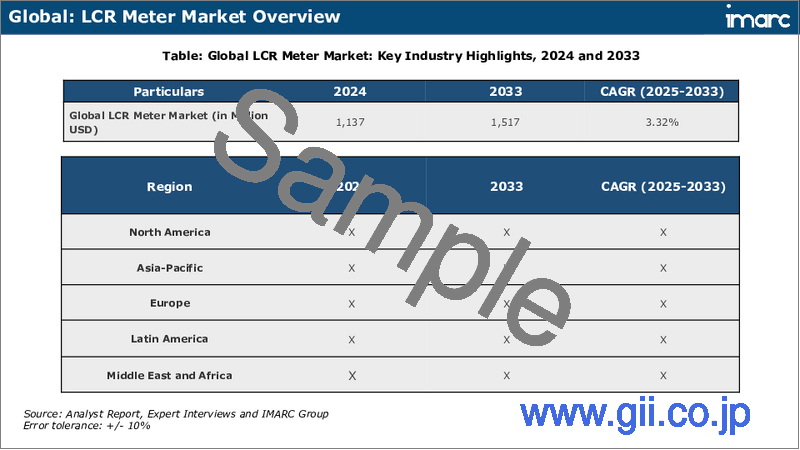
LCRメーター市場の世界市場規模は2024年に11億米ドルに達しました。今後、IMARC Groupは、市場は2033年までに15億米ドルに達し、2025-2033年の成長率(CAGR)は3.32%になると予測しています。コンシューマーエレクトロニクスや電気モーターの採用増加、世界の輸出活動の増加、部品のバッチチェックや品質保証・検査用のLCRメーター需要の増大が、市場を牽引する主な要因の一つです。
LCRメーターは、回路や電気部品のインダクタンス(L)、キャパシタンス(C)、抵抗(R)を異なる周波数で測定するデジタルテストデバイスの一種です。また、電流と電圧の実効値の比を計算したり、電流波形と電圧波形の位相差を測定したりするのにも利用できます。この機器は数値を表示し、一般的にハンドヘルド型とベンチトップ型の2種類があり、サイズも1kHzから100MHz以上まで様々です。ハンドヘルド型は軽量、コンパクトで携帯性に優れ、測定周波数は0.1%~0.2%であるのに対し、ベンチトップ型は0.01%で、携帯性に優れていないです。高い測定精度、自動レンジ識別、交流(AC)に対する耐性を保証する速度など、いくつかの利点があります。その結果、インダクター、コンデンサー、抵抗器の直接かつ正確な測定に、さまざまな試験周波数を使用して広く使用されています。現在、LCRメーターは、製造業やエレクトロニクス産業、および部品の校正や回路テストのための研究所で幅広く使用されています。
LCRメーターの市場傾向:
コンシューマーエレクトロニクスと電気モーターの採用が増加していることが、市場成長の主な要因です。これは、スマートフォン、タブレット、ノートパソコン、電気自動車(EV)、テレビ、冷蔵庫など、数多くの最新家電製品で、インダクタやコンデンサなどの電気部品の使用が急増していることに起因しています。これらの機器は、長時間にわたって優れた性能を発揮する電子部品を必要とするため、メーカーは電子機器への信頼性の高い電力供給を実現する高周波インダクタの開発に注力しています。ワイヤレスEV充電の採用拡大や電子機器輸出の大幅増加も相まって、市場成長にプラスの影響を与えています。さらに、エレクトロニクス分野では、品質チェック、現場観察、検査用途でのLCRメーターの利用が増加しています。これに伴い、製品の強化や発見に注力する企業の増加により、コンポーネントのバッチチェックや品質保証・検査用のLCRメーターの需要が喚起されています。さらに、様々な主なプレーヤーが研究開発(R&D)活動に従事し、LCRメーターの精度、速度、全体的な性能を向上させるとともに、軽量化を図っています。これに加えて、環境に優しい新型メーターや、ユーザーフレンドリーなインターフェースと強化された測定機能を備えた機能豊富なバリアントの発売など、最近の製品革新が市場成長を後押ししています。その他、インダストリー4.0の到来、新時代のコンデンサの登場、エレクトロニクス・半導体産業の大幅な拡大、急速なデジタル化、継続的な技術進歩などが、市場成長を後押しする主な要因となっています。
本レポートで扱う主な質問
- 世界のLCRメーターの市場はこれまでどのように推移してきたか?
- 世界のLCRメーターの市場における促進要因、抑制要因、機会は何か?
- 各促進要因、抑制要因、機会が世界のLCRメーターの市場に与える影響は?
- 主要な地域市場とは?
- 最も魅力的なLCRメーターの市場はどの国か?
- 製品タイプ別の市場内訳は?
- LCRメーターの市場で最も魅力的な製品タイプは?
- 最終用途別の市場内訳は?
- LCRメーターの市場で最も魅力的な最終用途は?
- 世界のLCRメーターの市場の競合構造は?
- LCRメーターの市場の世界市場における主要プレーヤー/企業は?
目次
第1章 序文
第2章 調査範囲と調査手法
- 調査の目的
- ステークホルダー
- データソース
- 一次情報
- 二次情報
- 市場推定
- ボトムアップアプローチ
- トップダウンアプローチ
- 調査手法
第3章 エグゼクティブサマリー
第4章 イントロダクション
- 概要
- 主要業界動向
第5章 世界のLCRメーター市場
- 市場概要
- 市場実績
- COVID-19の影響
- 市場予測
第6章 市場内訳:製品タイプ別
- ハンドヘルド型LCRメーター
- ベンチトップ型LCRメーター
第7章 市場内訳:最終用途別
- 自動車
- 住宅
- コンシューマーエレクトロニクス
第8章 市場内訳:地域別
- 北米
- 米国
- カナダ
- アジア太平洋地域
- 中国
- 日本
- インド
- 韓国
- オーストラリア
- インドネシア
- その他
- 欧州
- ドイツ
- フランス
- 英国
- イタリア
- スペイン
- ロシア
- その他
- ラテンアメリカ
- ブラジル
- メキシコ
- その他
- 中東・アフリカ
- 市場内訳:国別
第9章 促進要因・抑制要因・機会
- 概要
- 促進要因
- 抑制要因
- 機会
第10章 バリューチェーン分析
第11章 ポーターのファイブフォース分析
- 概要
- 買い手の交渉力
- 供給企業の交渉力
- 競合の程度
- 新規参入業者の脅威
- 代替品の脅威
第12章 価格分析
第13章 競合情勢
- 市場構造
- 主要企業
- 主要企業のプロファイル
- B&K Precision Corporation
- Chroma ATE Inc.
- Hioki E.E. Corporation
- IET Labs Inc.
- Meco Instruments Pvt. Ltd.
- National Instruments Corporation
- Newtons4th Ltd
- Rohde & Schwarz
- Sanwa Electric Instrument Co. Ltd.
- Scientific Mes-Technik Pvt. Ltd.
- Siborg Systems Inc.
- Stanford Research Systems Inc.
- Teledyne FLIR LLC(Teledyne Technologies Incorporated)
List of Figures
- Figure 1: Global: LCR Meter Market: Major Drivers and Challenges
- Figure 2: Global: LCR Meter Market: Sales Value (in Billion USD), 2019-2024
- Figure 3: Global: LCR Meter Market Forecast: Sales Value (in Billion USD), 2025-2033
- Figure 4: Global: LCR Meter Market: Breakup by Product Type (in %), 2024
- Figure 5: Global: LCR Meter Market: Breakup by End Use (in %), 2024
- Figure 6: Global: LCR Meter Market: Breakup by Region (in %), 2024
- Figure 7: Global: LCR Meter (Handheld LCR Meter) Market: Sales Value (in Million USD), 2019 & 2024
- Figure 8: Global: LCR Meter (Handheld LCR Meter) Market Forecast: Sales Value (in Million USD), 2025-2033
- Figure 9: Global: LCR Meter (Benchtop LCR Meter) Market: Sales Value (in Million USD), 2019 & 2024
- Figure 10: Global: LCR Meter (Benchtop LCR Meter) Market Forecast: Sales Value (in Million USD), 2025-2033
- Figure 11: Global: LCR Meter (Automotive) Market: Sales Value (in Million USD), 2019 & 2024
- Figure 12: Global: LCR Meter (Automotive) Market Forecast: Sales Value (in Million USD), 2025-2033
- Figure 13: Global: LCR Meter (Residential) Market: Sales Value (in Million USD), 2019 & 2024
- Figure 14: Global: LCR Meter (Residential) Market Forecast: Sales Value (in Million USD), 2025-2033
- Figure 15: Global: LCR Meter (Consumer Electronics) Market: Sales Value (in Million USD), 2019 & 2024
- Figure 16: Global: LCR Meter (Consumer Electronics) Market Forecast: Sales Value (in Million USD), 2025-2033
- Figure 17: North America: LCR Meter Market: Sales Value (in Million USD), 2019 & 2024
- Figure 18: North America: LCR Meter Market Forecast: Sales Value (in Million USD), 2025-2033
- Figure 19: United States: LCR Meter Market: Sales Value (in Million USD), 2019 & 2024
- Figure 20: United States: LCR Meter Market Forecast: Sales Value (in Million USD), 2025-2033
- Figure 21: Canada: LCR Meter Market: Sales Value (in Million USD), 2019 & 2024
- Figure 22: Canada: LCR Meter Market Forecast: Sales Value (in Million USD), 2025-2033
- Figure 23: Asia-Pacific: LCR Meter Market: Sales Value (in Million USD), 2019 & 2024
- Figure 24: Asia-Pacific: LCR Meter Market Forecast: Sales Value (in Million USD), 2025-2033
- Figure 25: China: LCR Meter Market: Sales Value (in Million USD), 2019 & 2024
- Figure 26: China: LCR Meter Market Forecast: Sales Value (in Million USD), 2025-2033
- Figure 27: Japan: LCR Meter Market: Sales Value (in Million USD), 2019 & 2024
- Figure 28: Japan: LCR Meter Market Forecast: Sales Value (in Million USD), 2025-2033
- Figure 29: India: LCR Meter Market: Sales Value (in Million USD), 2019 & 2024
- Figure 30: India: LCR Meter Market Forecast: Sales Value (in Million USD), 2025-2033
- Figure 31: South Korea: LCR Meter Market: Sales Value (in Million USD), 2019 & 2024
- Figure 32: South Korea: LCR Meter Market Forecast: Sales Value (in Million USD), 2025-2033
- Figure 33: Australia: LCR Meter Market: Sales Value (in Million USD), 2019 & 2024
- Figure 34: Australia: LCR Meter Market Forecast: Sales Value (in Million USD), 2025-2033
- Figure 35: Indonesia: LCR Meter Market: Sales Value (in Million USD), 2019 & 2024
- Figure 36: Indonesia: LCR Meter Market Forecast: Sales Value (in Million USD), 2025-2033
- Figure 37: Others: LCR Meter Market: Sales Value (in Million USD), 2019 & 2024
- Figure 38: Others: LCR Meter Market Forecast: Sales Value (in Million USD), 2025-2033
- Figure 39: Europe: LCR Meter Market: Sales Value (in Million USD), 2019 & 2024
- Figure 40: Europe: LCR Meter Market Forecast: Sales Value (in Million USD), 2025-2033
- Figure 41: Germany: LCR Meter Market: Sales Value (in Million USD), 2019 & 2024
- Figure 42: Germany: LCR Meter Market Forecast: Sales Value (in Million USD), 2025-2033
- Figure 43: France: LCR Meter Market: Sales Value (in Million USD), 2019 & 2024
- Figure 44: France: LCR Meter Market Forecast: Sales Value (in Million USD), 2025-2033
- Figure 45: United Kingdom: LCR Meter Market: Sales Value (in Million USD), 2019 & 2024
- Figure 46: United Kingdom: LCR Meter Market Forecast: Sales Value (in Million USD), 2025-2033
- Figure 47: Italy: LCR Meter Market: Sales Value (in Million USD), 2019 & 2024
- Figure 48: Italy: LCR Meter Market Forecast: Sales Value (in Million USD), 2025-2033
- Figure 49: Spain: LCR Meter Market: Sales Value (in Million USD), 2019 & 2024
- Figure 50: Spain: LCR Meter Market Forecast: Sales Value (in Million USD), 2025-2033
- Figure 51: Russia: LCR Meter Market: Sales Value (in Million USD), 2019 & 2024
- Figure 52: Russia: LCR Meter Market Forecast: Sales Value (in Million USD), 2025-2033
- Figure 53: Others: LCR Meter Market: Sales Value (in Million USD), 2019 & 2024
- Figure 54: Others: LCR Meter Market Forecast: Sales Value (in Million USD), 2025-2033
- Figure 55: Latin America: LCR Meter Market: Sales Value (in Million USD), 2019 & 2024
- Figure 56: Latin America: LCR Meter Market Forecast: Sales Value (in Million USD), 2025-2033
- Figure 57: Brazil: LCR Meter Market: Sales Value (in Million USD), 2019 & 2024
- Figure 58: Brazil: LCR Meter Market Forecast: Sales Value (in Million USD), 2025-2033
- Figure 59: Mexico: LCR Meter Market: Sales Value (in Million USD), 2019 & 2024
- Figure 60: Mexico: LCR Meter Market Forecast: Sales Value (in Million USD), 2025-2033
- Figure 61: Others: LCR Meter Market: Sales Value (in Million USD), 2019 & 2024
- Figure 62: Others: LCR Meter Market Forecast: Sales Value (in Million USD), 2025-2033
- Figure 63: Middle East and Africa: LCR Meter Market: Sales Value (in Million USD), 2019 & 2024
- Figure 64: Middle East and Africa: LCR Meter Market: Breakup by Country (in %), 2024
- Figure 65: Middle East and Africa: LCR Meter Market Forecast: Sales Value (in Million USD), 2025-2033
- Figure 66: Global: LCR Meter Industry: Drivers, Restraints, and Opportunities
- Figure 67: Global: LCR Meter Industry: Value Chain Analysis
- Figure 68: Global: LCR Meter Industry: Porter's Five Forces Analysis
List of Tables
- Table 1: Global: LCR Meter Market: Key Industry Highlights, 2024 & 2033
- Table 2: Global: LCR Meter Market Forecast: Breakup by Product Type (in Million USD), 2025-2033
- Table 3: Global: LCR Meter Market Forecast: Breakup by End Use (in Million USD), 2025-2033
- Table 4: Global: LCR Meter Market Forecast: Breakup by Region (in Million USD), 2025-2033
- Table 5: Global: LCR Meter Market: Competitive Structure
- Table 6: Global: LCR Meter Market: Key Players
The global LCR meter market size reached USD 1.1 Billion in 2024. Looking forward, IMARC Group expects the market to reach USD 1.5 Billion by 2033, exhibiting a growth rate (CAGR) of 3.32% during 2025-2033. The rising adoption of consumer electronics and electric motors, increasing export activities worldwide, and augmenting demand for LCR meters for batch checking of components and quality assurance and inspections represent some of the key factors driving the market.
LCR meter is a type of digital test device for measuring the inductance (L), capacitance (C), and resistance (R) of circuits and electrical components at different frequencies. It can also be utilized to calculate the ratio of the current and voltage RMS values and measure the phase difference between the current and voltage waveforms. This equipment displays the value in numerical forms and is commonly available in two types, namely handheld and benchtop, in various sizes, ranging from 1 kHz to 100 MHz and above. While the handheld variant is lightweight, compact, and portable with a frequency between 0.1% and 0.2%, the benchtop type is non-portable with a frequency of 0.01%. It offers several advantages, including high measurement accuracy, automatic range identification, and speed to ensure resistance to alternating current (AC). As a result, it is widely used for direct and precise measurements of inductors, capacitors, and resistors using varying test frequencies. Presently, LCR meter finds extensive applications across the manufacturing and electronics industries and in laboratories for component calibration and circuit testing.
LCR Meter Market Trends:
The rising adoption of consumer electronics and electric motors represents the primary factor driving the market growth. This can be attributed to the surging use of electrical components, such as inductors and capacitors, in numerous modern appliances, including smartphones, tablets, laptops, electric vehicles (EVs), televisions, and refrigerators. Since these devices require electronic components to deliver superior performance for extended durations, manufacturers are focusing on developing high-frequency inductors for reliable power supply in electronics. This, coupled with the escalating adoption of wireless EV charging and a significant increase in electronics exports, is positively influencing the market growth. Additionally, there is a rise in the utilization of LCR meters in the electronics sector for performing quality checks, field observations, and inspection applications. In line with this, the growing focus of businesses on product enhancements or discoveries has catalyzed the demand for LCR meters for batch checking of components and quality assurance and inspections. Furthermore, various key players are engaging in research and development (R&D) activities to improve the accuracy, speed, and overall performance of LCR meters while lowering their weight. Besides this, recent product innovations, such as the launch of new environment-friendly meters and feature-rich variants with a user-friendly interface and enhanced measurement capabilities, have propelled market growth. Other major factors fueling the market growth include the advent of Industry 4.0, the emergence of new-age capacitors, significant expansion in the electronics and semiconductor industries, rapid digitization, and ongoing technological advancements.
Key Market Segmentation:
Product Type Insights:
- Handheld LCR Meter
- Benchtop LCR Meter
End Use Insights:
- Automotive
- Residential
- Consumer Electronics
Regional Insights:
- North America
- United States
- Canada
- Asia-Pacific
- China
- Japan
- India
- South Korea
- Australia
- Indonesia
- Others
- Europe
- Germany
- France
- United Kingdom
- Italy
- Spain
- Russia
- Others
- Latin America
- Brazil
- Mexico
- Others
- Middle East and Africa
- The report has also provided a comprehensive analysis of all the major regional markets, which include North America (the United States and Canada); Asia-Pacific (China, Japan, India, South Korea, Australia, Indonesia, and others); Europe (Germany, France, the United Kingdom, Italy, Spain, Russia, and others); Latin America (Brazil, Mexico, and others); and the Middle East and Africa. According to the report, Asia-Pacific was the largest market for LCR meter. Some of the factors driving the Asia-Pacific LCR meter market included the elevating sales of consumer electronics and electric vehicles, rising product adoption for quality assurance and inspections by manufacturers across different industry verticals, increasing use of semiconductor devices, etc.
Competitive Landscape:
- The report has also provided a comprehensive analysis of the competitive landscape in the global LCR meter market. Detailed profiles of all major companies have been provided. Some of the companies covered include B&K Precision Corporation, Chroma ATE Inc., Hioki E.E. Corporation, IET Labs Inc., Meco Instruments Pvt. Ltd., National Instruments Corporation, Newtons4th Ltd, Rohde & Schwarz, Sanwa Electric Instrument Co. Ltd., Scientific Mes-Technik Pvt. Ltd., Siborg Systems Inc., Stanford Research Systems Inc., Teledyne FLIR LLC (Teledyne Technologies Incorporated), etc. Kindly note that this only represents a partial list of companies, and the complete list has been provided in the report.
Key Questions Answered in This Report:
- How has the global LCR meter market performed so far, and how will it perform in the coming years?
- What are the drivers, restraints, and opportunities in the global LCR meter market?
- What is the impact of each driver, restraint, and opportunity on the global LCR meter market?
- What are the key regional markets?
- Which countries represent the most attractive LCR meter market?
- What is the breakup of the market based on the product type?
- Which is the most attractive product type in the LCR meter market?
- What is the breakup of the market based on the end use?
- Which is the most attractive end use in the LCR meter market?
- What is the competitive structure of the global LCR meter market?
- Who are the key players/companies in the global LCR meter market?
Table of Contents
1 Preface
2 Scope and Methodology
- 2.1 Objectives of the Study
- 2.2 Stakeholders
- 2.3 Data Sources
- 2.3.1 Primary Sources
- 2.3.2 Secondary Sources
- 2.4 Market Estimation
- 2.4.1 Bottom-Up Approach
- 2.4.2 Top-Down Approach
- 2.5 Forecasting Methodology
3 Executive Summary
4 Introduction
- 4.1 Overview
- 4.2 Key Industry Trends
5 Global LCR Meter Market
- 5.1 Market Overview
- 5.2 Market Performance
- 5.3 Impact of COVID-19
- 5.4 Market Forecast
6 Market Breakup by Product Type
- 6.1 Handheld LCR Meter
- 6.1.1 Market Trends
- 6.1.2 Market Forecast
- 6.2 Benchtop LCR Meter
- 6.2.1 Market Trends
- 6.2.2 Market Forecast
7 Market Breakup by End Use
- 7.1 Automotive
- 7.1.1 Market Trends
- 7.1.2 Market Forecast
- 7.2 Residential
- 7.2.1 Market Trends
- 7.2.2 Market Forecast
- 7.3 Consumer Electronics
- 7.3.1 Market Trends
- 7.3.2 Market Forecast
8 Market Breakup by Region
- 8.1 North America
- 8.1.1 United States
- 8.1.1.1 Market Trends
- 8.1.1.2 Market Forecast
- 8.1.2 Canada
- 8.1.2.1 Market Trends
- 8.1.2.2 Market Forecast
- 8.1.1 United States
- 8.2 Asia-Pacific
- 8.2.1 China
- 8.2.1.1 Market Trends
- 8.2.1.2 Market Forecast
- 8.2.2 Japan
- 8.2.2.1 Market Trends
- 8.2.2.2 Market Forecast
- 8.2.3 India
- 8.2.3.1 Market Trends
- 8.2.3.2 Market Forecast
- 8.2.4 South Korea
- 8.2.4.1 Market Trends
- 8.2.4.2 Market Forecast
- 8.2.5 Australia
- 8.2.5.1 Market Trends
- 8.2.5.2 Market Forecast
- 8.2.6 Indonesia
- 8.2.6.1 Market Trends
- 8.2.6.2 Market Forecast
- 8.2.7 Others
- 8.2.7.1 Market Trends
- 8.2.7.2 Market Forecast
- 8.2.1 China
- 8.3 Europe
- 8.3.1 Germany
- 8.3.1.1 Market Trends
- 8.3.1.2 Market Forecast
- 8.3.2 France
- 8.3.2.1 Market Trends
- 8.3.2.2 Market Forecast
- 8.3.3 United Kingdom
- 8.3.3.1 Market Trends
- 8.3.3.2 Market Forecast
- 8.3.4 Italy
- 8.3.4.1 Market Trends
- 8.3.4.2 Market Forecast
- 8.3.5 Spain
- 8.3.5.1 Market Trends
- 8.3.5.2 Market Forecast
- 8.3.6 Russia
- 8.3.6.1 Market Trends
- 8.3.6.2 Market Forecast
- 8.3.7 Others
- 8.3.7.1 Market Trends
- 8.3.7.2 Market Forecast
- 8.3.1 Germany
- 8.4 Latin America
- 8.4.1 Brazil
- 8.4.1.1 Market Trends
- 8.4.1.2 Market Forecast
- 8.4.2 Mexico
- 8.4.2.1 Market Trends
- 8.4.2.2 Market Forecast
- 8.4.3 Others
- 8.4.3.1 Market Trends
- 8.4.3.2 Market Forecast
- 8.4.1 Brazil
- 8.5 Middle East and Africa
- 8.5.1 Market Trends
- 8.5.2 Market Breakup by Country
- 8.5.3 Market Forecast
9 Drivers, Restraints, and Opportunities
- 9.1 Overview
- 9.2 Drivers
- 9.3 Restraints
- 9.4 Opportunities
10 Value Chain Analysis
11 Porters Five Forces Analysis
- 11.1 Overview
- 11.2 Bargaining Power of Buyers
- 11.3 Bargaining Power of Suppliers
- 11.4 Degree of Competition
- 11.5 Threat of New Entrants
- 11.6 Threat of Substitutes
12 Price Analysis
13 Competitive Landscape
- 13.1 Market Structure
- 13.2 Key Players
- 13.3 Profiles of Key Players
- 13.3.1 B&K Precision Corporation
- 13.3.1.1 Company Overview
- 13.3.1.2 Product Portfolio
- 13.3.2 Chroma ATE Inc.
- 13.3.2.1 Company Overview
- 13.3.2.2 Product Portfolio
- 13.3.3 Hioki E.E. Corporation
- 13.3.3.1 Company Overview
- 13.3.3.2 Product Portfolio
- 13.3.4 IET Labs Inc.
- 13.3.4.1 Company Overview
- 13.3.4.2 Product Portfolio
- 13.3.5 Meco Instruments Pvt. Ltd.
- 13.3.5.1 Company Overview
- 13.3.5.2 Product Portfolio
- 13.3.6 National Instruments Corporation
- 13.3.6.1 Company Overview
- 13.3.6.2 Product Portfolio
- 13.3.7 Newtons4th Ltd
- 13.3.7.1 Company Overview
- 13.3.7.2 Product Portfolio
- 13.3.8 Rohde & Schwarz
- 13.3.8.1 Company Overview
- 13.3.8.2 Product Portfolio
- 13.3.9 Sanwa Electric Instrument Co. Ltd.
- 13.3.9.1 Company Overview
- 13.3.9.2 Product Portfolio
- 13.3.10 Scientific Mes-Technik Pvt. Ltd.
- 13.3.10.1 Company Overview
- 13.3.10.2 Product Portfolio
- 13.3.11 Siborg Systems Inc.
- 13.3.11.1 Company Overview
- 13.3.11.2 Product Portfolio
- 13.3.12 Stanford Research Systems Inc.
- 13.3.12.1 Company Overview
- 13.3.12.2 Product Portfolio
- 13.3.13 Teledyne FLIR LLC (Teledyne Technologies Incorporated)
- 13.3.13.1 Company Overview
- 13.3.13.2 Product Portfolio
- 13.3.1 B&K Precision Corporation
Kindly note that this only represents a partial list of companies, and the complete list has been provided in the report.

