デフォルト表紙
市場調査レポート
商品コード
1390857

薬物・機器コンビネーション製品市場レポート:製品、用途、エンドユーザー、地域別、2023-2028年

Drug Device Combination Products Market Report by Product, Application, End User, and Region 2023-2028

出版日: | 発行: IMARC | ページ情報: 英文 143 Pages | 納期: 2~3営業日

● お客様のご希望に応じて、既存データの加工や未掲載情報(例:国別セグメント)の追加などの対応が可能です。  詳細はお問い合わせください。

価格
価格表記: USDを日本円(税抜)に換算
本日の銀行送金レート: 1USD=156.76円
薬物・機器コンビネーション製品市場レポート:製品、用途、エンドユーザー、地域別、2023-2028年
出版日: 2023年11月24日
発行: IMARC
ページ情報: 英文 143 Pages
納期: 2~3営業日
  • 全表示
  • 概要
  • 図表
  • 目次
概要

概要

世界の薬物・機器コンビネーション製品の市場規模は、2022年に1,436億米ドルに達しました。今後、IMARC Groupは、市場は2028年までに2,304億米ドルに達し、2022年から2028年の間に8.20%の成長率(CAGR)を示すと予測しています。

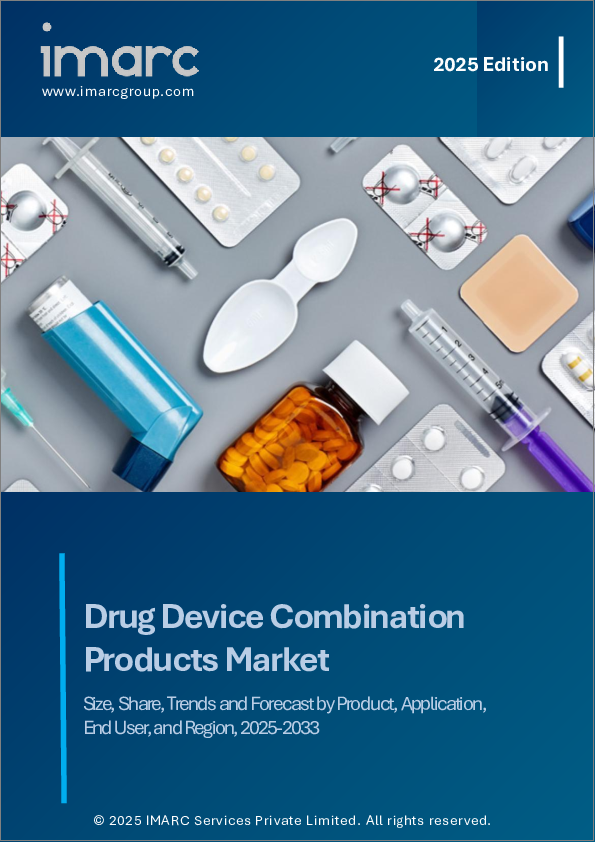
薬物・機器コンビネーション製品は、医療機器と医薬品成分で構成され、患者の体内の特定の場所に薬剤を送達するのを補助します。これには、送達装置と一緒に包装されたワクチンバイアル、ドレープと麻酔綿棒を備えた手術用トレイ、注射器、インスリン注射器ペン、定量吸入器などのプレフィルド薬物送達システムなどが含まれます。一般的に入手可能な薬剤デバイス組合せ製品の中には、治療薬と組み合わせたモノクローナル抗体、ステロイドコーティングされた先端を持つペーシングリード、抗菌コーティングされたカテーテル、包帯やガーゼを含む救急キットなどがあります。

薬物・機器コンビネーション製品の市場動向:

慢性疾患の有病率の増加や、疾患治療における新たなアプローチへの需要の高まりは、世界中で薬物・機器コンビネーション製品の採用を促進する主要因の一つです。これらの製品は、がん、心臓病、多発性硬化症、脳性麻痺、脊髄損傷、貧血、肝炎、関節リウマチ、糖尿病、その他の深刻な症状に苦しむ患者を支援します。さらに、これらの製品は、最小限の副作用、制御された薬物投与、患者のコンプライアンス向上、標的ドラッグデリバリーなどの利点を提供します。これは、治療効果に必要な薬剤量を削減するスマートで精密なドラッグデリバリーシステムへの嗜好の高まりと相まって、市場の成長に寄与しています。これとは別に、市場参入企業は追跡やモニタリングの目的で、薬物・機器コンビネーション製品に技術を組み込んでいます。また、ペプチド、リポソーム、経皮など、複雑な有効成分、製剤、送達経路、剤形を用いた洗練された製品の導入も進んでいます。さらに、高粘度、製剤、新クラスの生物製剤を用いた次世代製品の開発にも注力しています。その結果、これらの製品に対する需要は、患者により密着した治療やソリューションを提供するために高まると予想されます。

本レポートで扱う主な質問

  • 世界の薬物・機器コンビネーション製品市場はこれまでどのように推移し、今後数年間はどのように推移するのか?
  • COVID-19が世界の薬物・機器コンビネーション製品市場に与えた影響は?
  • 主要な地域市場は?
  • 製品別の市場内訳は?
  • 用途別の市場内訳は?
  • エンドユーザー別の市場内訳は?
  • 業界のバリューチェーンにおける様々な段階とは?
  • 業界の主要な促進要因と課題は何か?
  • 世界の薬物・機器コンビネーション製品市場の構造と主要プレーヤーは?
  • 業界の競合の程度は?

目次

第1章 序文

第2章 調査範囲と調査手法

  • 調査目的
  • 利害関係者
  • データソース
    • 一次情報
    • 二次情報
  • 市場推定
    • ボトムアップアプローチ
    • トップダウンアプローチ
  • 調査手法

第3章 エグゼクティブサマリー

第4章 イントロダクション

  • 概要
  • 主要産業動向

第5章 世界の薬物・機器コンビネーション製品市場

  • 市場概要
  • 市場実績
  • COVID-19の影響
  • 市場予測

第6章 市場内訳:製品別

  • 薬剤溶出ステント
    • 市場動向
    • 市場予測
  • 経皮吸収パッチ
    • 市場動向
    • 市場予測
  • 輸液ポンプ
    • 市場動向
    • 市場予測
  • 薬剤溶出バルーン
    • 市場動向
    • 市場予測
  • 吸入器
    • 市場動向
    • 市場予測
  • その他
    • 市場動向
    • 市場予測

第7章 市場内訳:用途別

  • 循環器
    • 市場動向
    • 市場予測
  • 糖尿病
    • 市場動向
    • 市場予測
  • がん治療
    • 市場動向
    • 市場予測
  • 呼吸器疾患
    • 市場動向
    • 市場予測
  • その他
    • 市場動向
    • 市場予測

第8章 市場内訳:エンドユーザー別

  • 病院
    • 市場動向
    • 市場予測
  • 外来手術センター
    • 市場動向
    • 市場予測
  • その他
    • 市場動向
    • 市場予測

第9章 市場内訳:地域別

  • 北米
    • 米国
      • 市場動向
      • 市場予測
    • カナダ
      • 市場動向
      • 市場予測
  • アジア太平洋
    • 中国
      • 市場動向
      • 市場予測
    • 日本
      • 市場動向
      • 市場予測
    • インド
      • 市場動向
      • 市場予測
    • 韓国
      • 市場動向
      • 市場予測
    • オーストラリア
      • 市場動向
      • 市場予測
    • インドネシア
      • 市場動向
      • 市場予測
    • その他
      • 市場動向
      • 市場予測
  • 欧州
    • ドイツ
      • 市場動向
      • 市場予測
    • フランス
      • 市場動向
      • 市場予測
    • 英国
      • 市場動向
      • 市場予測
    • イタリア
      • 市場動向
      • 市場予測
    • スペイン
      • 市場動向
      • 市場予測
    • ロシア
      • 市場動向
      • 市場予測
    • その他
      • 市場動向
      • 市場予測
  • ラテンアメリカ
    • ブラジル
      • 市場動向
      • 市場予測
    • メキシコ
      • 市場動向
      • 市場予測
    • その他
      • 市場動向
      • 市場予測
  • 中東・アフリカ地域
    • 市場動向
    • 市場内訳:国別
    • 市場予測

第10章 SWOT分析

  • 概要
  • 強み
  • 弱み
  • 機会
  • 脅威

第11章 バリューチェーン分析

第12章 ポーターのファイブフォース分析

  • 概要
  • 買い手の交渉力
  • 供給企業の交渉力
  • 競合の程度
  • 新規参入業者の脅威
  • 代替品の脅威

第13章 価格分析

第14章 競合情勢

  • 市場構造
  • 主要企業
  • 主要企業のプロファイル
    • Abbott Laboratories
    • Baxter International Inc.
    • Bayer AG
    • Becton Dickinson and Company
    • Boston Scientific Corporation
    • GlaxoSmithKline plc
    • Johnson & Johnson
    • Medtronic plc
    • Novartis AG
    • Smith & Nephew plc
    • Stryker Corporation
    • Terumo Corporation
図表

List of Figures

  • Figure 1: Global: Drug Device Combination Products Market: Major Drivers and Challenges
  • Figure 2: Global: Drug Device Combination Products Market: Sales Value (in Billion US$), 2017-2022
  • Figure 3: Global: Drug Device Combination Products Market Forecast: Sales Value (in Billion US$), 2023-2028
  • Figure 4: Global: Drug Device Combination Products Market: Breakup by Product (in %), 2022
  • Figure 5: Global: Drug Device Combination Products Market: Breakup by Application (in %), 2022
  • Figure 6: Global: Drug Device Combination Products Market: Breakup by End User (in %), 2022
  • Figure 7: Global: Drug Device Combination Products Market: Breakup by Region (in %), 2022
  • Figure 8: Global: Drug Device Combination Products (Drug Eluting Stents) Market: Sales Value (in Million US$), 2017 & 2022
  • Figure 9: Global: Drug Device Combination Products (Drug Eluting Stents) Market Forecast: Sales Value (in Million US$), 2023-2028
  • Figure 10: Global: Drug Device Combination Products (Transdermal Patches) Market: Sales Value (in Million US$), 2017 & 2022
  • Figure 11: Global: Drug Device Combination Products (Transdermal Patches) Market Forecast: Sales Value (in Million US$), 2023-2028
  • Figure 12: Global: Drug Device Combination Products (Infusion Pumps) Market: Sales Value (in Million US$), 2017 & 2022
  • Figure 13: Global: Drug Device Combination Products (Infusion Pumps) Market Forecast: Sales Value (in Million US$), 2023-2028
  • Figure 14: Global: Drug Device Combination Products (Drug Eluting Balloon) Market: Sales Value (in Million US$), 2017 & 2022
  • Figure 15: Global: Drug Device Combination Products (Drug Eluting Balloon) Market Forecast: Sales Value (in Million US$), 2023-2028
  • Figure 16: Global: Drug Device Combination Products (Inhalers) Market: Sales Value (in Million US$), 2017 & 2022
  • Figure 17: Global: Drug Device Combination Products (Inhalers) Market Forecast: Sales Value (in Million US$), 2023-2028
  • Figure 18: Global: Drug Device Combination Products (Other Products) Market: Sales Value (in Million US$), 2017 & 2022
  • Figure 19: Global: Drug Device Combination Products (Other Products) Market Forecast: Sales Value (in Million US$), 2023-2028
  • Figure 20: Global: Drug Device Combination Products (Cardiovascular) Market: Sales Value (in Million US$), 2017 & 2022
  • Figure 21: Global: Drug Device Combination Products (Cardiovascular) Market Forecast: Sales Value (in Million US$), 2023-2028
  • Figure 22: Global: Drug Device Combination Products (Diabetes) Market: Sales Value (in Million US$), 2017 & 2022
  • Figure 23: Global: Drug Device Combination Products (Diabetes) Market Forecast: Sales Value (in Million US$), 2023-2028
  • Figure 24: Global: Drug Device Combination Products (Cancer Treatment) Market: Sales Value (in Million US$), 2017 & 2022
  • Figure 25: Global: Drug Device Combination Products (Cancer Treatment) Market Forecast: Sales Value (in Million US$), 2023-2028
  • Figure 26: Global: Drug Device Combination Products (Respiratory Diseases) Market: Sales Value (in Million US$), 2017 & 2022
  • Figure 27: Global: Drug Device Combination Products (Respiratory Diseases) Market Forecast: Sales Value (in Million US$), 2023-2028
  • Figure 28: Global: Drug Device Combination Products (Other Applications) Market: Sales Value (in Million US$), 2017 & 2022
  • Figure 29: Global: Drug Device Combination Products (Other Applications) Market Forecast: Sales Value (in Million US$), 2023-2028
  • Figure 30: Global: Drug Device Combination Products (Hospitals) Market: Sales Value (in Million US$), 2017 & 2022
  • Figure 31: Global: Drug Device Combination Products (Hospitals) Market Forecast: Sales Value (in Million US$), 2023-2028
  • Figure 32: Global: Drug Device Combination Products (Ambulatory Surgical Centers) Market: Sales Value (in Million US$), 2017 & 2022
  • Figure 33: Global: Drug Device Combination Products (Ambulatory Surgical Centers) Market Forecast: Sales Value (in Million US$), 2023-2028
  • Figure 34: Global: Drug Device Combination Products (Other End Users) Market: Sales Value (in Million US$), 2017 & 2022
  • Figure 35: Global: Drug Device Combination Products (Other End Users) Market Forecast: Sales Value (in Million US$), 2023-2028
  • Figure 36: North America: Drug Device Combination Products Market: Sales Value (in Million US$), 2017 & 2022
  • Figure 37: North America: Drug Device Combination Products Market Forecast: Sales Value (in Million US$), 2023-2028
  • Figure 38: United States: Drug Device Combination Products Market: Sales Value (in Million US$), 2017 & 2022
  • Figure 39: United States: Drug Device Combination Products Market Forecast: Sales Value (in Million US$), 2023-2028
  • Figure 40: Canada: Drug Device Combination Products Market: Sales Value (in Million US$), 2017 & 2022
  • Figure 41: Canada: Drug Device Combination Products Market Forecast: Sales Value (in Million US$), 2023-2028
  • Figure 42: Asia-Pacific: Drug Device Combination Products Market: Sales Value (in Million US$), 2017 & 2022
  • Figure 43: Asia-Pacific: Drug Device Combination Products Market Forecast: Sales Value (in Million US$), 2023-2028
  • Figure 44: China: Drug Device Combination Products Market: Sales Value (in Million US$), 2017 & 2022
  • Figure 45: China: Drug Device Combination Products Market Forecast: Sales Value (in Million US$), 2023-2028
  • Figure 46: Japan: Drug Device Combination Products Market: Sales Value (in Million US$), 2017 & 2022
  • Figure 47: Japan: Drug Device Combination Products Market Forecast: Sales Value (in Million US$), 2023-2028
  • Figure 48: India: Drug Device Combination Products Market: Sales Value (in Million US$), 2017 & 2022
  • Figure 49: India: Drug Device Combination Products Market Forecast: Sales Value (in Million US$), 2023-2028
  • Figure 50: South Korea: Drug Device Combination Products Market: Sales Value (in Million US$), 2017 & 2022
  • Figure 51: South Korea: Drug Device Combination Products Market Forecast: Sales Value (in Million US$), 2023-2028
  • Figure 52: Australia: Drug Device Combination Products Market: Sales Value (in Million US$), 2017 & 2022
  • Figure 53: Australia: Drug Device Combination Products Market Forecast: Sales Value (in Million US$), 2023-2028
  • Figure 54: Indonesia: Drug Device Combination Products Market: Sales Value (in Million US$), 2017 & 2022
  • Figure 55: Indonesia: Drug Device Combination Products Market Forecast: Sales Value (in Million US$), 2023-2028
  • Figure 56: Others: Drug Device Combination Products Market: Sales Value (in Million US$), 2017 & 2022
  • Figure 57: Others: Drug Device Combination Products Market Forecast: Sales Value (in Million US$), 2023-2028
  • Figure 58: Europe: Drug Device Combination Products Market: Sales Value (in Million US$), 2017 & 2022
  • Figure 59: Europe: Drug Device Combination Products Market Forecast: Sales Value (in Million US$), 2023-2028
  • Figure 60: Germany: Drug Device Combination Products Market: Sales Value (in Million US$), 2017 & 2022
  • Figure 61: Germany: Drug Device Combination Products Market Forecast: Sales Value (in Million US$), 2023-2028
  • Figure 62: France: Drug Device Combination Products Market: Sales Value (in Million US$), 2017 & 2022
  • Figure 63: France: Drug Device Combination Products Market Forecast: Sales Value (in Million US$), 2023-2028
  • Figure 64: United Kingdom: Drug Device Combination Products Market: Sales Value (in Million US$), 2017 & 2022
  • Figure 65: United Kingdom: Drug Device Combination Products Market Forecast: Sales Value (in Million US$), 2023-2028
  • Figure 66: Italy: Drug Device Combination Products Market: Sales Value (in Million US$), 2017 & 2022
  • Figure 67: Italy: Drug Device Combination Products Market Forecast: Sales Value (in Million US$), 2023-2028
  • Figure 68: Spain: Drug Device Combination Products Market: Sales Value (in Million US$), 2017 & 2022
  • Figure 69: Spain: Drug Device Combination Products Market Forecast: Sales Value (in Million US$), 2023-2028
  • Figure 70: Russia: Drug Device Combination Products Market: Sales Value (in Million US$), 2017 & 2022
  • Figure 71: Russia: Drug Device Combination Products Market Forecast: Sales Value (in Million US$), 2023-2028
  • Figure 72: Others: Drug Device Combination Products Market: Sales Value (in Million US$), 2017 & 2022
  • Figure 73: Others: Drug Device Combination Products Market Forecast: Sales Value (in Million US$), 2023-2028
  • Figure 74: Latin America: Drug Device Combination Products Market: Sales Value (in Million US$), 2017 & 2022
  • Figure 75: Latin America: Drug Device Combination Products Market Forecast: Sales Value (in Million US$), 2023-2028
  • Figure 76: Brazil: Drug Device Combination Products Market: Sales Value (in Million US$), 2017 & 2022
  • Figure 77: Brazil: Drug Device Combination Products Market Forecast: Sales Value (in Million US$), 2023-2028
  • Figure 78: Mexico: Drug Device Combination Products Market: Sales Value (in Million US$), 2017 & 2022
  • Figure 79: Mexico: Drug Device Combination Products Market Forecast: Sales Value (in Million US$), 2023-2028
  • Figure 80: Others: Drug Device Combination Products Market: Sales Value (in Million US$), 2017 & 2022
  • Figure 81: Others: Drug Device Combination Products Market Forecast: Sales Value (in Million US$), 2023-2028
  • Figure 82: Middle East and Africa: Drug Device Combination Products Market: Sales Value (in Million US$), 2017 & 2022
  • Figure 83: Middle East and Africa: Drug Device Combination Products Market: Breakup by Country (in %), 2022
  • Figure 84: Middle East and Africa: Drug Device Combination Products Market Forecast: Sales Value (in Million US$), 2023-2028
  • Figure 85: Global: Drug Device Combination Products Industry: SWOT Analysis
  • Figure 86: Global: Drug Device Combination Products Industry: Value Chain Analysis
  • Figure 87: Global: Drug Device Combination Products Industry: Porter's Five Forces Analysis

List of Tables

  • Table 1: Global: Drug Device Combination Products Market: Key Industry Highlights, 2022 and 2028
  • Table 2: Global: Drug Device Combination Products Market Forecast: Breakup by Product (in Million US$), 2023-2028
  • Table 3: Global: Drug Device Combination Products Market Forecast: Breakup by Application (in Million US$), 2023-2028
  • Table 4: Global: Drug Device Combination Products Market Forecast: Breakup by End User (in Million US$), 2023-2028
  • Table 5: Global: Drug Device Combination Products Market Forecast: Breakup by Region (in Million US$), 2023-2028
  • Table 6: Global: Drug Device Combination Products Market: Competitive Structure
  • Table 7: Global: Drug Device Combination Products Market: Key Players
目次
Product Code: SR112023A4751

Abstract

The global drug device combination products market size reached US$ 143.6 Billion in 2022. Looking forward, IMARC Group expects the market to reach US$ 230.4 Billion by 2028, exhibiting a growth rate (CAGR) of 8.20% during 2022-2028.

Drug device combination products comprise medical devices and pharmaceutical ingredients, which assist in delivering the drug to a specific location in the patient's body. They include vaccine vials packaged with a delivery device, surgical trays with drapes and anesthetic swabs, and prefilled drug delivery systems like syringes, insulin injector pens, and metered dose inhalers. Some of the commonly available drug device combination products are monoclonal antibody combined with a therapeutic drug, pacing lead with steroid-coated tip, and catheter with an antimicrobial coating, and first-aid kits containing bandages and gauze are some.

Drug Device Combination Products Market Trends:

The growing prevalence of chronic diseases and the escalating demand for new approaches in treating diseases are among the key factors driving the adoption of drug device combination products across the globe. These products help patients suffering from cancer, heart disease, multiple sclerosis, cerebral palsy, spinal cord injuries, anemia, hepatitis, rheumatoid arthritis, diabetes, and other serious conditions. Moreover, these products offer advantages, such as minimal side effects, controlled drug administration, improved patient compliance, and targeted drug delivery. This, coupled with increasing preferences for smart and precision drug delivery systems that reduce the amount of drug required for therapeutic efficacy, is contributing to the market growth. Apart from this, market players are incorporating technologies into drug device combination products for tracking and monitoring purposes. They are also introducing sophisticated products made using complex active ingredients, formulations, routes of delivery, and dosage forms, such as peptides, liposomes, and transdermal. Additionally, they are focusing on developing next-generation products with high viscosity, formulations, and new classes of biologics. As a result, the demand for these products is anticipated to rise for providing patients treatments and solutions that can better adhere to their therapy.

Key Market Segmentation:

IMARC Group provides an analysis of the key trends in each sub-segment of the global drug device combination products market report, along with forecasts at the global, regional and country level from 2023-2028. Our report has categorized the market based on product, application and end user.

Breakup by Product:

Drug Eluting Stents

Transdermal Patches

Infusion Pumps

Drug Eluting Balloon

Inhalers

Others

Breakup by Application:

Cardiovascular

Diabetes

Cancer Treatment

Respiratory Diseases

Others

Breakup by End User:

Hospitals

Ambulatory Surgical Centers

Others

Breakup by Region:

North America

United States

Canada

Asia-Pacific

China

Japan

India

South Korea

Australia

Indonesia

Others

Europe

Germany

France

United Kingdom

Italy

Spain

Russia

Others

Latin America

Brazil

Mexico

Others

Middle East and Africa

Competitive Landscape:

The competitive landscape of the industry has also been examined along with the profiles of the key players being Abbott Laboratories, Baxter International Inc., Bayer AG, Becton Dickinson and Company, Boston Scientific Corporation, GlaxoSmithKline plc, Johnson & Johnson, Medtronic plc, Novartis AG, Smith & Nephew plc, Stryker Corporation and Terumo Corporation.

Key Questions Answered in This Report:

  • How has the global drug device combination products market performed so far and how will it perform in the coming years?
  • What has been the impact of COVID-19 on the global drug device combination products market?
  • What are the key regional markets?
  • What is the breakup of the market based on the product?
  • What is the breakup of the market based on the application?
  • What is the breakup of the market based on the end user?
  • What are the various stages in the value chain of the industry?
  • What are the key driving factors and challenges in the industry?
  • What is the structure of the global drug device combination products market and who are the key players?
  • What is the degree of competition in the industry?

Table of Contents

1 Preface

2 Scope and Methodology

  • 2.1 Objectives of the Study
  • 2.2 Stakeholders
  • 2.3 Data Sources
    • 2.3.1 Primary Sources
    • 2.3.2 Secondary Sources
  • 2.4 Market Estimation
    • 2.4.1 Bottom-Up Approach
    • 2.4.2 Top-Down Approach
  • 2.5 Forecasting Methodology

3 Executive Summary

4 Introduction

  • 4.1 Overview
  • 4.2 Key Industry Trends

5 Global Drug Device Combination Products Market

  • 5.1 Market Overview
  • 5.2 Market Performance
  • 5.3 Impact of COVID-19
  • 5.4 Market Forecast

6 Market Breakup by Product

  • 6.1 Drug Eluting Stents
    • 6.1.1 Market Trends
    • 6.1.2 Market Forecast
  • 6.2 Transdermal Patches
    • 6.2.1 Market Trends
    • 6.2.2 Market Forecast
  • 6.3 Infusion Pumps
    • 6.3.1 Market Trends
    • 6.3.2 Market Forecast
  • 6.4 Drug Eluting Balloon
    • 6.4.1 Market Trends
    • 6.4.2 Market Forecast
  • 6.5 Inhalers
    • 6.5.1 Market Trends
    • 6.5.2 Market Forecast
  • 6.6 Others
    • 6.6.1 Market Trends
    • 6.6.2 Market Forecast

7 Market Breakup by Application

  • 7.1 Cardiovascular
    • 7.1.1 Market Trends
    • 7.1.2 Market Forecast
  • 7.2 Diabetes
    • 7.2.1 Market Trends
    • 7.2.2 Market Forecast
  • 7.3 Cancer Treatment
    • 7.3.1 Market Trends
    • 7.3.2 Market Forecast
  • 7.4 Respiratory Diseases
    • 7.4.1 Market Trends
    • 7.4.2 Market Forecast
  • 7.5 Others
    • 7.5.1 Market Trends
    • 7.5.2 Market Forecast

8 Market Breakup by End User

  • 8.1 Hospitals
    • 8.1.1 Market Trends
    • 8.1.2 Market Forecast
  • 8.2 Ambulatory Surgical Centers
    • 8.2.1 Market Trends
    • 8.2.2 Market Forecast
  • 8.3 Others
    • 8.3.1 Market Trends
    • 8.3.2 Market Forecast

9 Market Breakup by Region

  • 9.1 North America
    • 9.1.1 United States
      • 9.1.1.1 Market Trends
      • 9.1.1.2 Market Forecast
    • 9.1.2 Canada
      • 9.1.2.1 Market Trends
      • 9.1.2.2 Market Forecast
  • 9.2 Asia-Pacific
    • 9.2.1 China
      • 9.2.1.1 Market Trends
      • 9.2.1.2 Market Forecast
    • 9.2.2 Japan
      • 9.2.2.1 Market Trends
      • 9.2.2.2 Market Forecast
    • 9.2.3 India
      • 9.2.3.1 Market Trends
      • 9.2.3.2 Market Forecast
    • 9.2.4 South Korea
      • 9.2.4.1 Market Trends
      • 9.2.4.2 Market Forecast
    • 9.2.5 Australia
      • 9.2.5.1 Market Trends
      • 9.2.5.2 Market Forecast
    • 9.2.6 Indonesia
      • 9.2.6.1 Market Trends
      • 9.2.6.2 Market Forecast
    • 9.2.7 Others
      • 9.2.7.1 Market Trends
      • 9.2.7.2 Market Forecast
  • 9.3 Europe
    • 9.3.1 Germany
      • 9.3.1.1 Market Trends
      • 9.3.1.2 Market Forecast
    • 9.3.2 France
      • 9.3.2.1 Market Trends
      • 9.3.2.2 Market Forecast
    • 9.3.3 United Kingdom
      • 9.3.3.1 Market Trends
      • 9.3.3.2 Market Forecast
    • 9.3.4 Italy
      • 9.3.4.1 Market Trends
      • 9.3.4.2 Market Forecast
    • 9.3.5 Spain
      • 9.3.5.1 Market Trends
      • 9.3.5.2 Market Forecast
    • 9.3.6 Russia
      • 9.3.6.1 Market Trends
      • 9.3.6.2 Market Forecast
    • 9.3.7 Others
      • 9.3.7.1 Market Trends
      • 9.3.7.2 Market Forecast
  • 9.4 Latin America
    • 9.4.1 Brazil
      • 9.4.1.1 Market Trends
      • 9.4.1.2 Market Forecast
    • 9.4.2 Mexico
      • 9.4.2.1 Market Trends
      • 9.4.2.2 Market Forecast
    • 9.4.3 Others
      • 9.4.3.1 Market Trends
      • 9.4.3.2 Market Forecast
  • 9.5 Middle East and Africa
    • 9.5.1 Market Trends
    • 9.5.2 Market Breakup by Country
    • 9.5.3 Market Forecast

10 SWOT Analysis

  • 10.1 Overview
  • 10.2 Strengths
  • 10.3 Weaknesses
  • 10.4 Opportunities
  • 10.5 Threats

11 Value Chain Analysis

12 Porters Five Forces Analysis

  • 12.1 Overview
  • 12.2 Bargaining Power of Buyers
  • 12.3 Bargaining Power of Suppliers
  • 12.4 Degree of Competition
  • 12.5 Threat of New Entrants
  • 12.6 Threat of Substitutes

13 Price Analysis

14 Competitive Landscape

  • 14.1 Market Structure
  • 14.2 Key Players
  • 14.3 Profiles of Key Players
    • 14.3.1 Abbott Laboratories
      • 14.3.1.1 Company Overview
      • 14.3.1.2 Product Portfolio
      • 14.3.1.3 Financials
      • 14.3.1.4 SWOT Analysis
    • 14.3.2 Baxter International Inc.
      • 14.3.2.1 Company Overview
      • 14.3.2.2 Product Portfolio
      • 14.3.2.3 Financials
      • 14.3.2.4 SWOT Analysis
    • 14.3.3 Bayer AG
      • 14.3.3.1 Company Overview
      • 14.3.3.2 Product Portfolio
      • 14.3.3.3 Financials
      • 14.3.3.4 SWOT Analysis
    • 14.3.4 Becton Dickinson and Company
      • 14.3.4.1 Company Overview
      • 14.3.4.2 Product Portfolio
      • 14.3.4.3 Financials
      • 14.3.4.4 SWOT Analysis
    • 14.3.5 Boston Scientific Corporation
      • 14.3.5.1 Company Overview
      • 14.3.5.2 Product Portfolio
      • 14.3.5.3 Financials
      • 14.3.5.4 SWOT Analysis
    • 14.3.6 GlaxoSmithKline plc
      • 14.3.6.1 Company Overview
      • 14.3.6.2 Product Portfolio
      • 14.3.6.3 Financials
      • 14.3.6.4 SWOT Analysis
    • 14.3.7 Johnson & Johnson
      • 14.3.7.1 Company Overview
      • 14.3.7.2 Product Portfolio
      • 14.3.7.3 Financials
      • 14.3.7.4 SWOT Analysis
    • 14.3.8 Medtronic plc
      • 14.3.8.1 Company Overview
      • 14.3.8.2 Product Portfolio
      • 14.3.8.3 Financials
      • 14.3.8.4 SWOT Analysis
    • 14.3.9 Novartis AG
      • 14.3.9.1 Company Overview
      • 14.3.9.2 Product Portfolio
      • 14.3.9.3 Financials
      • 14.3.9.4 SWOT Analysis
    • 14.3.10 Smith & Nephew plc
      • 14.3.10.1 Company Overview
      • 14.3.10.2 Product Portfolio
      • 14.3.10.3 Financials
      • 14.3.10.4 SWOT Analysis
    • 14.3.11 Stryker Corporation
      • 14.3.11.1 Company Overview
      • 14.3.11.2 Product Portfolio
      • 14.3.11.3 Financials
      • 14.3.11.4 SWOT Analysis
    • 14.3.12 Terumo Corporation
      • 14.3.12.1 Company Overview
      • 14.3.12.2 Product Portfolio
      • 14.3.12.3 Financials
      • 14.3.12.4 SWOT Analysis