デフォルト表紙
市場調査レポート
商品コード
1390650

スマートモーター市場:世界の産業動向、シェア、市場規模、成長、機会、2023-2028年予測

Smart Motors Market: Global Industry Trends, Share, Size, Growth, Opportunity and Forecast 2023-2028

出版日: | 発行: IMARC | ページ情報: 英文 142 Pages | 納期: 2~3営業日

● お客様のご希望に応じて、既存データの加工や未掲載情報(例:国別セグメント)の追加などの対応が可能です。  詳細はお問い合わせください。

価格
価格表記: USDを日本円(税抜)に換算
本日の銀行送金レート: 1USD=157.14円
スマートモーター市場:世界の産業動向、シェア、市場規模、成長、機会、2023-2028年予測
出版日: 2023年11月24日
発行: IMARC
ページ情報: 英文 142 Pages
納期: 2~3営業日
  • 全表示
  • 概要
  • 図表
  • 目次
概要

概要

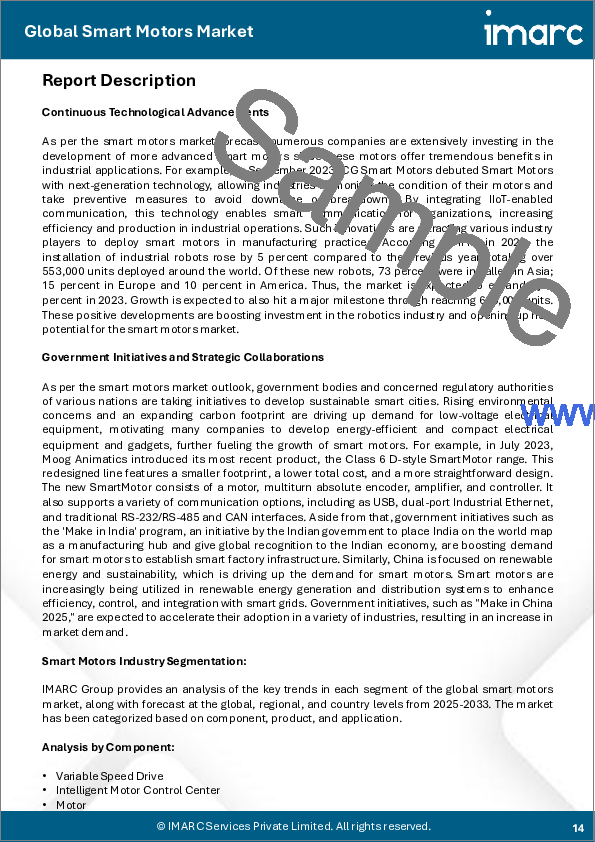
世界のスマートモーター市場規模は2022年に27億米ドルに達しました。今後、IMARC Groupは、市場は2028年までに38億米ドルに達し、2022~2028年の成長率(CAGR)は5.86%になると予測しています。

スマートモーターは、速度とトルクを調整できるプログラム可能な電子機器です。モーターは周波数と電圧供給を変更し、複数の設定ポイントを持つ熱過負荷リレーに取って代わる。エンコーダー、アンプ、電流モニター、デュアル・イーサーネット・ポート、ユニバーサル・シリアル・バス(USB)インターフェースで構成されます。マイクロコントローラーがシャフトの負荷を検出し、それに対応して負荷への電力抽出を調整します。従来から使用されているモーターと比較して、スマートモーターはエネルギー効率が高く、熱損失とダウンタイムが最小限に抑えられ、内部冷却の制御が強化されています。また、連結されたシャフトの直線運動や回転運動のための補助部品の要件も最小限に抑えることができます。その結果、スマート・モーターは、製造、ヘルスケア、自動車、エネルギー、電力など、さまざまな産業で幅広い用途を見出しています。

スマートモーター市場の動向:

産業オートメーション、ロボット工学、効率的なマテリアルハンドリングソリューションに対する要求の高まりは、市場の成長を促進する主な要因の1つです。スマートモータは、ポンプ、コンプレッサ、コンベアシステム、コントローラにおける複雑な操作、予知保全、高度なプロセス制御の実行に広く使用されています。さらに、ハイブリッド車や電気自動車(H/EV)にスマートモーターが広く採用されていることも、市場の成長を後押ししています。コネクテッドデバイスと産業用モノのインターネット(IIoT)の統合や人工知能ソリューションなど、さまざまな技術の進歩も成長を促す要因となっています。これらの技術は、スマートフォンを通じてモーターを監視し、それによって全体的な効率を向上させ、動作不良を予測し、早期故障を最小限に抑えるのに役立ちます。その他、特に新興経済諸国における急速な工業化、石油・ガス採掘現場における非破壊検査やパイプライン検査のためのスマートモータの利用増加などが、市場の成長を促進すると予想されます。

本レポートで扱う主な質問

  • スマートモータの世界市場はこれまでどのように推移し、今後数年間はどのように推移するのか?
  • COVID-19が世界のスマートモーター市場に与えた影響は?
  • 主要な地域市場は?
  • コンポーネント別の市場内訳は?
  • 製品別の市場内訳は?
  • 用途別の市場内訳は?
  • 業界のバリューチェーンにおける様々な段階とは?
  • 業界の主要な促進要因と課題は何か?
  • 世界のスマートモーター市場の構造と主要プレーヤーは?
  • 業界の競合の程度は?

目次

第1章 序文

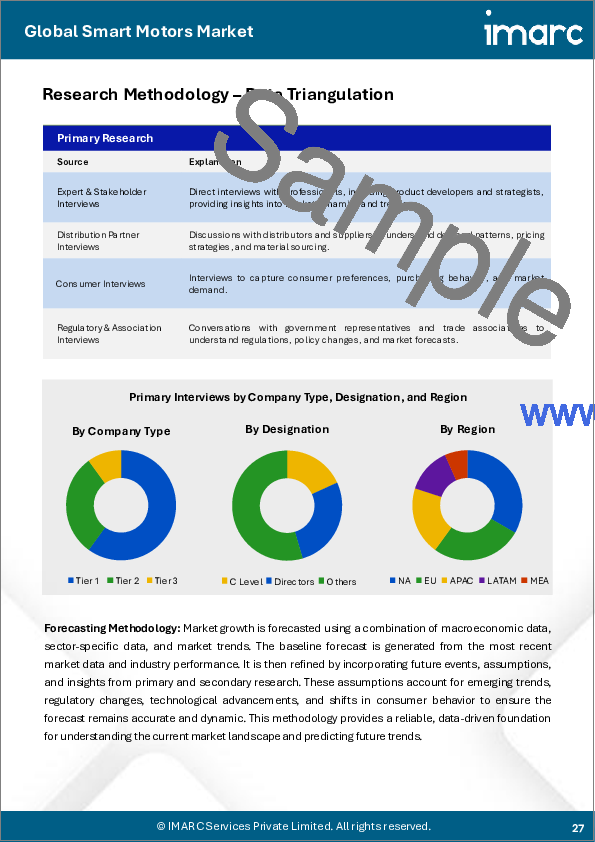
第2章 調査範囲と調査手法

  • 調査目的
  • 利害関係者
  • データソース
    • 一次情報
    • 二次情報
  • 市場推定
    • ボトムアップアプローチ
    • トップダウンアプローチ
  • 調査手法

第3章 エグゼクティブサマリー

第4章 イントロダクション

  • 概要
  • 主要産業動向

第5章 スマートモーターの世界市場

  • 市場概要
  • 市場実績
  • COVID-19の影響
  • 市場予測

第6章 市場内訳:コンポーネント別

  • 可変速ドライブ
    • 市場動向
    • 市場展望
  • インテリジェントモーターコントロールセンター
    • 市場動向
    • 市場予測
  • モーター
    • 市場動向
    • 市場予測

第7章 市場内訳:製品別

  • 24V
    • 市場動向
    • 市場予測
  • 18V
    • 市場動向
    • 市場予測
  • 36V
    • 市場動向
    • 市場予測
  • 48.24V
    • 市場動向
    • 市場予測

第8章 市場内訳:用途別

  • 自動車
    • 市場動向
    • 市場予測
  • 航空宇宙・防衛
    • 市場動向
    • 市場予測
  • 石油・ガス
    • 市場動向
    • 市場予測
  • 金属と鉱業
    • 市場動向
    • 市場予測
  • 水処理と廃水処理
    • 市場動向
    • 市場予測
  • その他
    • 市場動向
    • 市場予測

第9章 市場内訳:地域別

  • 北米
    • 米国
      • 市場動向
      • 市場予測
    • カナダ
      • 市場動向
      • 市場予測
  • アジア太平洋
    • 中国
      • 市場動向
      • 市場予測
    • 日本
      • 市場動向
      • 市場予測
    • インド
      • 市場動向
      • 市場予測
    • 韓国
      • 市場動向
      • 市場予測
    • オーストラリア
      • 市場動向
      • 市場予測
    • インドネシア
      • 市場動向
      • 市場予測
    • その他
      • 市場動向
      • 市場予測
  • 欧州
    • ドイツ
      • 市場動向
      • 市場予測
    • フランス
      • 市場動向
      • 市場予測
    • 英国
      • 市場動向
      • 市場予測
    • イタリア
      • 市場動向
      • 市場予測
    • スペイン
      • 市場動向
      • 市場予測
    • ロシア
      • 市場動向
      • 市場予測
    • その他
      • 市場動向
      • 市場予測
  • ラテンアメリカ
    • ブラジル
      • 市場動向
      • 市場予測
    • メキシコ
      • 市場動向
      • 市場予測
    • その他
      • 市場動向
      • 市場予測
  • 中東・アフリカ地域
    • 市場動向
    • 市場内訳:国別
    • 市場予測

第10章 SWOT分析

  • 概要
  • 強み
  • 弱み
  • 機会
  • 脅威

第11章 バリューチェーン分析

第12章 ポーターのファイブフォース分析

  • 概要
  • 買い手の交渉力
  • 供給企業の交渉力
  • 競合の程度
  • 新規参入業者の脅威
  • 代替品の脅威

第13章 価格分析

第14章 競合情勢

  • 市場構造
  • 主要企業
  • 主要企業のプロファイル
    • ABB Ltd
    • Dunkermotoren GmbH(AMETEK Inc.)
    • Fuji Electric Co. Ltd.(Furukawa Co. Ltd.)
    • General Electric Company
    • Moog Inc.
    • Nidec Corporation
    • RobotShop Inc.
    • Rockwell Automation Inc.
    • Schneider Electric SE
    • Siemens AG
    • Technosoft SA
図表

List of Figures

  • Figure 1: Global: Smart Motors Market: Major Drivers and Challenges
  • Figure 2: Global: Smart Motors Market: Sales Value (in Billion US$), 2017-2022
  • Figure 3: Global: Smart Motors Market Forecast: Sales Value (in Billion US$), 2023-2028
  • Figure 4: Global: Smart Motors Market: Breakup by Component (in %), 2022
  • Figure 5: Global: Smart Motors Market: Breakup by Product (in %), 2022
  • Figure 6: Global: Smart Motors Market: Breakup by Application (in %), 2022
  • Figure 7: Global: Smart Motors Market: Breakup by Region (in %), 2022
  • Figure 8: Global: Smart Motors (Variable Speed Drive) Market: Sales Value (in Million US$), 2017 & 2022
  • Figure 9: Global: Smart Motors (Variable Speed Drive) Market Forecast: Sales Value (in Million US$), 2023-2028
  • Figure 10: Global: Smart Motors (Intelligent Motor Control Center) Market: Sales Value (in Million US$), 2017 & 2022
  • Figure 11: Global: Smart Motors (Intelligent Motor Control Center) Market Forecast: Sales Value (in Million US$), 2023-2028
  • Figure 12: Global: Smart Motors (Motor) Market: Sales Value (in Million US$), 2017 & 2022
  • Figure 13: Global: Smart Motors (Motor) Market Forecast: Sales Value (in Million US$), 2023-2028
  • Figure 14: Global: Smart Motors (24V) Market: Sales Value (in Million US$), 2017 & 2022
  • Figure 15: Global: Smart Motors (24V) Market Forecast: Sales Value (in Million US$), 2023-2028
  • Figure 16: Global: Smart Motors (18V) Market: Sales Value (in Million US$), 2017 & 2022
  • Figure 17: Global: Smart Motors (18V) Market Forecast: Sales Value (in Million US$), 2023-2028
  • Figure 18: Global: Smart Motors (36V) Market: Sales Value (in Million US$), 2017 & 2022
  • Figure 19: Global: Smart Motors (36V) Market Forecast: Sales Value (in Million US$), 2023-2028
  • Figure 20: Global: Smart Motors (48.24V) Market: Sales Value (in Million US$), 2017 & 2022
  • Figure 21: Global: Smart Motors (48.24V) Market Forecast: Sales Value (in Million US$), 2023-2028
  • Figure 22: Global: Smart Motors (Automotive) Market: Sales Value (in Million US$), 2017 & 2022
  • Figure 23: Global: Smart Motors (Automotive) Market Forecast: Sales Value (in Million US$), 2023-2028
  • Figure 24: Global: Smart Motors (Aerospace and Defense) Market: Sales Value (in Million US$), 2017 & 2022
  • Figure 25: Global: Smart Motors (Aerospace and Defense) Market Forecast: Sales Value (in Million US$), 2023-2028
  • Figure 26: Global: Smart Motors (Oil and Gas) Market: Sales Value (in Million US$), 2017 & 2022
  • Figure 27: Global: Smart Motors (Oil and Gas) Market Forecast: Sales Value (in Million US$), 2023-2028
  • Figure 28: Global: Smart Motors (Metal and Mining) Market: Sales Value (in Million US$), 2017 & 2022
  • Figure 29: Global: Smart Motors (Metal and Mining) Market Forecast: Sales Value (in Million US$), 2023-2028
  • Figure 30: Global: Smart Motors (Water and Wastewater Treatment) Market: Sales Value (in Million US$), 2017 & 2022
  • Figure 31: Global: Smart Motors (Water and Wastewater Treatment) Market Forecast: Sales Value (in Million US$), 2023-2028
  • Figure 32: Global: Smart Motors (Other Applications) Market: Sales Value (in Million US$), 2017 & 2022
  • Figure 33: Global: Smart Motors (Other Applications) Market Forecast: Sales Value (in Million US$), 2023-2028
  • Figure 34: North America: Smart Motors Market: Sales Value (in Million US$), 2017 & 2022
  • Figure 35: North America: Smart Motors Market Forecast: Sales Value (in Million US$), 2023-2028
  • Figure 36: United States: Smart Motors Market: Sales Value (in Million US$), 2017 & 2022
  • Figure 37: United States: Smart Motors Market Forecast: Sales Value (in Million US$), 2023-2028
  • Figure 38: Canada: Smart Motors Market: Sales Value (in Million US$), 2017 & 2022
  • Figure 39: Canada: Smart Motors Market Forecast: Sales Value (in Million US$), 2023-2028
  • Figure 40: Asia-Pacific: Smart Motors Market: Sales Value (in Million US$), 2017 & 2022
  • Figure 41: Asia-Pacific: Smart Motors Market Forecast: Sales Value (in Million US$), 2023-2028
  • Figure 42: China: Smart Motors Market: Sales Value (in Million US$), 2017 & 2022
  • Figure 43: China: Smart Motors Market Forecast: Sales Value (in Million US$), 2023-2028
  • Figure 44: Japan: Smart Motors Market: Sales Value (in Million US$), 2017 & 2022
  • Figure 45: Japan: Smart Motors Market Forecast: Sales Value (in Million US$), 2023-2028
  • Figure 46: India: Smart Motors Market: Sales Value (in Million US$), 2017 & 2022
  • Figure 47: India: Smart Motors Market Forecast: Sales Value (in Million US$), 2023-2028
  • Figure 48: South Korea: Smart Motors Market: Sales Value (in Million US$), 2017 & 2022
  • Figure 49: South Korea: Smart Motors Market Forecast: Sales Value (in Million US$), 2023-2028
  • Figure 50: Australia: Smart Motors Market: Sales Value (in Million US$), 2017 & 2022
  • Figure 51: Australia: Smart Motors Market Forecast: Sales Value (in Million US$), 2023-2028
  • Figure 52: Indonesia: Smart Motors Market: Sales Value (in Million US$), 2017 & 2022
  • Figure 53: Indonesia: Smart Motors Market Forecast: Sales Value (in Million US$), 2023-2028
  • Figure 54: Others: Smart Motors Market: Sales Value (in Million US$), 2017 & 2022
  • Figure 55: Others: Smart Motors Market Forecast: Sales Value (in Million US$), 2023-2028
  • Figure 56: Europe: Smart Motors Market: Sales Value (in Million US$), 2017 & 2022
  • Figure 57: Europe: Smart Motors Market Forecast: Sales Value (in Million US$), 2023-2028
  • Figure 58: Germany: Smart Motors Market: Sales Value (in Million US$), 2017 & 2022
  • Figure 59: Germany: Smart Motors Market Forecast: Sales Value (in Million US$), 2023-2028
  • Figure 60: France: Smart Motors Market: Sales Value (in Million US$), 2017 & 2022
  • Figure 61: France: Smart Motors Market Forecast: Sales Value (in Million US$), 2023-2028
  • Figure 62: United Kingdom: Smart Motors Market: Sales Value (in Million US$), 2017 & 2022
  • Figure 63: United Kingdom: Smart Motors Market Forecast: Sales Value (in Million US$), 2023-2028
  • Figure 64: Italy: Smart Motors Market: Sales Value (in Million US$), 2017 & 2022
  • Figure 65: Italy: Smart Motors Market Forecast: Sales Value (in Million US$), 2023-2028
  • Figure 66: Spain: Smart Motors Market: Sales Value (in Million US$), 2017 & 2022
  • Figure 67: Spain: Smart Motors Market Forecast: Sales Value (in Million US$), 2023-2028
  • Figure 68: Russia: Smart Motors Market: Sales Value (in Million US$), 2017 & 2022
  • Figure 69: Russia: Smart Motors Market Forecast: Sales Value (in Million US$), 2023-2028
  • Figure 70: Others: Smart Motors Market: Sales Value (in Million US$), 2017 & 2022
  • Figure 71: Others: Smart Motors Market Forecast: Sales Value (in Million US$), 2023-2028
  • Figure 72: Latin America: Smart Motors Market: Sales Value (in Million US$), 2017 & 2022
  • Figure 73: Latin America: Smart Motors Market Forecast: Sales Value (in Million US$), 2023-2028
  • Figure 74: Brazil: Smart Motors Market: Sales Value (in Million US$), 2017 & 2022
  • Figure 75: Brazil: Smart Motors Market Forecast: Sales Value (in Million US$), 2023-2028
  • Figure 76: Mexico: Smart Motors Market: Sales Value (in Million US$), 2017 & 2022
  • Figure 77: Mexico: Smart Motors Market Forecast: Sales Value (in Million US$), 2023-2028
  • Figure 78: Others: Smart Motors Market: Sales Value (in Million US$), 2017 & 2022
  • Figure 79: Others: Smart Motors Market Forecast: Sales Value (in Million US$), 2023-2028
  • Figure 80: Middle East and Africa: Smart Motors Market: Sales Value (in Million US$), 2017 & 2022
  • Figure 81: Middle East and Africa: Smart Motors Market: Breakup by Country (in %), 2022
  • Figure 82: Middle East and Africa: Smart Motors Market Forecast: Sales Value (in Million US$), 2023-2028
  • Figure 83: Global: Smart Motors Industry: SWOT Analysis
  • Figure 84: Global: Smart Motors Industry: Value Chain Analysis
  • Figure 85: Global: Smart Motors Industry: Porter's Five Forces Analysis

List of Tables

  • Table 1: Global: Smart Motors Market: Key Industry Highlights, 2022 and 2028
  • Table 2: Global: Smart Motors Market Forecast: Breakup by Component (in Million US$), 2023-2028
  • Table 3: Global: Smart Motors Market Forecast: Breakup by Product (in Million US$), 2023-2028
  • Table 4: Global: Smart Motors Market Forecast: Breakup by Application (in Million US$), 2023-2028
  • Table 5: Global: Smart Motors Market Forecast: Breakup by Region (in Million US$), 2023-2028
  • Table 6: Global: Smart Motors Market: Competitive Structure
  • Table 7: Global: Smart Motors Market: Key Players
目次
Product Code: SR112023A4467

Abstract

The global smart motors market size reached US$ 2.7 Billion in 2022. Looking forward, IMARC Group expects the market to reach US$ 3.8 Billion by 2028, exhibiting a growth rate (CAGR) of 5.86% during 2022-2028.

A smart motor is a programmable electronic device with adjustable speed and torque. The motor alters the frequency and supply of voltage to replace the thermal overload relay with multiple set points. It consists of an encoder, amplifier, current monitor, dual ethernet port and universal serial bus (USB) interface. The microcontroller detects the load on the shaft and correspondingly adjusts the power extraction to the load. In comparison to the traditionally used motors, smart motors are more energy-efficient, have minimal heat loss and downtime and provide enhanced control over internal cooling. They also minimize the requirement for ancillary components for linear or rotary motion in the connected shafts. As a result, smart motors find extensive applications across various industries, including manufacturing, healthcare, automotive, energy and power.

Smart Motors Market Trends:

The increasing requirement for industrial automation, robotics and efficient material handling solutions is one of the key factors driving the growth of the market. Smart motors are widely used for performing complex operations, predictive maintenance and advanced process control in pumps, compressors, conveyor systems and controllers. Moreover, the widespread adoption of smart motors in hybrid and electronic vehicles (H/EV) is providing a thrust to the market growth. Various technological advancements, such as the integration of connected devices with the Industrial Internet of Things (IIoT) and artificial intelligence solutions, are acting as other growth-inducing factors. These technologies aid in monitoring the motors through smartphones, thereby improving the overall efficiency, predicting operational failures and minimizing premature breakdowns. Other factors, including rapid industrialization, especially in the developing economies, along with the increasing utilization of smart motors for non-destructive testing and pipeline inspection in oil and gas extraction sites, are anticipated to drive the market toward growth.

Key Market Segmentation:

IMARC Group provides an analysis of the key trends in each sub-segment of the global smart motors market report, along with forecasts at the global, regional and country level from 2023-2028. Our report has categorized the market based on component, product and application.

Breakup by Component:

Variable Speed Drive

Intelligent Motor Control Center

Motor

Breakup by Product:

24V

18V

36V

48.24V

Breakup by Application:

Automotive

Aerospace and Defense

Oil and Gas

Metal and Mining

Water and Wastewater Treatment

Others

Breakup by Region:

North America

United States

Canada

Asia-Pacific

China

Japan

India

South Korea

Australia

Indonesia

Others

Europe

Germany

France

United Kingdom

Italy

Spain

Russia

Others

Latin America

Brazil

Mexico

Others

Middle East and Africa

Competitive Landscape:

The competitive landscape of the industry has also been examined along with the profiles of the key players being ABB Ltd, Dunkermotoren GmbH (AMETEK Inc.), Fuji Electric Co. Ltd. (Furukawa Co. Ltd.), General Electric Company, Moog Inc., Nidec Corporation, RobotShop Inc., Rockwell Automation Inc., Schneider Electric SE, Siemens AG and Technosoft SA.

Key Questions Answered in This Report:

  • How has the global smart motors market performed so far and how will it perform in the coming years?
  • What has been the impact of COVID-19 on the global smart motors market?
  • What are the key regional markets?
  • What is the breakup of the market based on the component?
  • What is the breakup of the market based on the product?
  • What is the breakup of the market based on the application?
  • What are the various stages in the value chain of the industry?
  • What are the key driving factors and challenges in the industry?
  • What is the structure of the global smart motors market and who are the key players?
  • What is the degree of competition in the industry?

Table of Contents

1 Preface

2 Scope and Methodology

  • 2.1 Objectives of the Study
  • 2.2 Stakeholders
  • 2.3 Data Sources
    • 2.3.1 Primary Sources
    • 2.3.2 Secondary Sources
  • 2.4 Market Estimation
    • 2.4.1 Bottom-Up Approach
    • 2.4.2 Top-Down Approach
  • 2.5 Forecasting Methodology

3 Executive Summary

4 Introduction

  • 4.1 Overview
  • 4.2 Key Industry Trends

5 Global Smart Motors Market

  • 5.1 Market Overview
  • 5.2 Market Performance
  • 5.3 Impact of COVID-19
  • 5.4 Market Forecast

6 Market Breakup by Component

  • 6.1 Variable Speed Drive
    • 6.1.1 Market Trends
    • 6.1.2 Market Forecast
  • 6.2 Intelligent Motor Control Center
    • 6.2.1 Market Trends
    • 6.2.2 Market Forecast
  • 6.3 Motor
    • 6.3.1 Market Trends
    • 6.3.2 Market Forecast

7 Market Breakup by Product

  • 7.1 24V
    • 7.1.1 Market Trends
    • 7.1.2 Market Forecast
  • 7.2 18V
    • 7.2.1 Market Trends
    • 7.2.2 Market Forecast
  • 7.3 36V
    • 7.3.1 Market Trends
    • 7.3.2 Market Forecast
  • 7.4 48.24V
    • 7.4.1 Market Trends
    • 7.4.2 Market Forecast

8 Market Breakup by Application

  • 8.1 Automotive
    • 8.1.1 Market Trends
    • 8.1.2 Market Forecast
  • 8.2 Aerospace and Defense
    • 8.2.1 Market Trends
    • 8.2.2 Market Forecast
  • 8.3 Oil and Gas
    • 8.3.1 Market Trends
    • 8.3.2 Market Forecast
  • 8.4 Metal and Mining
    • 8.4.1 Market Trends
    • 8.4.2 Market Forecast
  • 8.5 Water and Wastewater Treatment
    • 8.5.1 Market Trends
    • 8.5.2 Market Forecast
  • 8.6 Others
    • 8.6.1 Market Trends
    • 8.6.2 Market Forecast

9 Market Breakup by Region

  • 9.1 North America
    • 9.1.1 United States
      • 9.1.1.1 Market Trends
      • 9.1.1.2 Market Forecast
    • 9.1.2 Canada
      • 9.1.2.1 Market Trends
      • 9.1.2.2 Market Forecast
  • 9.2 Asia-Pacific
    • 9.2.1 China
      • 9.2.1.1 Market Trends
      • 9.2.1.2 Market Forecast
    • 9.2.2 Japan
      • 9.2.2.1 Market Trends
      • 9.2.2.2 Market Forecast
    • 9.2.3 India
      • 9.2.3.1 Market Trends
      • 9.2.3.2 Market Forecast
    • 9.2.4 South Korea
      • 9.2.4.1 Market Trends
      • 9.2.4.2 Market Forecast
    • 9.2.5 Australia
      • 9.2.5.1 Market Trends
      • 9.2.5.2 Market Forecast
    • 9.2.6 Indonesia
      • 9.2.6.1 Market Trends
      • 9.2.6.2 Market Forecast
    • 9.2.7 Others
      • 9.2.7.1 Market Trends
      • 9.2.7.2 Market Forecast
  • 9.3 Europe
    • 9.3.1 Germany
      • 9.3.1.1 Market Trends
      • 9.3.1.2 Market Forecast
    • 9.3.2 France
      • 9.3.2.1 Market Trends
      • 9.3.2.2 Market Forecast
    • 9.3.3 United Kingdom
      • 9.3.3.1 Market Trends
      • 9.3.3.2 Market Forecast
    • 9.3.4 Italy
      • 9.3.4.1 Market Trends
      • 9.3.4.2 Market Forecast
    • 9.3.5 Spain
      • 9.3.5.1 Market Trends
      • 9.3.5.2 Market Forecast
    • 9.3.6 Russia
      • 9.3.6.1 Market Trends
      • 9.3.6.2 Market Forecast
    • 9.3.7 Others
      • 9.3.7.1 Market Trends
      • 9.3.7.2 Market Forecast
  • 9.4 Latin America
    • 9.4.1 Brazil
      • 9.4.1.1 Market Trends
      • 9.4.1.2 Market Forecast
    • 9.4.2 Mexico
      • 9.4.2.1 Market Trends
      • 9.4.2.2 Market Forecast
    • 9.4.3 Others
      • 9.4.3.1 Market Trends
      • 9.4.3.2 Market Forecast
  • 9.5 Middle East and Africa
    • 9.5.1 Market Trends
    • 9.5.2 Market Breakup by Country
    • 9.5.3 Market Forecast

10 SWOT Analysis

  • 10.1 Overview
  • 10.2 Strengths
  • 10.3 Weaknesses
  • 10.4 Opportunities
  • 10.5 Threats

11 Value Chain Analysis

12 Porters Five Forces Analysis

  • 12.1 Overview
  • 12.2 Bargaining Power of Buyers
  • 12.3 Bargaining Power of Suppliers
  • 12.4 Degree of Competition
  • 12.5 Threat of New Entrants
  • 12.6 Threat of Substitutes

13 Price Analysis

14 Competitive Landscape

  • 14.1 Market Structure
  • 14.2 Key Players
  • 14.3 Profiles of Key Players
    • 14.3.1 ABB Ltd
      • 14.3.1.1 Company Overview
      • 14.3.1.2 Product Portfolio
      • 14.3.1.3 Financials
      • 14.3.1.4 SWOT Analysis
    • 14.3.2 Dunkermotoren GmbH (AMETEK Inc.)
      • 14.3.2.1 Company Overview
      • 14.3.2.2 Product Portfolio
    • 14.3.3 Fuji Electric Co. Ltd. (Furukawa Co. Ltd.)
      • 14.3.3.1 Company Overview
      • 14.3.3.2 Product Portfolio
      • 14.3.3.3 Financials
      • 14.3.3.4 SWOT Analysis
    • 14.3.4 General Electric Company
      • 14.3.4.1 Company Overview
      • 14.3.4.2 Product Portfolio
      • 14.3.4.3 Financials
      • 14.3.4.4 SWOT Analysis
    • 14.3.5 Moog Inc.
      • 14.3.5.1 Company Overview
      • 14.3.5.2 Product Portfolio
      • 14.3.5.3 Financials
      • 14.3.5.4 SWOT Analysis
    • 14.3.6 Nidec Corporation
      • 14.3.6.1 Company Overview
      • 14.3.6.2 Product Portfolio
      • 14.3.6.3 Financials
      • 14.3.6.4 SWOT Analysis
    • 14.3.7 RobotShop Inc.
      • 14.3.7.1 Company Overview
      • 14.3.7.2 Product Portfolio
    • 14.3.8 Rockwell Automation Inc.
      • 14.3.8.1 Company Overview
      • 14.3.8.2 Product Portfolio
      • 14.3.8.3 Financials
      • 14.3.8.4 SWOT Analysis
    • 14.3.9 Schneider Electric SE
      • 14.3.9.1 Company Overview
      • 14.3.9.2 Product Portfolio
      • 14.3.9.3 Financials
      • 14.3.9.4 SWOT Analysis
    • 14.3.10 Siemens AG
      • 14.3.10.1 Company Overview
      • 14.3.10.2 Product Portfolio
      • 14.3.10.3 Financials
      • 14.3.10.4 SWOT Analysis
    • 14.3.11 Technosoft SA
      • 14.3.11.1 Company Overview
      • 14.3.11.2 Product Portfolio