|
|
市場調査レポート
商品コード
1754008
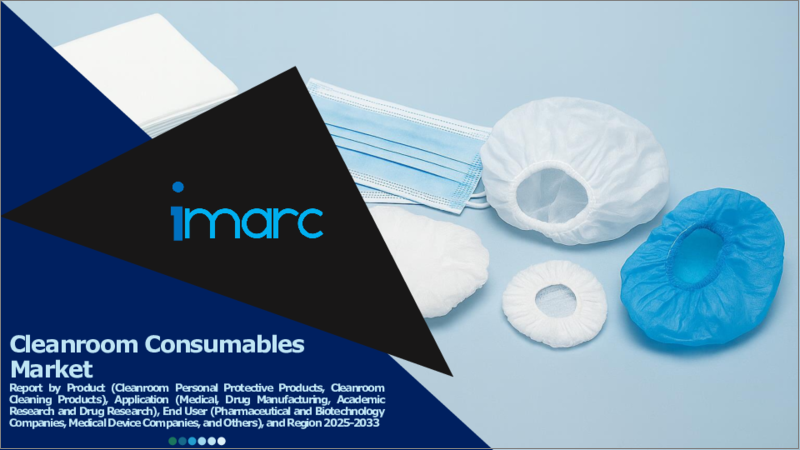
クリーンルーム用消耗品の市場レポート:製品、用途、エンドユーザー、地域別、2025年~2033年Cleanroom Consumables Market Report by Product, Application, End User, and Region 2025-2033 |
||||||
|
|||||||
カスタマイズ可能
|
|||||||


| クリーンルーム用消耗品の市場レポート:製品、用途、エンドユーザー、地域別、2025年~2033年 |
|
出版日: 2025年06月02日
発行: IMARC
ページ情報: 英文 138 Pages
納期: 2~3営業日
|

全表示
- 概要
- 図表
- 目次
世界のクリーンルーム用消耗品市場規模は2024年に46億米ドルに達しました。今後、IMARC Groupは、2033年には67億米ドルに達し、2025年から2033年にかけて4.2%の成長率(CAGR)を示すと予測しています。
クリーンルーム用消耗品は、高品質の原材料を使用し、ほこり、微生物、化学蒸気などの不純物の少ない制御された環境を持つクリーンルームで着用されます。クリーンルームで働く人やその衣服による汚染から製品やプロセスを守ります。また、洗濯可能で再利用でき、軽量で肌にやさしく、防縮加工が施されています。さらに、クリーンルーム用消耗品は様々なお客様のご要望にお応えできるよう、サイズ、生地、カラーをご用意しております。クリーンルーム用消耗品は、世界中の病院、医科大学、研究所、製薬、化学産業で広く使用されています。
クリーンルーム用消耗品の市場動向:
近年、ヘルスケア製品の品質と安全性の向上に対するニーズが、世界中でクリーンルーム用消耗品の需要を刺激する重要な要因の一つとなっています。これに加えて、いくつかの国の政府は、ヘルスケア分野でのクリーンルーム用消耗品の利用に有利な規制を実施しています。これは、滅菌製剤の需要の高まりや医療機器の著しい開発と相まって、市場の開拓を促進しています。さらに、コロナウイルス病(COVID-19)の突然の発生は、ゴーグル、手袋、ガウンなどのクリーンルーム用消耗品の需要を加速させており、これは主要企業に有利な機会を提供しています。これとは別に、主な企業は規制当局の承認、トレーニング、開発、買収、他社との共同契約などに取り組んでいます。また、新製品を投入するための研究開発活動も活発化しており、市場成長の原動力となっています。
本レポートで扱う主な質問
- 世界のクリーンルーム用消耗品市場はこれまでどのように推移し、今後どのように推移していくのか?
- 世界のクリーンルーム用消耗品市場におけるCOVID-19の影響は?
- 主要な地域市場とは?
- 製品別の市場内訳は?
- 用途別の市場内訳は?
- エンドユーザー別の市場内訳は?
- 業界のバリューチェーンにおける様々な段階とは?
- 業界の主要な促進要因と課題は何か?
- 世界のクリーンルーム用消耗品市場の構造と主要企業は?
- 業界における競合の程度は?
目次
第1章 序文
第2章 調査範囲と調査手法
- 調査の目的
- ステークホルダー
- データソース
- 一次情報
- 二次情報
- 市場推定
- ボトムアップアプローチ
- トップダウンアプローチ
- 調査手法
第3章 エグゼクティブサマリー
第4章 イントロダクション
- 概要
- 主要業界動向
第5章 世界のクリーンルーム用消耗品市場
- 市場概要
- 市場実績
- COVID-19の影響
- 市場予測
第6章 市場内訳:製品別
- クリーンルーム用個人用保護具
- 主要セグメント
- 手袋
- カバーオール
- シューズカバー
- フェイスマスク
- その他
- 主要セグメント
- クリーンルーム清掃製品
- 主要セグメント
- ワイプ
- モップ
- 消毒剤
- その他
- 主要セグメント
第7章 市場内訳:用途別
- 医療
- 医薬品製造
- 学術調査と医薬品調査
第8章 市場内訳:エンドユーザー別
- 製薬およびバイオテクノロジー企業
- 医療機器企業
- その他
第9章 市場内訳:地域別
- 北米
- 米国
- カナダ
- アジア太平洋地域
- 中国
- 日本
- インド
- 韓国
- オーストラリア
- インドネシア
- その他
- 欧州
- ドイツ
- フランス
- 英国
- イタリア
- スペイン
- ロシア
- その他
- ラテンアメリカ
- ブラジル
- メキシコ
- その他
- 中東・アフリカ
- 市場内訳:国別
第10章 SWOT分析
- 概要
- 強み
- 弱み
- 機会
- 脅威
第11章 バリューチェーン分析
第12章 ポーターのファイブフォース分析
- 概要
- 買い手の交渉力
- 供給企業の交渉力
- 競合の程度
- 新規参入業者の脅威
- 代替品の脅威
第13章 価格分析
第14章 競合情勢
- 市場構造
- 主要企業
- 主要企業のプロファイル
- Ansell Ltd.
- Berkshire Corporation
- Contec Inc.
- Dupont De Nemours Inc.
- EcoLab Inc.
- ITW Texwipe(Illinois Tool Works Inc.)
- Kimberly-Clark Corporation
- Km Act Corp.
- Micronclean Ltd.
- Micronova Manufacturing Inc.
- Steris Corporation
- Valutek Inc.
List of Figures
- Figure 1: Global: Cleanroom Consumables Market: Major Drivers and Challenges
- Figure 2: Global: Cleanroom Consumables Market: Sales Value (in Billion USD), 2019-2024
- Figure 3: Global: Cleanroom Consumables Market Forecast: Sales Value (in Billion USD), 2025-2033
- Figure 4: Global: Cleanroom Consumables Market: Breakup by Product (in %), 2024
- Figure 5: Global: Cleanroom Consumables Market: Breakup by Application (in %), 2024
- Figure 6: Global: Cleanroom Consumables Market: Breakup by End User (in %), 2024
- Figure 7: Global: Cleanroom Consumables Market: Breakup by Region (in %), 2024
- Figure 8: Global: Cleanroom Consumables (Cleanroom Personal Protective Products) Market: Sales Value (in Million USD), 2019 & 2024
- Figure 9: Global: Cleanroom Consumables (Cleanroom Personal Protective Products) Market Forecast: Sales Value (in Million USD), 2025-2033
- Figure 10: Global: Cleanroom Consumables (Cleanroom Cleaning Products) Market: Sales Value (in Million USD), 2019 & 2024
- Figure 11: Global: Cleanroom Consumables (Cleanroom Cleaning Products) Market Forecast: Sales Value (in Million USD), 2025-2033
- Figure 12: Global: Cleanroom Consumables (Medical) Market: Sales Value (in Million USD), 2019 & 2024
- Figure 13: Global: Cleanroom Consumables (Medical) Market Forecast: Sales Value (in Million USD), 2025-2033
- Figure 14: Global: Cleanroom Consumables (Drug Manufacturing) Market: Sales Value (in Million USD), 2019 & 2024
- Figure 15: Global: Cleanroom Consumables (Drug Manufacturing) Market Forecast: Sales Value (in Million USD), 2025-2033
- Figure 16: Global: Cleanroom Consumables (Academic Research and Drug Research) Market: Sales Value (in Million USD), 2019 & 2024
- Figure 17: Global: Cleanroom Consumables (Academic Research and Drug Research) Market Forecast: Sales Value (in Million USD), 2025-2033
- Figure 18: Global: Cleanroom Consumables (Pharmaceutical and Biotechnology Companies) Market: Sales Value (in Million USD), 2019 & 2024
- Figure 19: Global: Cleanroom Consumables (Pharmaceutical and Biotechnology Companies) Market Forecast: Sales Value (in Million USD), 2025-2033
- Figure 20: Global: Cleanroom Consumables (Medical Device Companies) Market: Sales Value (in Million USD), 2019 & 2024
- Figure 21: Global: Cleanroom Consumables (Medical Device Companies) Market Forecast: Sales Value (in Million USD), 2025-2033
- Figure 22: Global: Cleanroom Consumables (Other End Users) Market: Sales Value (in Million USD), 2019 & 2024
- Figure 23: Global: Cleanroom Consumables (Other End Users) Market Forecast: Sales Value (in Million USD), 2025-2033
- Figure 24: North America: Cleanroom Consumables Market: Sales Value (in Million USD), 2019 & 2024
- Figure 25: North America: Cleanroom Consumables Market Forecast: Sales Value (in Million USD), 2025-2033
- Figure 26: United States: Cleanroom Consumables Market: Sales Value (in Million USD), 2019 & 2024
- Figure 27: United States: Cleanroom Consumables Market Forecast: Sales Value (in Million USD), 2025-2033
- Figure 28: Canada: Cleanroom Consumables Market: Sales Value (in Million USD), 2019 & 2024
- Figure 29: Canada: Cleanroom Consumables Market Forecast: Sales Value (in Million USD), 2025-2033
- Figure 30: Asia-Pacific: Cleanroom Consumables Market: Sales Value (in Million USD), 2019 & 2024
- Figure 31: Asia-Pacific: Cleanroom Consumables Market Forecast: Sales Value (in Million USD), 2025-2033
- Figure 32: China: Cleanroom Consumables Market: Sales Value (in Million USD), 2019 & 2024
- Figure 33: China: Cleanroom Consumables Market Forecast: Sales Value (in Million USD), 2025-2033
- Figure 34: Japan: Cleanroom Consumables Market: Sales Value (in Million USD), 2019 & 2024
- Figure 35: Japan: Cleanroom Consumables Market Forecast: Sales Value (in Million USD), 2025-2033
- Figure 36: India: Cleanroom Consumables Market: Sales Value (in Million USD), 2019 & 2024
- Figure 37: India: Cleanroom Consumables Market Forecast: Sales Value (in Million USD), 2025-2033
- Figure 38: South Korea: Cleanroom Consumables Market: Sales Value (in Million USD), 2019 & 2024
- Figure 39: South Korea: Cleanroom Consumables Market Forecast: Sales Value (in Million USD), 2025-2033
- Figure 40: Australia: Cleanroom Consumables Market: Sales Value (in Million USD), 2019 & 2024
- Figure 41: Australia: Cleanroom Consumables Market Forecast: Sales Value (in Million USD), 2025-2033
- Figure 42: Indonesia: Cleanroom Consumables Market: Sales Value (in Million USD), 2019 & 2024
- Figure 43: Indonesia: Cleanroom Consumables Market Forecast: Sales Value (in Million USD), 2025-2033
- Figure 44: Others: Cleanroom Consumables Market: Sales Value (in Million USD), 2019 & 2024
- Figure 45: Others: Cleanroom Consumables Market Forecast: Sales Value (in Million USD), 2025-2033
- Figure 46: Europe: Cleanroom Consumables Market: Sales Value (in Million USD), 2019 & 2024
- Figure 47: Europe: Cleanroom Consumables Market Forecast: Sales Value (in Million USD), 2025-2033
- Figure 48: Germany: Cleanroom Consumables Market: Sales Value (in Million USD), 2019 & 2024
- Figure 49: Germany: Cleanroom Consumables Market Forecast: Sales Value (in Million USD), 2025-2033
- Figure 50: France: Cleanroom Consumables Market: Sales Value (in Million USD), 2019 & 2024
- Figure 51: France: Cleanroom Consumables Market Forecast: Sales Value (in Million USD), 2025-2033
- Figure 52: United Kingdom: Cleanroom Consumables Market: Sales Value (in Million USD), 2019 & 2024
- Figure 53: United Kingdom: Cleanroom Consumables Market Forecast: Sales Value (in Million USD), 2025-2033
- Figure 54: Italy: Cleanroom Consumables Market: Sales Value (in Million USD), 2019 & 2024
- Figure 55: Italy: Cleanroom Consumables Market Forecast: Sales Value (in Million USD), 2025-2033
- Figure 56: Spain: Cleanroom Consumables Market: Sales Value (in Million USD), 2019 & 2024
- Figure 57: Spain: Cleanroom Consumables Market Forecast: Sales Value (in Million USD), 2025-2033
- Figure 58: Russia: Cleanroom Consumables Market: Sales Value (in Million USD), 2019 & 2024
- Figure 59: Russia: Cleanroom Consumables Market Forecast: Sales Value (in Million USD), 2025-2033
- Figure 60: Others: Cleanroom Consumables Market: Sales Value (in Million USD), 2019 & 2024
- Figure 61: Others: Cleanroom Consumables Market Forecast: Sales Value (in Million USD), 2025-2033
- Figure 62: Latin America: Cleanroom Consumables Market: Sales Value (in Million USD), 2019 & 2024
- Figure 63: Latin America: Cleanroom Consumables Market Forecast: Sales Value (in Million USD), 2025-2033
- Figure 64: Brazil: Cleanroom Consumables Market: Sales Value (in Million USD), 2019 & 2024
- Figure 65: Brazil: Cleanroom Consumables Market Forecast: Sales Value (in Million USD), 2025-2033
- Figure 66: Mexico: Cleanroom Consumables Market: Sales Value (in Million USD), 2019 & 2024
- Figure 67: Mexico: Cleanroom Consumables Market Forecast: Sales Value (in Million USD), 2025-2033
- Figure 68: Others: Cleanroom Consumables Market: Sales Value (in Million USD), 2019 & 2024
- Figure 69: Others: Cleanroom Consumables Market Forecast: Sales Value (in Million USD), 2025-2033
- Figure 70: Middle East and Africa: Cleanroom Consumables Market: Sales Value (in Million USD), 2019 & 2024
- Figure 71: Middle East and Africa: Cleanroom Consumables Market: Breakup by Country (in %), 2024
- Figure 72: Middle East and Africa: Cleanroom Consumables Market Forecast: Sales Value (in Million USD), 2025-2033
- Figure 73: Global: Cleanroom Consumables Industry: SWOT Analysis
- Figure 74: Global: Cleanroom Consumables Industry: Value Chain Analysis
- Figure 75: Global: Cleanroom Consumables Industry: Porter's Five Forces Analysis
List of Tables
- Table 1: Global: Cleanroom Consumables Market: Key Industry Highlights, 2024 and 2033
- Table 2: Global: Cleanroom Consumables Market Forecast: Breakup by Product (in Million USD), 2025-2033
- Table 3: Global: Cleanroom Consumables Market Forecast: Breakup by Application (in Million USD), 2025-2033
- Table 4: Global: Cleanroom Consumables Market Forecast: Breakup by End User (in Million USD), 2025-2033
- Table 5: Global: Cleanroom Consumables Market Forecast: Breakup by Region (in Million USD), 2025-2033
- Table 6: Global: Cleanroom Consumables Market: Competitive Structure
- Table 7: Global: Cleanroom Consumables Market: Key Players
The global cleanroom consumables market size reached USD 4.6 Billion in 2024. Looking forward, IMARC Group expects the market to reach USD 6.7 Billion by 2033, exhibiting a growth rate (CAGR) of 4.2% during 2025-2033.
Cleanroom consumables are made using high-quality raw materials and are worn in cleanrooms that have a controlled environment with low impurities, such as dust, microorganisms and chemical vapors. They protect products and processes from contamination caused by the individuals working in cleanrooms and their garments. They are washable, reusable, lightweight, skin-friendly and shrink resistant. Moreover, cleanroom consumables are available in different sizes, fabrics and colors to meet the requirements of different clients. They are widely used in hospitals, medical colleges, research laboratories, and pharmaceutical and chemical industries worldwide.
Cleanroom Consumables Market Trends:
In recent years, the need for improved quality and safety of healthcare products has emerged as one of the key factors fueling the demand for cleanroom consumables across the globe. Besides this, governments of several countries are implementing favorable regulations for the utilization of cleanroom consumables in the healthcare sector. This, in confluence with the escalating demand for sterilized pharmaceutical formulations and significant developments in medical equipment, is facilitating the market growth. Furthermore, the sudden outbreak of the coronavirus disease (COVID-19) has accelerated the demand for cleanroom consumables, such as goggles, gloves, and gowns, which is offering lucrative opportunities to the leading players. Apart from this, key players are engaged in regulatory approvals, training and development, acquisition and collaborative agreements with other companies. They are also increasing research and development (R&D) activities to introduce new products, which is anticipated to impel the market growth.
Key Market Segmentation:
Breakup by Product:
- Cleanroom Personal Protective Products
- Gloves
- Coveralls
- Shoe Covers
- Face Masks
- Others
- Cleanroom Cleaning Products
- Wipes
- Mops
- Disinfectants
- Others
Breakup by Application:
- Medical
- Drug Manufacturing
- Academic Research and Drug Research
Breakup by End User:
- Pharmaceutical and Biotechnology Companies
- Medical Device Companies
- Others
Breakup by Region:
- North America
- United States
- Canada
- Asia-Pacific
- China
- Japan
- India
- South Korea
- Australia
- Indonesia
- Others
- Europe
- Germany
- France
- United Kingdom
- Italy
- Spain
- Russia
- Others
- Latin America
- Brazil
- Mexico
- Others
- Middle East and Africa
Competitive Landscape:
The competitive landscape of the industry has also been examined along with the profiles of the key players being Ansell Ltd., Berkshire Corporation, Contec Inc., Dupont De Nemours Inc., EcoLab Inc., ITW Texwipe (Illinois Tool Works Inc.), Kimberly-Clark Corporation, Km Act Corp., Micronclean Ltd., Micronova Manufacturing Inc., Steris Corporation and Valutek Inc.
Key Questions Answered in This Report:
- How has the global cleanroom consumables market performed so far and how will it perform in the coming years?
- What has been the impact of COVID-19 on the global cleanroom consumables market?
- What are the key regional markets?
- What is the breakup of the market based on the product?
- What is the breakup of the market based on the application?
- What is the breakup of the market based on the end user?
- What are the various stages in the value chain of the industry?
- What are the key driving factors and challenges in the industry?
- What is the structure of the global cleanroom consumables market and who are the key players?
- What is the degree of competition in the industry?
Table of Contents
1 Preface
2 Scope and Methodology
- 2.1 Objectives of the Study
- 2.2 Stakeholders
- 2.3 Data Sources
- 2.3.1 Primary Sources
- 2.3.2 Secondary Sources
- 2.4 Market Estimation
- 2.4.1 Bottom-Up Approach
- 2.4.2 Top-Down Approach
- 2.5 Forecasting Methodology
3 Executive Summary
4 Introduction
- 4.1 Overview
- 4.2 Key Industry Trends
5 Global Cleanroom Consumables Market
- 5.1 Market Overview
- 5.2 Market Performance
- 5.3 Impact of COVID-19
- 5.4 Market Forecast
6 Market Breakup by Product
- 6.1 Cleanroom Personal Protective Products
- 6.1.1 Market Trends
- 6.1.2 Key Segments
- 6.1.2.1 Gloves
- 6.1.2.2 Coveralls
- 6.1.2.3 Shoe Covers
- 6.1.2.4 Face Masks
- 6.1.2.5 Others
- 6.1.3 Market Forecast
- 6.2 Cleanroom Cleaning Products
- 6.2.1 Market Trends
- 6.2.2 Key Segments
- 6.2.2.1 Wipes
- 6.2.2.2 Mops
- 6.2.2.3 Disinfectants
- 6.2.2.4 Others
- 6.2.3 Market Forecast
7 Market Breakup by Application
- 7.1 Medical
- 7.1.1 Market Trends
- 7.1.2 Market Forecast
- 7.2 Drug Manufacturing
- 7.2.1 Market Trends
- 7.2.2 Market Forecast
- 7.3 Academic Research and Drug Research
- 7.3.1 Market Trends
- 7.3.2 Market Forecast
8 Market Breakup by End User
- 8.1 Pharmaceutical and Biotechnology Companies
- 8.1.1 Market Trends
- 8.1.2 Market Forecast
- 8.2 Medical Device Companies
- 8.2.1 Market Trends
- 8.2.2 Market Forecast
- 8.3 Others
- 8.3.1 Market Trends
- 8.3.2 Market Forecast
9 Market Breakup by Region
- 9.1 North America
- 9.1.1 United States
- 9.1.1.1 Market Trends
- 9.1.1.2 Market Forecast
- 9.1.2 Canada
- 9.1.2.1 Market Trends
- 9.1.2.2 Market Forecast
- 9.1.1 United States
- 9.2 Asia-Pacific
- 9.2.1 China
- 9.2.1.1 Market Trends
- 9.2.1.2 Market Forecast
- 9.2.2 Japan
- 9.2.2.1 Market Trends
- 9.2.2.2 Market Forecast
- 9.2.3 India
- 9.2.3.1 Market Trends
- 9.2.3.2 Market Forecast
- 9.2.4 South Korea
- 9.2.4.1 Market Trends
- 9.2.4.2 Market Forecast
- 9.2.5 Australia
- 9.2.5.1 Market Trends
- 9.2.5.2 Market Forecast
- 9.2.6 Indonesia
- 9.2.6.1 Market Trends
- 9.2.6.2 Market Forecast
- 9.2.7 Others
- 9.2.7.1 Market Trends
- 9.2.7.2 Market Forecast
- 9.2.1 China
- 9.3 Europe
- 9.3.1 Germany
- 9.3.1.1 Market Trends
- 9.3.1.2 Market Forecast
- 9.3.2 France
- 9.3.2.1 Market Trends
- 9.3.2.2 Market Forecast
- 9.3.3 United Kingdom
- 9.3.3.1 Market Trends
- 9.3.3.2 Market Forecast
- 9.3.4 Italy
- 9.3.4.1 Market Trends
- 9.3.4.2 Market Forecast
- 9.3.5 Spain
- 9.3.5.1 Market Trends
- 9.3.5.2 Market Forecast
- 9.3.6 Russia
- 9.3.6.1 Market Trends
- 9.3.6.2 Market Forecast
- 9.3.7 Others
- 9.3.7.1 Market Trends
- 9.3.7.2 Market Forecast
- 9.3.1 Germany
- 9.4 Latin America
- 9.4.1 Brazil
- 9.4.1.1 Market Trends
- 9.4.1.2 Market Forecast
- 9.4.2 Mexico
- 9.4.2.1 Market Trends
- 9.4.2.2 Market Forecast
- 9.4.3 Others
- 9.4.3.1 Market Trends
- 9.4.3.2 Market Forecast
- 9.4.1 Brazil
- 9.5 Middle East and Africa
- 9.5.1 Market Trends
- 9.5.2 Market Breakup by Country
- 9.5.3 Market Forecast
10 SWOT Analysis
- 10.1 Overview
- 10.2 Strengths
- 10.3 Weaknesses
- 10.4 Opportunities
- 10.5 Threats
11 Value Chain Analysis
12 Porters Five Forces Analysis
- 12.1 Overview
- 12.2 Bargaining Power of Buyers
- 12.3 Bargaining Power of Suppliers
- 12.4 Degree of Competition
- 12.5 Threat of New Entrants
- 12.6 Threat of Substitutes
13 Price Analysis
14 Competitive Landscape
- 14.1 Market Structure
- 14.2 Key Players
- 14.3 Profiles of Key Players
- 14.3.1 Ansell Ltd.
- 14.3.1.1 Company Overview
- 14.3.1.2 Product Portfolio
- 14.3.1.3 Financials
- 14.3.1.4 SWOT Analysis
- 14.3.2 Berkshire Corporation
- 14.3.2.1 Company Overview
- 14.3.2.2 Product Portfolio
- 14.3.3 Contec Inc.
- 14.3.3.1 Company Overview
- 14.3.3.2 Product Portfolio
- 14.3.4 Dupont De Nemours Inc.
- 14.3.4.1 Company Overview
- 14.3.4.2 Product Portfolio
- 14.3.4.3 Financials
- 14.3.4.4 SWOT Analysis
- 14.3.5 EcoLab Inc.
- 14.3.5.1 Company Overview
- 14.3.5.2 Product Portfolio
- 14.3.5.3 Financials
- 14.3.5.4 SWOT Analysis
- 14.3.6 ITW Texwipe (Illinois Tool Works Inc.)
- 14.3.6.1 Company Overview
- 14.3.6.2 Product Portfolio
- 14.3.7 Kimberly-Clark Corporation
- 14.3.7.1 Company Overview
- 14.3.7.2 Product Portfolio
- 14.3.7.3 Financials
- 14.3.7.4 SWOT Analysis
- 14.3.8 Km Act Corp.
- 14.3.8.1 Company Overview
- 14.3.8.2 Product Portfolio
- 14.3.9 Micronclean Ltd.
- 14.3.9.1 Company Overview
- 14.3.9.2 Product Portfolio
- 14.3.10 Micronova Manufacturing Inc.
- 14.3.10.1 Company Overview
- 14.3.10.2 Product Portfolio
- 14.3.11 Steris Corporation
- 14.3.11.1 Company Overview
- 14.3.11.2 Product Portfolio
- 14.3.12 Valutek Inc.
- 14.3.12.1 Company Overview
- 14.3.12.2 Product Portfolio
- 14.3.1 Ansell Ltd.

