|
|
市場調査レポート
商品コード
1675745
高圧スイッチギヤ市場:タイプ別、用途別、地域別、2025-2033年High Voltage Switchgear Market by Type (Air Insulated, Gas Insulated, and Others), Application (Power Generation, Industrial, Oil and Gas, and Others), and Region 2025-2033 |
||||||

|
|||||||
カスタマイズ可能
|
|||||||

| 高圧スイッチギヤ市場:タイプ別、用途別、地域別、2025-2033年 |
|
出版日: 2025年03月01日
発行: IMARC
ページ情報: 英文 149 Pages
納期: 2~3営業日
|

全表示
- 概要
- 図表
- 目次
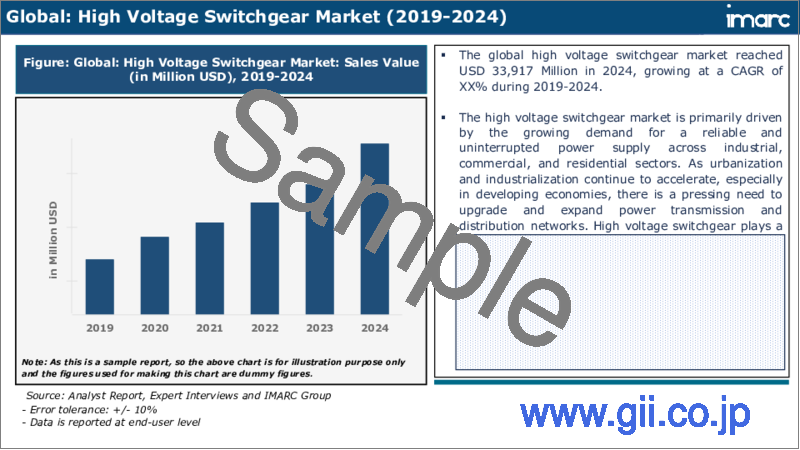
高圧スイッチギヤ市場の世界市場規模は2024年に339億米ドルに達しました。IMARC Groupは、2025年から2033年にかけての成長率(CAGR)は3.99%で、2033年には491億米ドルに達すると予測しています。エネルギー需要の増加、スマートグリッド技術への投資の増加、老朽化した電力インフラの急速な近代化が、市場を牽引する主な要因のひとつです。
高圧スイッチギヤは、36kVを超える電圧の送配電システムを制御、保護、絶縁するために使用される電気機器の一種です。発電所からエンドユーザーまでの安全で効果的な送配電を可能にするため、送電網の効率的で信頼性の高い運用に不可欠です。通常、サーキットブレーカー、断路器、スイッチ、ヒューズ、制御盤など、さまざまな部品で構成されています。これらのコンポーネントは、故障した機器を切り離したり、故障や過負荷が発生した場合に電流の流れを遮断したりするなど、特定の機能を果たすように設計されています。現在、高圧スイッチギヤには大きく分けて空気絶縁開閉器(AIS)とガス絶縁開閉器(GIS)の2種類があり、コンパクトでメンテナンスの必要性が低いことから、スペースが限られている状況や都市部で好まれています。その結果、高圧スイッチギヤは、発電、トランスミッション、配電、産業プラント、インフラプロジェクトなど、幅広い用途で使用されています。
高圧スイッチギヤ市場動向:
市場の主な原動力は、世界の電力需要の高まりと、信頼性の高い電力供給に対するニーズの急増です。高圧スイッチギヤは、送配電ネットワークの制御と保護に使用され、信頼性の高い無停電電力供給を保証します。加えて、老朽化した電力インフラの急速な近代化も成長を促す大きな要因となっています。老朽化したスイッチギヤが耐用年数を迎えると、より新しく効率的なスイッチギヤに交換する必要があり、これが市場の成長を促進しています。これに加えて、スマートグリッド技術への投資が増加していることも、高圧スイッチギヤの需要を高めています。高圧スイッチギヤは、送配電を最適化するために高度なセンサーと通信技術を使用するスマートグリッドに不可欠なコンポーネントだからです。さらに、ガス絶縁スイッチギヤやデジタルスイッチギヤなど、性能の向上、効率の向上、環境負荷の低減を実現する新素材や新技術の導入も市場を後押ししています。さらに、風力発電、太陽光発電、水力発電などの再生可能エネルギー源へのシフトが進んでいるため、高圧スイッチギヤの需要が増加しており、世界的に市場の見通しが明るくなっています。
本レポートで扱う主な質問
- 世界の高圧スイッチギヤ市場はこれまでどのように推移してきたのか?
- 世界の高圧スイッチギヤ市場における促進要因、抑制要因、機会は何か?
- 各促進要因、抑制要因、機会が世界の高圧スイッチギヤ市場に与える影響は?
- 主要な地域市場とは?
- 最も魅力的な高圧スイッチギヤ市場はどの国か?
- タイプ別の市場内訳は?
- 高圧スイッチギヤ市場で最も魅力的なタイプは?
- 用途別の市場内訳は?
- 高圧スイッチギヤ市場で最も魅力的な用途は?
- 世界の高圧スイッチギヤ市場の競合構造は?
- 世界の高圧スイッチギヤ市場における主要プレイヤー/企業は?
目次
第1章 序文
第2章 調査範囲と調査手法
- 調査の目的
- ステークホルダー
- データソース
- 一次情報
- 二次情報
- 市場推定
- ボトムアップアプローチ
- トップダウンアプローチ
- 調査手法
第3章 エグゼクティブサマリー
第4章 イントロダクション
- 概要
- 主要業界動向
第5章 世界の高圧スイッチギヤ市場
- 市場概要
- 市場実績
- COVID-19の影響
- 市場予測
第6章 市場内訳:タイプ別
- 空気絶縁
- ガス絶縁
- その他
第7章 市場内訳:用途別
- 発電
- 工業
- 石油・ガス
- その他
第8章 市場内訳:地域別
- 北米
- 米国
- カナダ
- アジア太平洋地域
- 中国
- 日本
- インド
- 韓国
- オーストラリア
- インドネシア
- その他
- 欧州
- ドイツ
- フランス
- 英国
- イタリア
- スペイン
- ロシア
- その他
- ラテンアメリカ
- ブラジル
- メキシコ
- その他
- 中東・アフリカ
- 市場内訳:国別
第9章 促進要因・抑制要因・機会
- 概要
- 促進要因
- 抑制要因
- 機会
第10章 バリューチェーン分析
第11章 ポーターのファイブフォース分析
- 概要
- 買い手の交渉力
- 供給企業の交渉力
- 競合の程度
- 新規参入業者の脅威
- 代替品の脅威
第12章 価格分析
第13章 競合情勢
- 市場構造
- 主要企業
- 主要企業のプロファイル
- CG Power and Industrial Solutions Limited
- Fuji Electric Co. Ltd.
- General Electric Company
- Mitsubishi Electric Corporation
- Siemens Energy AG
- Toshiba Corporation
List of Figures
- Figure 1: Global: High Voltage Switchgear Market: Major Drivers and Challenges
- Figure 2: Global: High Voltage Switchgear Market: Sales Value (in Billion USD), 2019-2024
- Figure 3: Global: High Voltage Switchgear Market Forecast: Sales Value (in Billion USD), 2025-2033
- Figure 4: Global: High Voltage Switchgear Market: Breakup by Type (in %), 2024
- Figure 5: Global: High Voltage Switchgear Market: Breakup by Application (in %), 2024
- Figure 6: Global: High Voltage Switchgear Market: Breakup by Region (in %), 2024
- Figure 7: Global: High Voltage Switchgear (Air Insulated) Market: Sales Value (in Million USD), 2019 & 2024
- Figure 8: Global: High Voltage Switchgear (Air Insulated) Market Forecast: Sales Value (in Million USD), 2025-2033
- Figure 9: Global: High Voltage Switchgear (Gas Insulated) Market: Sales Value (in Million USD), 2019 & 2024
- Figure 10: Global: High Voltage Switchgear (Gas Insulated) Market Forecast: Sales Value (in Million USD), 2025-2033
- Figure 11: Global: High Voltage Switchgear (Other Types) Market: Sales Value (in Million USD), 2019 & 2024
- Figure 12: Global: High Voltage Switchgear (Other Types) Market Forecast: Sales Value (in Million USD), 2025-2033
- Figure 13: Global: High Voltage Switchgear (Power Generation) Market: Sales Value (in Million USD), 2019 & 2024
- Figure 14: Global: High Voltage Switchgear (Power Generation) Market Forecast: Sales Value (in Million USD), 2025-2033
- Figure 15: Global: High Voltage Switchgear (Industrial) Market: Sales Value (in Million USD), 2019 & 2024
- Figure 16: Global: High Voltage Switchgear (Industrial) Market Forecast: Sales Value (in Million USD), 2025-2033
- Figure 17: Global: High Voltage Switchgear (Oil and Gas) Market: Sales Value (in Million USD), 2019 & 2024
- Figure 18: Global: High Voltage Switchgear (Oil and Gas) Market Forecast: Sales Value (in Million USD), 2025-2033
- Figure 19: Global: High Voltage Switchgear (Other Applications) Market: Sales Value (in Million USD), 2019 & 2024
- Figure 20: Global: High Voltage Switchgear (Other Applications) Market Forecast: Sales Value (in Million USD), 2025-2033
- Figure 21: North America: High Voltage Switchgear Market: Sales Value (in Million USD), 2019 & 2024
- Figure 22: North America: High Voltage Switchgear Market Forecast: Sales Value (in Million USD), 2025-2033
- Figure 23: United States: High Voltage Switchgear Market: Sales Value (in Million USD), 2019 & 2024
- Figure 24: United States: High Voltage Switchgear Market Forecast: Sales Value (in Million USD), 2025-2033
- Figure 25: Canada: High Voltage Switchgear Market: Sales Value (in Million USD), 2019 & 2024
- Figure 26: Canada: High Voltage Switchgear Market Forecast: Sales Value (in Million USD), 2025-2033
- Figure 27: Asia-Pacific: High Voltage Switchgear Market: Sales Value (in Million USD), 2019 & 2024
- Figure 28: Asia-Pacific: High Voltage Switchgear Market Forecast: Sales Value (in Million USD), 2025-2033
- Figure 29: China: High Voltage Switchgear Market: Sales Value (in Million USD), 2019 & 2024
- Figure 30: China: High Voltage Switchgear Market Forecast: Sales Value (in Million USD), 2025-2033
- Figure 31: Japan: High Voltage Switchgear Market: Sales Value (in Million USD), 2019 & 2024
- Figure 32: Japan: High Voltage Switchgear Market Forecast: Sales Value (in Million USD), 2025-2033
- Figure 33: India: High Voltage Switchgear Market: Sales Value (in Million USD), 2019 & 2024
- Figure 34: India: High Voltage Switchgear Market Forecast: Sales Value (in Million USD), 2025-2033
- Figure 35: South Korea: High Voltage Switchgear Market: Sales Value (in Million USD), 2019 & 2024
- Figure 36: South Korea: High Voltage Switchgear Market Forecast: Sales Value (in Million USD), 2025-2033
- Figure 37: Australia: High Voltage Switchgear Market: Sales Value (in Million USD), 2019 & 2024
- Figure 38: Australia: High Voltage Switchgear Market Forecast: Sales Value (in Million USD), 2025-2033
- Figure 39: Indonesia: High Voltage Switchgear Market: Sales Value (in Million USD), 2019 & 2024
- Figure 40: Indonesia: High Voltage Switchgear Market Forecast: Sales Value (in Million USD), 2025-2033
- Figure 41: Others: High Voltage Switchgear Market: Sales Value (in Million USD), 2019 & 2024
- Figure 42: Others: High Voltage Switchgear Market Forecast: Sales Value (in Million USD), 2025-2033
- Figure 43: Europe: High Voltage Switchgear Market: Sales Value (in Million USD), 2019 & 2024
- Figure 44: Europe: High Voltage Switchgear Market Forecast: Sales Value (in Million USD), 2025-2033
- Figure 45: Germany: High Voltage Switchgear Market: Sales Value (in Million USD), 2019 & 2024
- Figure 46: Germany: High Voltage Switchgear Market Forecast: Sales Value (in Million USD), 2025-2033
- Figure 47: France: High Voltage Switchgear Market: Sales Value (in Million USD), 2019 & 2024
- Figure 48: France: High Voltage Switchgear Market Forecast: Sales Value (in Million USD), 2025-2033
- Figure 49: United Kingdom: High Voltage Switchgear Market: Sales Value (in Million USD), 2019 & 2024
- Figure 50: United Kingdom: High Voltage Switchgear Market Forecast: Sales Value (in Million USD), 2025-2033
- Figure 51: Italy: High Voltage Switchgear Market: Sales Value (in Million USD), 2019 & 2024
- Figure 52: Italy: High Voltage Switchgear Market Forecast: Sales Value (in Million USD), 2025-2033
- Figure 53: Spain: High Voltage Switchgear Market: Sales Value (in Million USD), 2019 & 2024
- Figure 54: Spain: High Voltage Switchgear Market Forecast: Sales Value (in Million USD), 2025-2033
- Figure 55: Russia: High Voltage Switchgear Market: Sales Value (in Million USD), 2019 & 2024
- Figure 56: Russia: High Voltage Switchgear Market Forecast: Sales Value (in Million USD), 2025-2033
- Figure 57: Others: High Voltage Switchgear Market: Sales Value (in Million USD), 2019 & 2024
- Figure 58: Others: High Voltage Switchgear Market Forecast: Sales Value (in Million USD), 2025-2033
- Figure 59: Latin America: High Voltage Switchgear Market: Sales Value (in Million USD), 2019 & 2024
- Figure 60: Latin America: High Voltage Switchgear Market Forecast: Sales Value (in Million USD), 2025-2033
- Figure 61: Brazil: High Voltage Switchgear Market: Sales Value (in Million USD), 2019 & 2024
- Figure 62: Brazil: High Voltage Switchgear Market Forecast: Sales Value (in Million USD), 2025-2033
- Figure 63: Mexico: High Voltage Switchgear Market: Sales Value (in Million USD), 2019 & 2024
- Figure 64: Mexico: High Voltage Switchgear Market Forecast: Sales Value (in Million USD), 2025-2033
- Figure 65: Others: High Voltage Switchgear Market: Sales Value (in Million USD), 2019 & 2024
- Figure 66: Others: High Voltage Switchgear Market Forecast: Sales Value (in Million USD), 2025-2033
- Figure 67: Middle East and Africa: High Voltage Switchgear Market: Sales Value (in Million USD), 2019 & 2024
- Figure 68: Middle East and Africa: High Voltage Switchgear Market: Breakup by Country (in %), 2024
- Figure 69: Middle East and Africa: High Voltage Switchgear Market Forecast: Sales Value (in Million USD), 2025-2033
- Figure 70: Global: High Voltage Switchgear Industry: Drivers, Restraints, and Opportunities
- Figure 71: Global: High Voltage Switchgear Industry: Value Chain Analysis
- Figure 72: Global: High Voltage Switchgear Industry: Porter's Five Forces Analysis
List of Tables
- Table 1: Global: High Voltage Switchgear Market: Key Industry Highlights, 2024 & 2033
- Table 2: Global: High Voltage Switchgear Market Forecast: Breakup by Type (in Million USD), 2025-2033
- Table 3: Global: High Voltage Switchgear Market Forecast: Breakup by Application (in Million USD), 2025-2033
- Table 4: Global: High Voltage Switchgear Market Forecast: Breakup by Region (in Million USD), 2025-2033
- Table 5: Global: High Voltage Switchgear Market: Competitive Structure
- Table 6: Global: High Voltage Switchgear Market: Key Players
The global high voltage switchgear market size reached USD 33.9 Billion in 2024. Looking forward, IMARC Group expects the market to reach USD 49.1 Billion by 2033, exhibiting a growth rate (CAGR) of 3.99% during 2025-2033. The rising energy demand, the increasing investments in smart grid technologies and the rapid modernization of aging power infrastructure represent some of the key factors driving the market.
High voltage switchgear is a type of electrical equipment that is used to control, protect and isolate electrical power transmission and distribution systems with voltages above 36 kV. It is essential for the efficient and reliable operation of power grids, as it enables the safe and effective transmission and distribution of electrical power from power stations to end-users. It typically consists of various components such as circuit breakers, disconnectors, switches, fuses, and control panels. These components are designed to perform specific functions, such as isolating faulty equipment or interrupting the flow of current in the event of a fault or overload. Presently, there are two main types of high-voltage switchgear available, namely, air-insulated switchgear (AIS) and gas-insulated switchgear (GIS), which is preferred in situations where space is limited or in urban areas due to its compact size and low maintenance requirements. As a result, high-voltage switchgear is used in a wide range of applications, including power generation, transmission, and distribution, industrial plants, and infrastructure projects.
High Voltage Switchgear Market Trends:
The market is primarily driven by the growing demand for electricity across the world and the surging need for reliable power supply. High voltage switchgear is used to control and protect power transmission and distribution networks, ensuring reliable and uninterrupted power supply. In addition, the rapid modernization of aging power infrastructure represents another major growth-inducing factor. As old switchgear reaches the end of its service life, it needs to be replaced with newer, more efficient switchgear, which is driving the growth of the market. Besides this, the increasing investments in smart grid technologies are also escalating the demand for high-voltage switchgear as it is an essential component of smart grids, which use advanced sensors and communication technologies to optimize power transmission and distribution. Moreover, the market is propelled by the introduction of new materials and technologies, such as gas-insulated switchgear and digital switchgear, that offer improved performance, greater efficiency, and reduced environmental impact. Furthermore, the increasing shift toward renewable energy sources such as wind, solar, and hydroelectric power has resulted in an increase in demand for high-voltage switchgear, which is creating a positive market outlook across the globe.
Key Market Segmentation:
Type Insights:
- Air Insulated
- Gas Insulated
- Others
Application Insights:
- Power Generation
- Industrial
- Oil and Gas
- Others
Regional Insights:
- North America
- United States
- Canada
- Europe
- Germany
- France
- United Kingdom
- Italy
- Spain
- Russia
- Others
- Asia Pacific
- China
- Japan
- India
- South Korea
- Australia
- Indonesia
- Others
- Latin America
- Brazil
- Mexico
- Others
- Middle East and Africa
- The report has also provided a comprehensive analysis of all the major regional markets, which include North America (the United States and Canada); Europe (Germany, France, the United Kingdom, Italy, Spain, Russia, and others); Asia Pacific (China, Japan, India, South Korea, Australia, Indonesia, and others); Latin America (Brazil, Mexico, and others); and the Middle East and Africa. According to the report, Asia Pacific was the largest market for high voltage switchgear. Some of the factors driving the Asia Pacific high voltage switchgear market included the surging need for reliable power supply, the development of smart grid infrastructure, and the increasing shift toward reliable energy sources.
Competitive Landscape:
- The report has also provided a comprehensive analysis of the competitive landscape in the global high voltage switchgear market. Competitive analysis such as market structure, market share by key players, player positioning, top winning strategies, competitive dashboard, and company evaluation quadrant has been covered in the report. Also, detailed profiles of all major companies have been provided. Some of the companies covered include CG Power and Industrial Solutions Limited, Fuji Electric Co. Ltd., General Electric Company, Mitsubishi Electric Corporation, Siemens Energy AG, Toshiba Corporation, etc. Kindly note that this only represents a partial list of companies, and the complete list has been provided in the report.
Key Questions Answered in This Report:
- How has the global high voltage switchgear market performed so far, and how will it perform in the coming years?
- What are the drivers, restraints, and opportunities in the global high voltage switchgear market?
- What is the impact of each driver, restraint, and opportunity on the global high voltage switchgear market?
- What are the key regional markets?
- Which countries represent the most attractive high voltage switchgear market?
- What is the breakup of the market based on the type?
- Which is the most attractive type in the high voltage switchgear market?
- What is the breakup of the market based on the application?
- Which is the most attractive application in the high voltage switchgear market?
- What is the competitive structure of the global high voltage switchgear market?
- Who are the key players/companies in the global high voltage switchgear market?
Table of Contents
1 Preface
2 Scope and Methodology
- 2.1 Objectives of the Study
- 2.2 Stakeholders
- 2.3 Data Sources
- 2.3.1 Primary Sources
- 2.3.2 Secondary Sources
- 2.4 Market Estimation
- 2.4.1 Bottom-Up Approach
- 2.4.2 Top-Down Approach
- 2.5 Forecasting Methodology
3 Executive Summary
4 Introduction
- 4.1 Overview
- 4.2 Key Industry Trends
5 Global High Voltage Switchgear Market
- 5.1 Market Overview
- 5.2 Market Performance
- 5.3 Impact of COVID-19
- 5.4 Market Forecast
6 Market Breakup by Type
- 6.1 Air Insulated
- 6.1.1 Market Trends
- 6.1.2 Market Forecast
- 6.2 Gas Insulated
- 6.2.1 Market Trends
- 6.2.2 Market Forecast
- 6.3 Others
- 6.3.1 Market Trends
- 6.3.2 Market Forecast
7 Market Breakup by Application
- 7.1 Power Generation
- 7.1.1 Market Trends
- 7.1.2 Market Forecast
- 7.2 Industrial
- 7.2.1 Market Trends
- 7.2.2 Market Forecast
- 7.3 Oil and Gas
- 7.3.1 Market Trends
- 7.3.2 Market Forecast
- 7.4 Others
- 7.4.1 Market Trends
- 7.4.2 Market Forecast
8 Market Breakup by Region
- 8.1 North America
- 8.1.1 United States
- 8.1.1.1 Market Trends
- 8.1.1.2 Market Forecast
- 8.1.2 Canada
- 8.1.2.1 Market Trends
- 8.1.2.2 Market Forecast
- 8.1.1 United States
- 8.2 Asia-Pacific
- 8.2.1 China
- 8.2.1.1 Market Trends
- 8.2.1.2 Market Forecast
- 8.2.2 Japan
- 8.2.2.1 Market Trends
- 8.2.2.2 Market Forecast
- 8.2.3 India
- 8.2.3.1 Market Trends
- 8.2.3.2 Market Forecast
- 8.2.4 South Korea
- 8.2.4.1 Market Trends
- 8.2.4.2 Market Forecast
- 8.2.5 Australia
- 8.2.5.1 Market Trends
- 8.2.5.2 Market Forecast
- 8.2.6 Indonesia
- 8.2.6.1 Market Trends
- 8.2.6.2 Market Forecast
- 8.2.7 Others
- 8.2.7.1 Market Trends
- 8.2.7.2 Market Forecast
- 8.2.1 China
- 8.3 Europe
- 8.3.1 Germany
- 8.3.1.1 Market Trends
- 8.3.1.2 Market Forecast
- 8.3.2 France
- 8.3.2.1 Market Trends
- 8.3.2.2 Market Forecast
- 8.3.3 United Kingdom
- 8.3.3.1 Market Trends
- 8.3.3.2 Market Forecast
- 8.3.4 Italy
- 8.3.4.1 Market Trends
- 8.3.4.2 Market Forecast
- 8.3.5 Spain
- 8.3.5.1 Market Trends
- 8.3.5.2 Market Forecast
- 8.3.6 Russia
- 8.3.6.1 Market Trends
- 8.3.6.2 Market Forecast
- 8.3.7 Others
- 8.3.7.1 Market Trends
- 8.3.7.2 Market Forecast
- 8.3.1 Germany
- 8.4 Latin America
- 8.4.1 Brazil
- 8.4.1.1 Market Trends
- 8.4.1.2 Market Forecast
- 8.4.2 Mexico
- 8.4.2.1 Market Trends
- 8.4.2.2 Market Forecast
- 8.4.3 Others
- 8.4.3.1 Market Trends
- 8.4.3.2 Market Forecast
- 8.4.1 Brazil
- 8.5 Middle East and Africa
- 8.5.1 Market Trends
- 8.5.2 Market Breakup by Country
- 8.5.3 Market Forecast
9 Drivers, Restraints, and Opportunities
- 9.1 Overview
- 9.2 Drivers
- 9.3 Restraints
- 9.4 Opportunities
10 Value Chain Analysis
11 Porters Five Forces Analysis
- 11.1 Overview
- 11.2 Bargaining Power of Buyers
- 11.3 Bargaining Power of Suppliers
- 11.4 Degree of Competition
- 11.5 Threat of New Entrants
- 11.6 Threat of Substitutes
12 Price Analysis
13 Competitive Landscape
- 13.1 Market Structure
- 13.2 Key Players
- 13.3 Profiles of Key Players
- 13.3.1 CG Power and Industrial Solutions Limited
- 13.3.1.1 Company Overview
- 13.3.1.2 Product Portfolio
- 13.3.1.3 Financials
- 13.3.1.4 SWOT Analysis
- 13.3.2 Fuji Electric Co. Ltd.
- 13.3.2.1 Company Overview
- 13.3.2.2 Product Portfolio
- 13.3.2.3 Financials
- 13.3.2.4 SWOT Analysis
- 13.3.3 General Electric Company
- 13.3.3.1 Company Overview
- 13.3.3.2 Product Portfolio
- 13.3.3.3 Financials
- 13.3.3.4 SWOT Analysis
- 13.3.4 Mitsubishi Electric Corporation
- 13.3.4.1 Company Overview
- 13.3.4.2 Product Portfolio
- 13.3.4.3 Financials
- 13.3.4.4 SWOT Analysis
- 13.3.5 Siemens Energy AG
- 13.3.5.1 Company Overview
- 13.3.5.2 Product Portfolio
- 13.3.5.3 Financials
- 13.3.5.4 SWOT Analysis
- 13.3.6 Toshiba Corporation
- 13.3.6.1 Company Overview
- 13.3.6.2 Product Portfolio
- 13.3.6.3 Financials
- 13.3.6.4 SWOT Analysis
- 13.3.1 CG Power and Industrial Solutions Limited
Kindly note that this only represents a partial list of companies, and the complete list has been provided in the report.

