|
|
市場調査レポート
商品コード
1321403
バーチャルリアリティ(VR)の市場規模、シェア、動向分析レポート:技術別、デバイス別、コンポーネント別、用途別、地域別、セグメント予測、2023年~2030年Virtual Reality (VR) Market Size, Share & Trends Analysis Report By Technology (Semi & Fully Immersive, Non-immersive), By Device (HMD, GTD), By Component (Hardware, Software), By Application, By Region, And Segment Forecasts, 2023 - 2030 |
||||||
|
|
|||||||
カスタマイズ可能
|
|||||||


| バーチャルリアリティ(VR)の市場規模、シェア、動向分析レポート:技術別、デバイス別、コンポーネント別、用途別、地域別、セグメント予測、2023年~2030年 |
|
出版日: 2023年07月19日
発行: Grand View Research
ページ情報: 英文 300 Pages
納期: 2~10営業日
|

- 全表示
- 概要
- 図表
- 目次
バーチャルリアリティ(VR)市場の成長と動向
Grand View Research, Inc.の最新レポートによると、世界のバーチャルリアリティ(VR)の市場規模は2030年までに4,353億6,000万米ドルに達し、2023年から2030年までのCAGRは27.5%で成長すると予測されています。
教育、産業トレーニング、ヘルスケアなどの産業でユーザー没入型技術の採用が増加していることが、市場成長の原動力になると見られています。また、高速5Gネットワークによるインターネットの普及は、高速で低遅延なインターネット接続により、VR技術の採用にプラスの影響を与えています。また、教育、航空宇宙・防衛、自動車などの業界全体でトレーニングや調査の需要が高まっていることも、市場の成長を後押ししています。例えば、2022年10月、Meta Platforms, Inc.は、Snapdragon Qualcomm XR2+チップセットを搭載したMeta Quest Pro VRヘッドセットを発売しました。
同社によると、このヘッドセットはハイエンドのVRヘッドセットを探している専門家やクリエイターをターゲットにしています。VR技術により、eコマース企業はユーザーにバーチャルで買い物をさせることができるようになっています。この技術はインタラクティブな環境を作り出し、ユーザーの全体的な買い物体験を向上させるのに役立ちます。また、教師がVRベースのオンラインプラットフォーム上でインタラクティブな学術セッションを行い、より良いコラボレーションを促進できるため、教育分野におけるVRの需要も伸びています。北米は、同地域におけるテクノロジー企業の優位性により、2030年までに同市場で大きなシェアを占めると予想されています。同地域における技術の浸透と新しいVR製品の利用可能性が、同地域の成長をさらに押し上げると予想されます。さらに、VRに関連するさまざまな新興企業の出現が、市場の成長機会の創出に貢献すると期待されています。
バーチャルリアリティ(VR)市場レポートハイライト
- デバイス別では、没入感を高めるジェスチャートレースの動向により、ジェスチャートラッキングデバイス(GTD)セグメントが予測期間中29.9%のCAGRで最も高い成長が見込まれます。
- 技術別では、半没入型・完全没入型セグメントが、実世界のシナリオを忠実にシミュレートする技術によって提供されるリアルな体験により、2022年に82.7%の最大の収益シェアを占めました。
- コンポーネント別では、ソフトウェアセグメントが、ゲームやエンターテインメントにおけるVRアプリケーションの需要拡大により、2023年から2030年にかけて29.7%のCAGRで最も高い成長が見込まれています。
- アジア太平洋地域は、主要なVR機器メーカーの存在と、先進技術の利用に対する政府による奨励的な取り組みにより、2022年には39%を超える最大の収益シェアを占めました。
目次
第1章 調査手法と範囲
- 市場セグメンテーションと範囲
- 市場の定義
- 情報調達
- 調査範囲と前提条件
第2章 エグゼクティブサマリー
第3章 業界の見通し
- 市場系統の見通し
- 業界のバリューチェーン分析
- 市場力学
- 市場促進要因分析
- 市場課題分析
- 業界の機会と課題
- 業界分析ツール
- ポーターの分析
- マクロ経済分析
第4章 バーチャルリアリティ(VR)市場のデバイスの見通し
- デバイス別のバーチャルリアリティ(VR)市場シェア、2018~2030年
- デバイスの変動分析と市場シェア、2022年と2030年
- デバイス別
- ヘッドマウントディスプレイ(HMD)
- ジェスチャートラッキングデバイス(GTD)
- プロジェクター・ディスプレイウォール(PDW)
第5章 バーチャルリアリティ(VR)市場の技術の見通し
- 技術別のバーチャルリアリティ(VR)市場シェア、2018~2030年
- 技術の変動分析と市場シェア、2022年と2030年
- 技術別
- 半没入型・完全没入型
- 非没入型
第6章 バーチャルリアリティ(VR)市場のコンポーネントの見通し
- コンポーネント別のバーチャルリアリティ(VR)市場シェア、2018~2030年
- コンポーネントの変動分析と市場シェア、2022年と2030年
- コンポーネント別
- ハードウェア
- ソフトウェア
第7章 バーチャルリアリティ(VR)市場の用途の見通し
- 用途別のバーチャルリアリティ(VR)市場シェア、2018~2030年
- 用途の変動分析と市場シェア、2022年と2030年
- 用途別
- 航空宇宙・防衛
- 消費者
- 商業
- 企業
- ヘルスケア
- その他
第8章 バーチャルリアリティ(VR)の地域の見通し
- 地域別のバーチャルリアリティ(VR)市場シェア、2022年および2030年
- 北米
- 米国
- カナダ
- メキシコ
- 欧州
- 英国
- ドイツ
- イタリア
- フランス
- アジア太平洋地域
- 中国
- 日本
- 韓国
- インド
- 南米
- ブラジル
- アルゼンチン
- 中東・アフリカ
- サウジアラビア
- 南アフリカ
第9章 競合情勢
- 主要な市場参入企業
- Alphabet Inc.
- Barco NV
- CyberGlove Systems Inc.
- Meta Platforms, Inc.
- HTC Corporation
- Microsoft Corporation
- Samsung Electronics Co., Ltd
- Sensics, Inc.
- Sixense Enterprises Inc.(Penumbra, Inc.)
- Ultraleap Limited
- 主要市場参入企業による最近の動向と影響分析
- 企業の分類
- 参入企業の概要
- 財務実績
- 製品のベンチマーク
- 企業ヒートマップ分析
- 企業の市場シェア分析、2022年
- 戦略マッピング
- 拡大
- 合併と買収
- コラボレーション
- 新製品の発売
- 研究開発
List of Tables
- Table 1 Virtual reality market - key market driver impact
- Table 2 Key market restraint/challenges impact
- Table 3 Global virtual reality market revenue estimates and forecast, by device, 2018 - 2030 (USD Million)
- Table 4 Global virtual reality market revenue estimates and forecast, by technology, 2018 - 2030 (USD Million)
- Table 5 Global virtual reality market revenue estimates and forecast, by component, 2018 - 2030 (USD Million)
- Table 6 Global virtual reality market revenue estimates and forecast, by application, 2018 - 2030 (USD Million)
- Table 7 Company heat map analysis
- Table 8 Key companies undergoing expansion
- Table 9 Key companies involved in mergers & acquisitions
- Table 10 Key companies involved in collaborations
- Table 11 Key companies new product launches
- Table 12 Key companies research & development
List of Figures
- Fig. 1 Market snapshot
- Fig. 2 Information procurement
- Fig. 3 Data analysis models
- Fig. 4 Market formulation and validation
- Fig. 5 Data validating & publishing
- Fig. 6 Market snapshot
- Fig. 7 Segment snapshot
- Fig. 8 Competitive landscape snapshot
- Fig. 9 Virtual reality market value, 2022 & 2030 (USD Million)
- Fig. 10 Key opportunity analysis
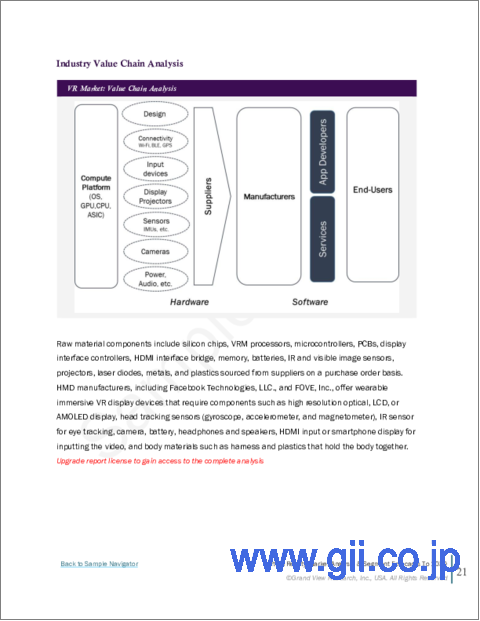
- Fig. 11 Industry value chain analysis
- Fig. 12 Market dynamics
- Fig. 13 Porter's analysis
- Fig. 14 PESTEL analysis
- Fig. 15 Virtual reality market, by device, key takeaways
- Fig. 16 Virtual reality market, by device, market share, 2022 & 2030
- Fig. 17 Head-mounted display (HMD) estimates & forecasts, 2018 - 2030 (USD Million)
- Fig. 18 Gesture-tracking device (GTD) market estimates & forecasts, 2018 - 2030 (USD Million)
- Fig. 19 Projectors & Display Wall (PDW) market estimates & forecasts, 2018 - 2030 (USD Million)
- Fig. 20 Virtual reality market, by technology, key takeaways
- Fig. 21 Virtual reality market, by technology, market share, 2022 & 2030
- Fig. 22 Semi & fully immersive market estimates & forecasts, 2018 - 2030 (USD Million)
- Fig. 23 Non-immersive market estimates & forecasts, 2018 - 2030 (USD Million)
- Fig. 24 Virtual reality market, by component, key takeaways
- Fig. 25 Virtual reality market, by component, market share, 2022 & 2030
- Fig. 26 Hardware market estimates & forecasts, 2018 - 2030 (USD Million)
- Fig. 27 Software market estimates & forecasts, 2018 - 2030 (USD Million)
- Fig. 28 Virtual reality market, by application, key takeaways
- Fig. 29 Virtual reality market, by application, market share, 2022 & 2030
- Fig. 30 Aerospace & defense market estimates & forecasts, 2018 - 2030 (USD Million)
- Fig. 31 Consumer market estimates & forecasts, 2018 - 2030 (USD Million)
- Fig. 32 Commercial market estimates & forecasts, 2018 - 2030 (USD Million)
- Fig. 33 Enterprise market estimates & forecasts, 2018 - 2030 (USD Million)
- Fig. 34 Healthcare market estimates & forecasts, 2018 - 2030 (USD Million)
- Fig. 35 Others market estimates & forecasts, 2018 - 2030 (USD Million)
- Fig. 36 Virtual reality market revenue, by region, 2022 & 2030 (USD Million)
- Fig. 37 North America virtual reality market estimates & forecast, 2018 - 2030 (USD Million)
- Fig. 38 U.S. virtual reality market estimates & forecast, 2018 - 2030 (USD Million)
- Fig. 39 Canada virtual reality market estimates & forecast, 2018 - 2030 (USD Million)
- Fig. 40 Mexico virtual reality market estimates & forecast, 2018 - 2030 (USD Million)
- Fig. 41 Europe virtual reality market estimates & forecast, 2018 - 2030 (USD Million)
- Fig. 42 UK virtual reality market estimates & forecast, 2018 - 2030 (USD Million)
- Fig. 43 Germany virtual reality market estimates & forecast, 2018 - 2030 (USD Million)
- Fig. 44 Italy virtual reality market estimates & forecast, 2018 - 2030 (USD Million)
- Fig. 45 France virtual reality market estimates & forecast, 2018 - 2030 (USD Million)
- Fig. 46 Asia Pacific virtual reality market estimates & forecast, 2018 - 2030 (USD Million)
- Fig. 47 China virtual reality market estimates & forecast, 2018 - 2030 (USD Million)
- Fig. 48 Japan virtual reality market estimates & forecast, 2018 - 2030 (USD Million)
- Fig. 49 South Korea virtual reality market estimates & forecast, 2018 - 2030 (USD Million)
- Fig. 50 India virtual reality market estimates & forecast, 2018 - 2030 (USD Million)
- Fig. 51 South America virtual reality market estimates & forecast, 2018 - 2030 (USD Million)
- Fig. 52 Brazil virtual reality market estimates & forecast, 2018 - 2030 (USD Million)
- Fig. 53 Argentina virtual reality market estimates & forecast, 2018 - 2030 (USD Million)
- Fig. 54 MEA virtual reality market estimates & forecast, 2018 - 2030 (USD Million)
- Fig. 55 Saudi Arabia virtual reality market estimates & forecast, 2018 - 2030 (USD Million)
- Fig. 56 South Africa virtual reality market estimates & forecast, 2018 - 2030 (USD Million)
- Fig. 57 Strategic framework
Virtual Reality Market Growth & Trends
The global virtual reality market size is expected to reach USD 435.36 billion by 2030, growing at a CAGR of 27.5% from 2023 to 2030, according to a new report by Grand View Research, Inc. The increasing adoption of user immersion technology in industries, such as education, industrial training, and healthcare, among others, is expected to drive market growth. In addition, internet penetration in the form of high-speed 5G networks has positively impacted the adoption of Virtual Reality (VR) technology due to fast and low-latency internet connections. The growing demand for training and research across industries, such as education, aerospace & defense, and automotive, is also driving the growth of the market. For instance, in October 2022, Meta Platforms, Inc. launched the Meta Quest Pro VR headset with the Snapdragon Qualcomm XR2+ chipset.
According to the company, the headset is targeted toward professionals and creators looking for high-end VR headsets. VR technology has enabled e-commerce companies to let users shop virtually. This technology creates an interactive environment and helps improve the overall shopping experience for users. The demand for virtual reality in the education sector is also growing as teachers can conduct interactive academic sessions on VR-based online platforms to facilitate better collaboration. North America is anticipated to hold a significant share in the market by 2030 owing to the dominance of technology companies in the region. Technology penetration in the region and the availability of new VR products are expected to boost the region's growth further. Moreover, the emergence of various start-ups related to virtual reality (VR) is expected to help create growth opportunities for the market.
Virtual Reality Market Report Highlights
- The Gesture Tracking Device (GTD) segment is expected to grow at the highest CAGR of 29.9% over the forecast period due to the trend of gesture tracing for enhanced immersion
- The semi & fully immersive technology segment held the largest revenue share of 82.7% in 2022 due to the realistic experience provided by the technology that closely simulates real-world scenarios
- The software component segment is expected to grow at the highest CAGR of 29.7% from 2023 to 2030 due to the growing demand for VR applications in gaming and entertainment
- Asia Pacific accounted for the largest revenue share of over 39% in 2022 due to the presence of leading VR equipment manufacturers and encouraging initiatives by the governments for the use of advanced technologies
Table of Contents
Chapter 1 Methodology and Scope
- 1.1 Market Segmentation & Scope
- 1.2 Market Definitions
- 1.3 Information Procurement
- 1.3.1 Information analysis
- 1.3.2 Market formulation & data visualization
- 1.3.3 Data validation & publishing
- 1.4 Research Scope and Assumptions
- 1.4.1 List of data sources
Chapter 2 Executive Summary
- 2.1 Market Snapshot
- 2.2 Segment Snapshot
- 2.3 Competitive Landscape Snapshot
Chapter 3 Industry Outlook
- 3.1 Market Lineage Outlook
- 3.2 Industry Value Chain Analysis
- 3.3 Market Dynamics
- 3.3.1 Market driver analysis
- 3.3.1.1 Evolving applications in the entertainment and medical sectors
- 3.3.1.2 Growing VR penetration in consumer electronics
- 3.3.2 Market challenge analysis
- 3.3.2.1 High initial investments and device compatibility restrictions
- 3.3.2.2 Spatial discomfort and risk of other ailments
- 3.3.1 Market driver analysis
- 3.4 Industry Opportunities & Challenges
- 3.5 Industry Analysis Tools
- 3.5.1 PORTER's Analysis
- 3.5.2 Macroeconomic Analysis
Chapter 4 Virtual Reality Market Device Outlook
- 4.1 Virtual Reality Market Share By Device, 2018 - 2030 (USD Million)
- 4.2 Device Movement Analysis & Market Share, 2022 & 2030
- 4.3 Virtual Reality Market Estimates & Forecast, By Device (USD Million)
- 4.3.1 Head-Mounted Display (HMD)
- 4.3.2 Gesture-Tracking Device (GTD)
- 4.3.3 Projectors & Display Wall (PDW)
Chapter 5 Virtual Reality Market Technology Outlook
- 5.1 Virtual Reality Market Share By Technology, 2018 - 2030 (USD Million)
- 5.2 Technology Movement Analysis & Market Share, 2022 & 2030
- 5.3 Virtual Reality Market Estimates & Forecast, By Technology (USD Million)
- 5.3.1 Semi & Fully Immersive
- 5.3.2 Non-immersive
Chapter 6 Virtual Reality Market Component Outlook
- 6.1 Virtual Reality Market Share By Component, 2018 - 2030 (USD Million)
- 6.2 Component Movement Analysis & Market Share, 2022 & 2030
- 6.3 Virtual Reality Market Estimates & Forecast, By Component (USD Million)
- 6.3.1 Hardware
- 6.3.2 Software
Chapter 7 Virtual Reality Market Application Outlook
- 7.1 Virtual Reality Market Share By Application, 2018 - 2030 (USD Million)
- 7.2 Application Movement Analysis & Market Share, 2022 & 2030
- 7.3 Virtual Reality Market Estimates & Forecast, By Application (USD Million)
- 7.3.1 Aerospace & Defense
- 7.3.2 Consumer
- 7.3.3 Commercial
- 7.3.4 Enterprise
- 7.3.5 Healthcare
- 7.3.6 Others
Chapter 8 Virtual Reality Regional Outlook
- 8.1 Virtual Reality Market Share By Region, 2022 & 2030
- 8.2 North America
- 8.2.1 North America virtual reality market, 2018 - 2030
- 8.2.2 U.S.
- 8.2.2.1 U.S. virtual reality market, 2018 - 2030 (USD Million)
- 8.2.3 Canada
- 8.2.3.1 Canada virtual reality market, 2018 - 2030 (USD Million)
- 8.2.4 Mexico
- 8.2.4.1 Canada virtual reality market, 2018 - 2030 (USD Million)
- 8.3 Europe
- 8.3.1 Europe virtual reality market, 2018 - 2030
- 8.3.2 UK
- 8.3.2.1 UK virtual reality market, 2018 - 2030 (USD Million)
- 8.3.3 Germany
- 8.3.3.1 Germany virtual reality market, 2018 - 2030 (USD Million)
- 8.3.4 Italy
- 8.3.4.1 Italy virtual reality market, 2018 - 2030 (USD Million)
- 8.3.5 France
- 8.3.5.1 France virtual reality market, 2018 - 2030 (USD Million)
- 8.4 Asia Pacific
- 8.4.1 Asia Pacific virtual reality market, 2018 - 2030
- 8.4.2 China
- 8.4.2.1 China virtual reality market, 2018 - 2030 (USD Million)
- 8.4.3 Japan
- 8.4.3.1 Japan virtual reality market, 2018 - 2030 (USD Million)
- 8.4.4 South Korea
- 8.4.4.1 South Korea virtual reality market, 2018 - 2030 (USD Million)
- 8.4.5 India
- 8.4.5.1 India virtual reality market, 2018 - 2030 (USD Million)
- 8.5 South America
- 8.5.1 South America virtual reality market, 2018 - 2030
- 8.5.2 Brazil
- 8.5.2.1 Brazil virtual reality market, 2018 - 2030 (USD Million)
- 8.5.3 Argentina
- 8.5.3.1 Argentina virtual reality market, 2018 - 2030 (USD Million)
- 8.6 MEA
- 8.6.1 MEA virtual reality market, 2018 - 2030
- 8.6.2 Saudi Arabia
- 8.6.2.1 Saudi Arabia virtual reality market, 2018 - 2030 (USD Million)
- 8.6.3 South Africa
- 8.6.3.1 South Africa virtual reality market, 2018 - 2030 (USD Million)
Chapter 9 Competitive Landscape
- 9.1 Key Market Participants
- 9.1.1 Alphabet Inc.
- 9.1.2 Barco NV
- 9.1.3 CyberGlove Systems Inc.
- 9.1.4 Meta Platforms, Inc.
- 9.1.5 HTC Corporation
- 9.1.6 Microsoft Corporation
- 9.1.7 Samsung Electronics Co., Ltd
- 9.1.8 Sensics, Inc.
- 9.1.9 Sixense Enterprises Inc. (Penumbra, Inc.)
- 9.1.10 Ultraleap Limited
- 9.2 Recent Developments & Impact Analysis, By Key Market Participants
- 9.3 Company Categorization
- 9.4 Participant's Overview
- 9.5 Financial Performance
- 9.6 Product Benchmarking
- 9.7 Company Heat Map Analysis
- 9.8 Company Market Share Analysis, 2022
- 9.9 Strategy Mapping
- 9.9.1 Expansion
- 9.9.2 Mergers & acquisitions
- 9.9.3 Collaborations
- 9.9.4 New product launches
- 9.9.5 Research & development
