|
|
市場調査レポート
商品コード
1171124
プラスチックパレット市場:規模、シェア、動向分析レポート:材料別、タイプ別、最終用途別、地域別、セグメント別予測(2022年~2030年)Plastic Pallets Market Size, Share & Trends Analysis Report By Material (High-density Polyethylene, Low-density Polyethylene), By Type (Nestable, Rackable, Stackable), By End-use, By Region, And Segment Forecasts, 2022 - 2030 |
||||||
|
|
|||||||
|
● お客様のご希望に応じて、既存データの加工や未掲載情報(例:国別セグメント)の追加などの対応が可能です。 詳細はお問い合わせください。 |
|||||||


| プラスチックパレット市場:規模、シェア、動向分析レポート:材料別、タイプ別、最終用途別、地域別、セグメント別予測(2022年~2030年) |
|
出版日: 2022年11月04日
発行: Grand View Research
ページ情報: 英文 150 Pages
納期: 2~10営業日
|
- 全表示
- 概要
- 図表
- 目次
世界のプラスチックパレットの市場規模は、2022年~2030年の予測期間中に5.2%のCAGRで拡大し、2030年までに97億2,000万米ドルに達すると予測されています。
当レポートでは、世界のプラスチックパレット市場について調査し、市場の現状とともに、材料別、タイプ別、最終用途別、地域別動向、および市場に参入する企業のプロファイルなどを提供しています。
目次
第1章 調査手法と範囲
第2章 エグゼクティブサマリー
第3章 市場変数、動向、および範囲
- 市場系列の見通し
- 浸透と成長の見通しのマッピング
- 業界バリューチェーン分析
- 技術タイムライン
- 規制の枠組み
- 米国規制
- カナダ規制
- EU規制
- 市場力学
- 市場促進要因分析
- 市場抑制要因
- 市場の課題
- 事業環境分析:プラスチックパレット市場
- 市場戦略
第4章 プラスチックパレット市場:材料別推定・動向分析
- 定義と範囲
- プラスチックパレット市場:材料別変動分析、2020年と2028年
- 高密度ポリエチレン(HDPE)
- 低密度ポリエチレン(LDPE)
- ポリプロピレン(PP)
- その他
第5章 プラスチックパレット市場:タイプ別推定・動向分析
- プラスチックパレット市場:タイプ別変動分析、2020年と2028年
- ネスト型
- ラック型
- スタック型
- その他
第6章 プラスチックパレット市場:最終用途別推定・動向分析
- プラスチックパレット市場:最終用途別変動分析、2020年と2028年
- 食品・飲料
- 化学品
- 医薬品
- 石油・潤滑油
- その他
第7章 プラスチックパレット市場:地域別推定・動向分析
- プラスチックパレット市場:地域別変動分析、2020年と2028年
- 北米
- 欧州
- アジア太平洋
- 中南米
- 中東・アフリカ
第8章 競合情勢
- 世界の主要参入企業、そのイニシアチブ、および市場への影響
- 主要企業/競合の分類
- 公開会社
- 非公開会社
第9章 企業プロファイル
- Orbis Corporation
- Rehrig Pacific Company
- Monoflo International
- CABKA Group
- Greystone Logistics
- TMF Corporation
- Allied Plastics, Inc.
- Perfect Pallets, Inc.
- Polymer Solutions International, Inc.
- TranPak, Inc.
第10章 原料ポートフォリオ分析
List of Tables
- Table 1 Plastic pallets market estimates and forecasts, by HDPE, 2017 - 2030 (Million Units) (USD Million)
- Table 2 Plastic pallets market estimates and forecasts, by LDPE, 2017 - 2030 (Million Units) (USD Million)
- Table 3 Plastic pallets market estimates and forecasts, by PP, 2017 - 2030 (Million Units) (USD Million)
- Table 4 Plastic pallets market estimates and forecasts, by others, 2017 - 2030 (Million Units) (USD Million)
- Table 5 Nestable plastic pallets market estimates and forecasts, 2017 - 2030 (Million Units) (USD Million)
- Table 6 Rackable plastic pallets market estimates and forecasts, 2017 - 2030 (Million Units) (USD Million)
- Table 7 Stackable plastic pallets market estimates and forecasts, 2017 - 2030 (Million Units) (USD Million)
- Table 8 Others plastic pallets market estimates and forecasts, 2017 - 2030 (Million Units) (USD Million)
- Table 9 Plastic pallets market estimates and forecasts, in food & beverages, 2017 - 2030 (Million Units) (USD Million)
- Table 10 Plastic pallets market estimates and forecasts, in chemicals, 2017 - 2030 (Million Units) (USD Million)
- Table 11 Plastic pallets market estimates and forecasts, in pharmaceuticals, 2017 - 2030 (Million Units) (USD Million)
- Table 12 Plastic pallets market estimates and forecasts, in petroleum & lubricants, 2017 - 2030 (USD Million)
- Table 13 Plastic pallets market estimates and forecasts, in others, 2017 - 2030 (Million Units) (USD Million)
- Table 14 North America plastic pallets market estimates and forecasts, 2017 - 2030 (Million Units) (USD Million)
- Table 15 North America plastic pallets market estimates and forecasts, by material, 2017 - 2030 (Million Units)
- Table 16 North America plastic pallets market estimates and forecasts, by material, 2017 - 2030 (USD Million)
- Table 17 North America plastic pallets market estimates and forecasts, by type, 2017 - 2030 (Million Units)
- Table 18 North America plastic pallets market estimates and forecasts, by type, 2017 - 2030 (USD Million)
- Table 19 North America plastic pallets market estimates and forecasts, by end-use, 2017 - 2030 (Million Units)
- Table 20 North America plastic pallets market estimates and forecasts, by end-use, 2017 - 2030 (USD Million)
- Table 21 U.S. plastic pallets market estimates and forecasts, 2017 - 2030 (Million Units) (USD Million)
- Table 22 U.S. plastic pallets market estimates and forecasts, by material, 2017 - 2030 (Million Units)
- Table 23 U.S. plastic pallets market estimates and forecasts, by material, 2017 - 2030 (USD Million)
- Table 24 U.S. plastic pallets market estimates and forecasts, by type, 2017 - 2030 (Million Units)
- Table 25 U.S. plastic pallets market estimates and forecasts, by type, 2017 - 2030 (USD Million)
- Table 26 U.S. plastic pallets market estimates and forecasts, by end-use, 2017 - 2030 (Million Units)
- Table 27 U.S. plastic pallets market estimates and forecasts, by end-use, 2017 - 2030 (USD Million)
- Table 28 Canada plastic pallets market estimates and forecasts, 2017 - 2030 (Million Units) (USD Million)
- Table 29 Canada plastic pallets market estimates and forecasts, by material, 2017 - 2030 (Million Units)
- Table 30 Canada plastic pallets market estimates and forecasts, by material, 2017 - 2030 (USD Million)
- Table 31 Canada plastic pallets market estimates and forecasts, by type, 2017 - 2030 (Million Units)
- Table 32 Canada plastic pallets market estimates and forecasts, by type, 2017 - 2030 (USD Million)
- Table 33 Canada plastic pallets market estimates and forecasts, by end-use, 2017 - 2030 (Million Units)
- Table 34 Canada plastic pallets market estimates and forecasts, by end-use, 2017 - 2030 (USD Million)
- Table 35 Mexico plastic pallets market estimates and forecasts, 2017 - 2030 (Million Units) (USD Million)
- Table 36 Mexico plastic pallets market estimates and forecasts, by material, 2017 - 2030 (Million Units)
- Table 37 Mexico plastic pallets market estimates and forecasts, by material, 2017 - 2030 (USD Million)
- Table 38 Mexico plastic pallets market estimates and forecasts, by type, 2017 - 2030 (Million Units)
- Table 39 Mexico plastic pallets market estimates and forecasts, by type, 2017 - 2030 (USD Million)
- Table 40 Mexico plastic pallets market estimates and forecasts, by end-use, 2017 - 2030 (Million Units)
- Table 41 Mexico plastic pallets market estimates and forecasts, by end-use, 2017 - 2030 (USD Million)
- Table 42 Europe plastic pallets market estimates and forecasts, 2017 - 2030 (Million Units) (USD Million)
- Table 43 Europe plastic pallets market estimates and forecasts, by material, 2017 - 2030 (Million Units)
- Table 44 Europe plastic pallets market estimates and forecasts, by material, 2017 - 2030 (USD Million)
- Table 45 Europe plastic pallets market estimates and forecasts, by type, 2017 - 2030 (Million Units)
- Table 46 Europe plastic pallets market estimates and forecasts, by type, 2017 - 2030 (USD Million)
- Table 47 Europe plastic pallets market estimates and forecasts, by end-use, 2017 - 2030 (Million Units)
- Table 48 Europe plastic pallets market estimates and forecasts, by end-use, 2017 - 2030 (USD Million)
- Table 49 Germany plastic pallets market estimates and forecasts, 2017 - 2030 (Million Units) (USD Million)
- Table 50 Germany plastic pallets market estimates and forecasts, by material, 2017 - 2030 (Million Units)
- Table 51 Germany plastic pallets market estimates and forecasts, by material, 2017 - 2030 (USD Million)
- Table 52 Germany plastic pallets market estimates and forecasts, by type, 2017 - 2030 (Million Units)
- Table 53 Germany plastic pallets market estimates and forecasts, by type, 2017 - 2030 (USD Million)
- Table 54 Germany plastic pallets market estimates and forecasts, by end-use, 2017 - 2030 (Million Units)
- Table 55 Germany plastic pallets market estimates and forecasts, by end-use, 2017 - 2030 (USD Million)
- Table 56 UK plastic pallets market estimates and forecasts, 2017 - 2030 (Million Units) (USD Million)
- Table 57 UK plastic pallets market estimates and forecasts, by material, 2017 - 2030 (Million Units)
- Table 58 UK plastic pallets market estimates and forecasts, by material, 2017 - 2030 (USD Million)
- Table 59 UK plastic pallets market estimates and forecasts, by type, 2017 - 2030 (Million Units)
- Table 60 UK plastic pallets market estimates and forecasts, by type, 2017 - 2030 (USD Million)
- Table 61 UK plastic pallets market estimates and forecasts, by end-use, 2017 - 2030 (Million Units)
- Table 62 UK plastic pallets market estimates and forecasts, by end-use, 2017 - 2030 (USD Million)
- Table 63 France plastic pallets market estimates and forecasts, 2017 - 2030 (Million Units) (USD Million)
- Table 64 France plastic pallets market estimates and forecasts, by material, 2017 - 2030 (Million Units)
- Table 65 France plastic pallets market estimates and forecasts, by material, 2017 - 2030 (USD Million)
- Table 66 France plastic pallets market estimates and forecasts, by type, 2017 - 2030 (Million Units)
- Table 67 France plastic pallets market estimates and forecasts, by type, 2017 - 2030 (USD Million)
- Table 68 France plastic pallets market estimates and forecasts, by end-use, 2017 - 2030 (Million Units)
- Table 69 France plastic pallets market estimates and forecasts, by end-use, 2017 - 2030 (USD Million)
- Table 70 Italy plastic pallets market estimates and forecasts, 2017 - 2030 (Million Units) (USD Million)
- Table 71 Italy plastic pallets market estimates and forecasts, by material, 2017 - 2030 (Million Units)
- Table 72 Italy plastic pallets market estimates and forecasts, by material, 2017 - 2030 (USD Million)
- Table 73 Italy plastic pallets market estimates and forecasts, by type, 2017 - 2030 (Million Units)
- Table 74 Italy plastic pallets market estimates and forecasts, by type, 2017 - 2030 (USD Million)
- Table 75 Italy plastic pallets market estimates and forecasts, by end-use, 2017 - 2030 (Million Units)
- Table 76 Italy plastic pallets market estimates and forecasts, by end-use, 2017 - 2030 (USD Million)
- Table 77 Spain plastic pallets market estimates and forecasts, 2017 - 2030 (Million Units) (USD Million)
- Table 78 Spain plastic pallets market estimates and forecasts, 2017 - 2030 (USD Million)
- Table 79 Spain plastic pallets market estimates and forecasts, by material, 2017 - 2030 (Million Units)
- Table 80 Spain plastic pallets market estimates and forecasts, by material, 2017 - 2030 (USD Million)
- Table 81 Spain plastic pallets market estimates and forecasts, by type, 2017 - 2030 (Million Units)
- Table 82 Spain plastic pallets market estimates and forecasts, by type, 2017 - 2030 (USD Million)
- Table 83 Spain plastic pallets market estimates and forecasts, by end-use, 2017 - 2030 (Million Units)
- Table 84 Spain plastic pallets market estimates and forecasts, by end-use, 2017 - 2030 (USD Million)
- Table 85 Asia Pacific plastic pallets market estimates and forecasts, 2017 - 2030 (Million Units) (USD Million)
- Table 86 Asia Pacific plastic pallets market estimates and forecasts, by material, 2017 - 2030 (Million Units)
- Table 87 Asia Pacific plastic pallets market estimates and forecasts, by material, 2017 - 2030 (USD Million)
- Table 88 Asia Pacific plastic pallets market estimates and forecasts, by type, 2017 - 2030 (Million Units)
- Table 89 Asia Pacific plastic pallets market estimates and forecasts, by type, 2017 - 2030 (USD Million)
- Table 90 Asia Pacific plastic pallets market estimates and forecasts, by end-use, 2017 - 2030 (Million Units)
- Table 91 Asia Pacific plastic pallets market estimates and forecasts, by end-use, 2017 - 2030 (USD Million)
- Table 92 China plastic pallets market estimates and forecasts, 2017 - 2030 (Million Units) (USD Million)
- Table 93 China plastic pallets market estimates and forecasts, by material, 2017 - 2030 (Million Units)
- Table 94 China plastic pallets market estimates and forecasts, by material, 2017 - 2030 (USD Million)
- Table 95 China plastic pallets market estimates and forecasts, by type, 2017 - 2030 (Million Units)
- Table 96 China plastic pallets market estimates and forecasts, by type, 2017 - 2030 (USD Million)
- Table 97 China plastic pallets market estimates and forecasts, by end-use, 2017 - 2030 (Million Units)
- Table 98 China plastic pallets market estimates and forecasts, by end-use, 2017 - 2030 (USD Million)
- Table 99 India plastic pallets market estimates and forecasts, 2017 - 2030 (Million Units) (USD Million)
- Table 100 India plastic pallets market estimates and forecasts, by material, 2017 - 2030 (Million Units)
- Table 101 India plastic pallets market estimates and forecasts, by material, 2017 - 2030 (USD Million)
- Table 102 India plastic pallets market estimates and forecasts, by type, 2017 - 2030 (Million Units)
- Table 103 India plastic pallets market estimates and forecasts, by type, 2017 - 2030 (USD Million)
- Table 104 India plastic pallets market estimates and forecasts, by end-use, 2017 - 2030 (Million Units)
- Table 105 India plastic pallets market estimates and forecasts, by end-use, 2017 - 2030 (USD Million)
- Table 106 Japan plastic pallets market estimates and forecasts, 2017 - 2030 (Million Units) (USD Million)
- Table 107 Japan plastic pallets market estimates and forecasts, by material, 2017 - 2030 (Million Units)
- Table 108 Japan plastic pallets market estimates and forecasts, by material, 2017 - 2030 (USD Million)
- Table 109 Japan plastic pallets market estimates and forecasts, by type, 2017 - 2030 (Million Units)
- Table 110 Japan plastic pallets market estimates and forecasts, by type, 2017 - 2030 (USD Million)
- Table 111 Japan plastic pallets market estimates and forecasts, by end-use, 2017 - 2030 (Million Units)
- Table 112 Japan plastic pallets market estimates and forecasts, by end-use, 2017 - 2030 (USD Million)
- Table 113 South Korea plastic pallets market estimates and forecasts, 2017 - 2030 (Million Units) (USD Million)
- Table 114 South Korea plastic pallets market estimates and forecasts, by material, 2017 - 2030 (Million Units)
- Table 115 South Korea plastic pallets market estimates and forecasts, by material, 2017 - 2030 (USD Million)
- Table 116 South Korea plastic pallets market estimates and forecasts, by type, 2017 - 2030 (Million Units)
- Table 117 South Korea plastic pallets market estimates and forecasts, by type, 2017 - 2030 (USD Million)
- Table 118 South Korea plastic pallets market estimates and forecasts, by end-use, 2017 - 2030 (Million Units)
- Table 119 South Korea plastic pallets market estimates and forecasts, by end-use, 2017 - 2030 (USD Million)
- Table 120 Australia plastic pallets market estimates and forecasts, 2017 - 2030 (Million Units) (USD Million)
- Table 121 Australia plastic pallets market estimates and forecasts, by material, 2017 - 2030 (Million Units)
- Table 122 Australia plastic pallets market estimates and forecasts, by material, 2017 - 2030 (USD Million)
- Table 123 Australia plastic pallets market estimates and forecasts, by type, 2017 - 2030 (Million Units)
- Table 124 Australia plastic pallets market estimates and forecasts, by type, 2017 - 2030 (USD Million)
- Table 125 Australia plastic pallets market estimates and forecasts, by end-use, 2017 - 2030 (Million Units)
- Table 126 Australia plastic pallets market estimates and forecasts, by end-use, 2017 - 2030 (USD Million)
- Table 127 Central & South America plastic pallets market estimates and forecasts, 2017 - 2030 (Million Units) (USD Million)
- Table 128 Central & South America plastic pallets market estimates and forecasts, by material, 2017 - 2030 (Million Units)
- Table 129 Central & South America plastic pallets market estimates and forecasts, by material, 2017 - 2030 (USD Million)
- Table 130 Central & South America plastic pallets market estimates and forecasts, by type, 2017 - 2030 (Million Units)
- Table 131 Central & South America plastic pallets market estimates and forecasts, by type, 2017 - 2030 (USD Million)
- Table 132 Central & South America plastic pallets market estimates and forecasts, by end-use, 2017 - 2030 (Million Units)
- Table 133 Central & South America plastic pallets market estimates and forecasts, by end-use, 2017 - 2030 (USD Million)
- Table 134 Brazil plastic pallets market estimates and forecasts, 2017 - 2030 (Million Units) (USD Million)
- Table 135 Brazil plastic pallets market estimates and forecasts, by material, 2017 - 2030 (Million Units)
- Table 136 Brazil plastic pallets market estimates and forecasts, by material, 2017 - 2030 (USD Million)
- Table 137 Brazil plastic pallets market estimates and forecasts, by type, 2017 - 2030 (Million Units)
- Table 138 Brazil plastic pallets market estimates and forecasts, by type, 2017 - 2030 (USD Million)
- Table 139 Brazil plastic pallets market estimates and forecasts, by end-use, 2017 - 2030 (Million Units)
- Table 140 Brazil plastic pallets market estimates and forecasts, by end-use, 2017 - 2030 (USD Million)
- Table 141 Middle East & Africa plastic pallets market estimates and forecasts, 2017 - 2030 (Million Units) (USD Million)
- Table 142 Middle East & Africa plastic pallets market estimates and forecasts, by material, 2017 - 2030 (Million Units)
- Table 143 Middle East & Africa plastic pallets market estimates and forecasts, by material, 2017 - 2030 (USD Million)
- Table 144 Middle East & Africa plastic pallets market estimates and forecasts, by type, 2017 - 2030 (Million Units)
- Table 145 Middle East & Africa plastic pallets market estimates and forecasts, by type, 2017 - 2030 (USD Million)
- Table 146 Middle East & Africa plastic pallets market estimates and forecasts, by end-use, 2017 - 2030 (Million Units)
- Table 147 Middle East & Africa plastic pallets market estimates and forecasts, by end-use, 2017 - 2030 (USD Million)
- Table 148 South Africa plastic pallets market estimates and forecasts, 2017 - 2030 (Million Units) (USD Million)
- Table 149 South Africa plastic pallets market estimates and forecasts, by material, 2017 - 2030 (Million Units)
- Table 150 South Africa plastic pallets market estimates and forecasts, by material, 2017 - 2030 (USD Million)
- Table 151 South Africa plastic pallets market estimates and forecasts, by type, 2017 - 2030 (Million Units)
- Table 152 South Africa plastic pallets market estimates and forecasts, by type, 2017 - 2030 (USD Million)
- Table 153 South Africa plastic pallets market estimates and forecasts, by end-use, 2017 - 2030 (Million Units)
- Table 154 South Africa plastic pallets market estimates and forecasts, by end-use, 2017 - 2030 (USD Million)
List of Figures
- Fig. 1 Information procurement
- Fig. 2 Primary research pattern
- Fig. 3 Primary research process
- Fig. 4 Primary research approaches
- Fig. 5 Plastic pallets market: Market outlook
- Fig. 6 Plastic pallet market: Competitive snapshot
- Fig. 7 Plastic pallet market: Segmental snapshot
- Fig. 8 Plastic pallets market: segmental snapshot
- Fig. 9 Plastic pallets market: penetration and growth prospect mapping
- Fig. 10 Plastic pallets market: Value chain analysis
- Fig. 11 Global PE Production, by region-, 2020
- Fig. 12 Global PE prices (USD/Kg), 2014 - 2020
- Fig. 13 Global PP production, by region -, 2020
- Fig. 14 Global polypropylene prices (USD/Kg), 2014 - 2020
- Fig. 15 Sales channel analysis
- Fig. 16 Global Pharmaceutical Market Growth Rate, 2011 - 2021 (USD Billion)
- Fig. 17 Crude oil prices (USD/barrel), 2013 - 2020
- Fig. 18 Plastic pallets market: Porter's Five Forces Analysis
- Fig. 19 Plastic pallets market: PESTEL analysis
- Fig. 20 Plastic pallets market: material movement analysis, 2020 & 2028
- Fig. 21 Plastic pallets market: type movement analysis, 2020 & 2028
- Fig. 22 Plastic pallets market: end-use movement analysis, 2020 & 2028
- Fig. 23 Global plastic pallets market Regional snapshot
- Fig. 24 Global plastic pallets market: Regional movement analysis, by revenue, 2020 & 2028
- Fig. 25 Participant categorization
- Fig. 26 Plastic pallets market: Competitive dashboard analysis [Public companies]
Plastic Pallets Market Growth & Trends:
The global plastic pallets market size is expected to reach USD 9.72 billion by 2030, according to a new report by Grand View Research, Inc. The market is anticipated to expand at a CAGR of 5.2% from 2022 to 2030. Growing demand for plastic pallets in end-use industries, and increasing demand for logistics services. However, the high upfront cost and environmental concern due to rising plastic waste is attributed to be major restraints for the growth.
Plastic pallet is the foremost choice of industries compared to wood due to their versatile application such as durability, lightweight, and ease of transport, and it does not absorb moisture thus, preventing pallets from infestation, rotting, and fumigation, unlike wood. Therefore, plastic pallets get widely used in the pharmaceutical and food & beverage industry where hygiene requirement is of major concern.
Plastic pallets provide stability to goods during transportation. It is used to lift cargo in warehouses, and industries as well as during shipping from one place to another. It plays a vital role in the supply chain and logistics industry. The rise in logistic demand is driving the industry's growth. For instance, according to the report of the Association for supply chain management, the global supply chain management market is expected to grow by 11.2% from 2020 to 2027. Further, internet penetration across the world is improving at a rapid pace, and thus, the adoption of e-commerce demand which in turn drives the market of plastic pallets.
The COVID-19 pandemic positively impacted e-commerce which accelerated the digital world. According to the report of the United Nation Conference on trade and development, various businesses and consumers went online to suffice the need for supply and demand. Thus, significantly increasing the e-commerce share of world retail trade from 14% in 2019 to 17% in 2020. The e-commerce market is expected to show a steady upward trend during the forecast year. Thus, fueling the growth of the plastic pellets industry.
The impact of the pandemic on the supply chain industry was drastic. Lockdowns across the globe disrupted the supply chain and impacted the overall logistics industry. The Manufacturing, construction, retail trade, and wholesale trade were majorly impacted by the sector. The supply chain disruption caused a downtrend in freight services, resulting in canceled sailings, and flights which in turn reduced the demand for plastic pallets.
Plastic Pallets Market Report Highlights:
- High-density polyethylene (HDPE) accounted for the largest share of 68.4% in the material segment by value in 2021. However, The Polypropylene (PP) material segment is expected to witness the highest growth over the forecast period
- The nestable pallets dominated the market and accounted for the largest revenue share of 43.6% in the type segment in 2021
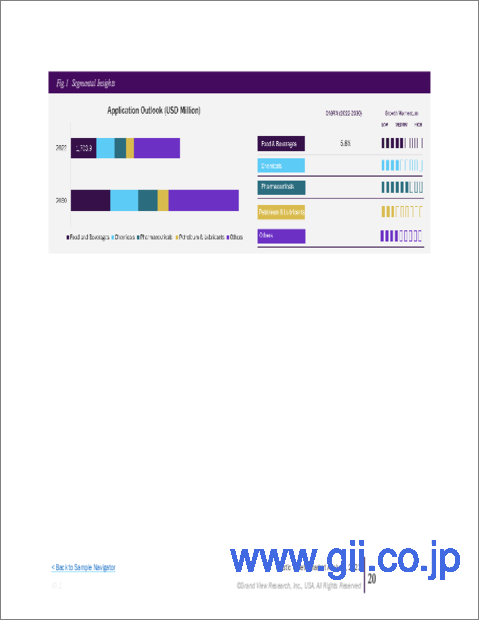
- The food and beverages commanded the largest share in 2021, owning to the expanding agricultural produce, and other food processing industries
- New product developments coupled with mergers & acquisitions, and capacity expansions are some of the strategies adopted by players. For instance, recycled plastic pallets gaining huge attraction due to their sustainable nature
Table of Contents
Chapter 1 Methodology And Scope
- 1.1 Information Procurement
- 1.1.1 Purchased Database
- 1.1.2 GVR's Internal Database
- 1.1.3 Secondary Sources
- 1.1.4 Third-Party Perspective
- 1.1.5 Primary Research
- 1.2 Information Analysis & Data Analysis Models
- 1.3 List of Data Sources
Chapter 2 Executive Summary
- 2.1 Market Insights
- 2.2 Market Outlook
- 2.3 Segmental Outlook
- 2.4 Segmental Outlook (Contd.)
- 2.5 Competitive Outlook
Chapter 3 Market Variables, Trends, And Scope
- 3.1 Market Lineage Outlook
- 3.1.1 Parent Market Outlook: Green Packaging Market
- 3.1.2 Related Market Outlook: Edible Packaging Market
- 3.1.3 Related Market Outlook: Other emerging sustainable packaging products
- 3.2 Penetration & Growth Prospect Mapping
- 3.3 Industry Value Chain Analysis
- 3.3.1 Raw Material Trends
- 3.3.2 Major Raw material Analysis
- 3.3.3 Procurement Best Practices
- 3.3.4 Manufacturing Trends
- 3.3.5 Technology Trends
- 3.3.6 Sales Channel Analysis
- 3.4 Technology Timeline
- 3.5 Regulatory Framework
- 3.5.1 U.S. Regulations
- 3.5.1.1 The United States Federal Food, Drug, and Cosmetic Act
- 3.5.2 Canada Regulations
- 3.5.2.1 Food and Drugs Act
- 3.5.2.2 Food and Drug Regulations
- 3.5.3 EU Regulations
- 3.5.3.1 Framework Regulation (EC) 1935/2004
- 3.5.1 U.S. Regulations
- 3.6 Market Dynamics
- 3.6.1 Market Driver Analysis
- 3.6.1.1 Rising Consumption of Eggs And Fresh Fruits
- 3.6.1.2 Growing Demand for Sustainable Packaging
- 3.6.2 Market Restraints
- 3.6.2.1 Availability of substitute packaging products
- 3.6.3 Market Challenges
- 3.6.3.1 Aesthetic limitation of molded pulp products
- 3.6.1 Market Driver Analysis
- 3.7 Business Environment Analysis: Plastic Pallets Market
- 3.7.1 Industry Analysis: Porter's
- 3.7.2 Pestel Analysis
- 3.7.3 Major Deals & Strategic Alliances
- 3.7.3.1 Joint Ventures
- 3.7.3.2 Mergers & Acquisitions
- 3.7.3.3 Technology Collaboration
- 3.8 Market Strategies
- 3.8.1.1 Impacts of COVID-19
Chapter 4. Plastic Pallets Market: Material Estimates & Trend Analysis
- 4.1. Definitions & Scope
- 4.2. Plastic pallets market: Material Movement Analysis, 2020 & 2028
- 4.3. High-Density Polyethylene (HDPE)
- 4.3.1. Market estimates and forecasts, 2017 - 2030 (Million Units) (USD Million)
- 4.4. Low-Density Polyethylene (LDPE)
- 4.4.1. Market estimates and forecasts, 2017 - 2030 (Million Units) (USD Million)
- 4.5. Polypropylene (PP)
- 4.5.1. Market estimates and forecasts, 2017 - 2030 (Million Units) (USD Million)
- 4.6. Others
- 4.6.1. Market estimates and forecasts, 2017 - 2030 (Million Units) (USD Million)
Chapter 5. Plastic pallets market: Type Estimates & Trend Analysis
- 5.1. Plastic pallets market: Type Movement Analysis, 2020 & 2028
- 5.2. Nestable
- 5.2.1. Market estimates and forecasts, 2017 - 2030 (Million Units) (USD Million)
- 5.3. Rackable
- 5.3.1. Market estimates and forecasts, 2017 - 2030 (Million Units) (USD Million)
- 5.4. Stackable
- 5.4.1. Market estimates and forecasts, 2017 - 2030 (Million Units) (USD Million)
- 5.5. Others
- 5.5.1. Market estimates and forecasts, 2017 - 2030 (Million Units) (USD Million)
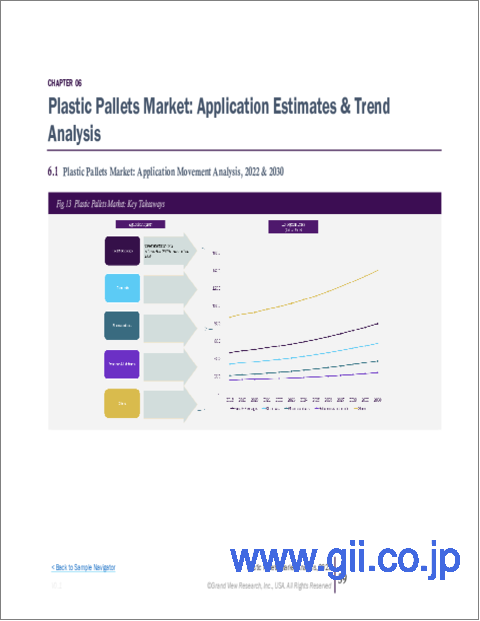
Chapter 6. Plastic pallets market: End-use Estimates & Trend Analysis
- 6.1. Plastic pallets market: End-use Movement Analysis, 2020 & 2028
- 6.2. Food & Beverages
- 6.2.1. Market estimates and forecasts, 2017 - 2030 (Million Units) (USD Million)
- 6.3. Chemicals
- 6.3.1. Market estimates and forecasts, 2017 - 2030 (Million Units) (USD Million)
- 6.4. Pharmaceutical
- 6.4.1. Market estimates and forecasts, 2017 - 2030 (Million Units) (USD Million)
- 6.5. Petroleum & Lubricants
- 6.5.1. Market estimates and forecasts, 2017 - 2030 (Million Units) (USD Million)
- 6.6. Others
- 6.6.1. Market estimates and forecasts, 2017 - 2030 (Million Units) (USD Million)
Chapter 7. Plastic pallets market: Regional Estimates & Trend Analysis
- 7.1. Plastic pallets market: Regional movement analysis, 2020 & 2028
- 7.2. North America
- 7.2.1. Market estimates and forecasts, 2017 - 2030 (Million Units) (USD Million)
- 7.2.2. Market estimates and forecasts, by material, 2017 - 2030 (Million Units) (USD Million)
- 7.2.3. Market estimates and forecasts, by type, 2017 - 2030 (Million Units) (USD Million)
- 7.2.4. Market estimates and forecasts, by end-use, 2017 - 2030 (Million Units) (USD Million)
- 7.2.5. U.S.
- 7.2.5.1. Market estimates and forecasts, 2017 - 2030 (Million Units) (USD Million)
- 7.2.5.2. Market estimates and forecasts, by material, 2017 - 2030 (Million Units) (USD Million)
- 7.2.5.3. Market estimates and forecasts, by type, 2017 - 2030 (Million Units) (USD Million)
- 7.2.5.4. Market estimates and forecasts, by end-use, 2017 - 2030 (Million Units) (USD Million)
- 7.2.6. Canada
- 7.2.6.1. Market estimates and forecasts, 2017 - 2030 (Million Units) (USD Million)
- 7.2.6.2. Market estimates and forecasts, by material, 2017 - 2030 (Million Units) (USD Million)
- 7.2.6.3. Market estimates and forecasts, by type, 2017 - 2030 (Million Units) (USD Million)
- 7.2.6.4. Market estimates and forecasts, by end-use, 2017 - 2030 (Million Units) (USD Million)
- 7.2.7. Mexico
- 7.2.7.1. Market estimates and forecasts, 2017 - 2030 (Million Units) (USD Million)
- 7.2.7.2. Market estimates and forecasts, by material, 2017 - 2030 (Million Units) (USD Million)
- 7.2.7.3. Market estimates and forecasts, by type, 2017 - 2030 (Million Units) (USD Million)
- 7.2.7.4. Market estimates and forecasts, by end-use, 2017 - 2030 (Million Units) (USD Million)
- 7.3. Europe
- 7.3.1. Market estimates and forecasts, 2017 - 2030 (Million Units) (USD Million)
- 7.3.2. Market estimates and forecasts, by material, 2017 - 2030 (Million Units) (USD Million)
- 7.3.3. Market estimates and forecasts, by type, 2017 - 2030 (Million Units) (USD Million)
- 7.3.4. Market estimates and forecasts, by end-use, 2017 - 2030 (Million Units) (USD Million)
- 7.3.5. Germany
- 7.3.5.1. Market estimates and forecasts, 2017 - 2030 (Million Units) (USD Million)
- 7.3.5.2. Market estimates and forecasts, by material, 2017 - 2030 (Million Units) (USD Million)
- 7.3.5.3. Market estimates and forecasts, by type, 2017 - 2030 (Million Units) (USD Million)
- 7.3.5.4. Market estimates and forecasts, by end-use, 2017 - 2030 (Million Units) (USD Million)
- 7.3.6.U.K.
- 7.3.6.1. Market estimates and forecasts, 2017 - 2030 (Million Units) (USD Million)
- 7.3.6.2. Market estimates and forecasts, by material, 2017 - 2030 (Million Units) (USD Million)
- 7.3.6.3. Market estimates and forecasts, by type, 2017 - 2030 (Million Units) (USD Million)
- 7.3.6.4. Market estimates and forecasts, by end-use, 2017 - 2030 (Million Units) (USD Million)
- 7.3.7. France
- 7.3.7.1. Market estimates and forecasts, 2017 - 2030 (Million Units) (USD Million)
- 7.3.7.2. Market estimates and forecasts, by material, 2017 - 2030 (Million Units) (USD Million)
- 7.3.7.3. Market estimates and forecasts, by type, 2017 - 2030 (Million Units) (USD Million)
- 7.3.7.4. Market estimates and forecasts, by end-use, 2017 - 2030 (Million Units) (USD Million)
- 7.3.8. Italy
- 7.3.8.1. Market estimates and forecasts, 2017 - 2030 (Million Units) (USD Million)
- 7.3.8.2. Market estimates and forecasts, by material, 2017 - 2030 (Million Units) (USD Million)
- 7.3.8.3. Market estimates and forecasts, by type, 2017 - 2030 (Million Units) (USD Million)
- 7.3.8.4. Market estimates and forecasts, by end-use, 2017 - 2030 (Million Units) (USD Million)
- 7.3.9. Spain
- 7.3.9.1. Market estimates and forecasts, 2017 - 2030 (Million Units) (USD Million)
- 7.3.9.2. Market estimates and forecasts, by material, 2017 - 2030 (Million Units) (USD Million)
- 7.3.9.3. Market estimates and forecasts, by type, 2017 - 2030 (Million Units) (USD Million)
- 7.3.9.4. Market estimates and forecasts, by end-use, 2017 - 2030 (Million Units) (USD Million)
- 7.4. Asia Pacific
- 7.4.1. Market estimates and forecasts, 2017 - 2030 (Million Units) (USD Million)
- 7.4.2. Market estimates and forecasts, by material, 2017 - 2030 (Million Units) (USD Million)
- 7.4.3. Market estimates and forecasts, by type, 2017 - 2030 (Million Units) (USD Million)
- 7.4.4. Market estimates and forecasts, by end-use, 2017 - 2030 (Million Units) (USD Million)
- 7.4.5. China
- 7.4.5.1. Market estimates and forecasts, 2017 - 2030 (Million Units) (USD Million)
- 7.4.5.2. Market estimates and forecasts, by material, 2017 - 2030 (Million Units) (USD Million)
- 7.4.5.3. Market estimates and forecasts, by type, 2017 - 2030 (Million Units) (USD Million)
- 7.4.5.4. Market estimates and forecasts, by end-use, 2017 - 2030 (Million Units) (USD Million)
- 7.4.6. India
- 7.4.6.1. Market estimates and forecasts, 2017 - 2030 (Million Units) (USD Million)
- 7.4.6.2. Market estimates and forecasts, by material, 2017 - 2030 (Million Units) (USD Million)
- 7.4.6.3. Market estimates and forecasts, by type, 2017 - 2030 (Million Units) (USD Million)
- 7.4.6.4. Market estimates and forecasts, by end-use, 2017 - 2030 (Million Units) (USD Million)
- 7.4.7. Japan
- 7.4.7.1. Market estimates and forecasts, 2017 - 2030 (Million Units) (USD Million)
- 7.4.7.2. Market estimates and forecasts, by material, 2017 - 2030 (Million Units) (USD Million)
- 7.4.7.3. Market estimates and forecasts, by type, 2017 - 2030 (Million Units) (USD Million)
- 7.4.7.4. Market estimates and forecasts, by end-use, 2017 - 2030 (Million Units) (USD Million)
- 7.4.8. South Korea
- 7.4.8.1. Market estimates and forecasts, 2017 - 2030 (Million Units) (USD Million)
- 7.4.8.2. Market estimates and forecasts, by material, 2017 - 2030 (Million Units) (USD Million)
- 7.4.8.3. Market estimates and forecasts, by type, 2017 - 2030 (Million Units) (USD Million)
- 7.4.8.4. Market estimates and forecasts, by end-use, 2017 - 2030 (Million Units) (USD Million)
- 7.4.9. Australia
- 7.4.9.1. Market estimates and forecasts, 2017 - 2030 (Million Units) (USD Million)
- 7.4.9.2. Market estimates and forecasts, by material, 2017 - 2030 (Million Units) (USD Million)
- 7.4.9.3. Market estimates and forecasts, by type, 2017 - 2030 (Million Units) (USD Million)
- 7.4.9.4. Market estimates and forecasts, by end-use, 2017 - 2030 (Million Units) (USD Million)
- 7.5. Central & South America
- 7.5.1. Market estimates and forecasts, 2017 - 2030 (Million Units) (USD Million)
- 7.5.2. Market estimates and forecasts, by material, 2017 - 2030 (Million Units) (USD Million)
- 7.5.3. Market estimates and forecasts, by type, 2017 - 2030 (Million Units) (USD Million)
- 7.5.4. Market estimates and forecasts, by end-use, 2017 - 2030 (Million Units) (USD Million)
- 7.5.5. Brazil
- 7.5.5.1. Market estimates and forecasts, 2017 - 2030 (Million Units) (USD Million)
- 7.5.5.2. Market estimates and forecasts, by material, 2017 - 2030 (Million Units) (USD Million)
- 7.5.5.3. Market estimates and forecasts, by type, 2017 - 2030 (Million Units) (USD Million)
- 7.5.5.4. Market estimates and forecasts, by end-use, 2017 - 2030 (Million Units) (USD Million)
- 7.6. Middle East & Africa
- 7.6.1. Market estimates and forecasts, 2017 - 2030 (Million Units) (USD Million)
- 7.6.2. Market estimates and forecasts, by material, 2017 - 2030 (Million Units) (USD Million)
- 7.6.3. Market estimates and forecasts, by type, 2017 - 2030 (Million Units) (USD Million)
- 7.6.4. Market estimates and forecasts, by end-use, 2017 - 2030 (Million Units) (USD Million)
- 7.6.5. South Africa
- 7.6.5.1. Market estimates and forecasts, 2017 - 2030 (Million Units) (USD Million)
- 7.6.5.2. Market estimates and forecasts, by material, 2017 - 2030 (Million Units) (USD Million)
- 7.6.5.3. Market estimates and forecasts, by type, 2017 - 2030 (Million Units) (USD Million)
- 7.6.5.4. Market estimates and forecasts, by end-use, 2017 - 2030 (Million Units) (USD Million)
Chapter 8. Competitive Landscape
- 8.1. Key Global Players, Their Initiatives, & Their Impact on the Market
- 8.2. Key Company/Competition Categorization
- 8.3. Public Companies
- 8.3.1. Company Market Position Analysis
- 8.3.2. Company Market Share/Ranking
- 8.3.3. Competitive Dashboard Analysis
- 8.4.3.1. Market Differentiators
- 8.4.3.2. Synergy Analysis
- 8.5. Private Companies
- 8.5.1. Key Emerging Companies
- 8.5.2. Geographical Presence
- 8.5.3. Company Market Position Analysis
Chapter 9. Company Profiles
- 9.1. Orbis Corporation
- 9.1.1. Company overview
- 9.1.2. Financial performance
- 9.1.3. Type benchmarking
- 9.1.4. Strategic initiatives
- 9.2. Rehrig Pacific Company
- 9.2.1. Company overview
- 9.2.2. Financial performance
- 9.2.3. Type benchmarking
- 9.2.4. Strategic initiatives
- 9.3. Monoflo International
- 9.3.1. Company overview
- 9.3.2. Financial performance
- 9.3.3. Type benchmarking
- 9.3.4. Strategic initiatives
- 9.4. CABKA Group
- 9.4.1. Company overview
- 9.4.2. Financial performance
- 9.4.3. Type benchmarking
- 9.4.4. Strategic initiatives
- 9.5. Greystone Logistics
- 9.5.1. Company overview
- 9.5.2. Financial performance
- 9.5.3. Type benchmarking
- 9.5.4. Strategic initiatives
- 9.6. TMF Corporation
- 9.6.1. Company overview
- 9.6.2. Financial performance
- 9.6.3. Type benchmarking
- 9.6.4. Strategic initiatives
- 9.7. Allied Plastics, Inc.
- 9.7.1. Company overview
- 9.7.2. Financial performance
- 9.7.3. Type benchmarking
- 9.7.4. Strategic initiatives
- 9.8. Perfect Pallets, Inc.
- 9.8.1. Company overview
- 9.8.2. Financial performance
- 9.8.3. Type benchmarking
- 9.8.4. Strategic initiatives
- 9.9. Polymer Solutions International, Inc.
- 9.9.1. Company overview
- 9.9.2. Financial performance
- 9.9.3. Type benchmarking
- 9.9.4. Strategic initiatives
- 9.10. TranPak, Inc.
- 9.10.1. Company overview
- 9.10.2. Financial performance
- 9.10.3. Type benchmarking
- 9.10.4. Strategic initiatives
Chapter 10 Raw Material Portfolio Analysis
- 10.1 Vendor Landscape
- 10.1.1 List of Key Distributors & Channel Partners
- 10.2 Supply Risk & Profitability Correlation
- 10.3 Raw Material Supplier Ecosystem
- 10.4 Sourcing Best Practices